做多
做多在观点中搜索"price action"
做多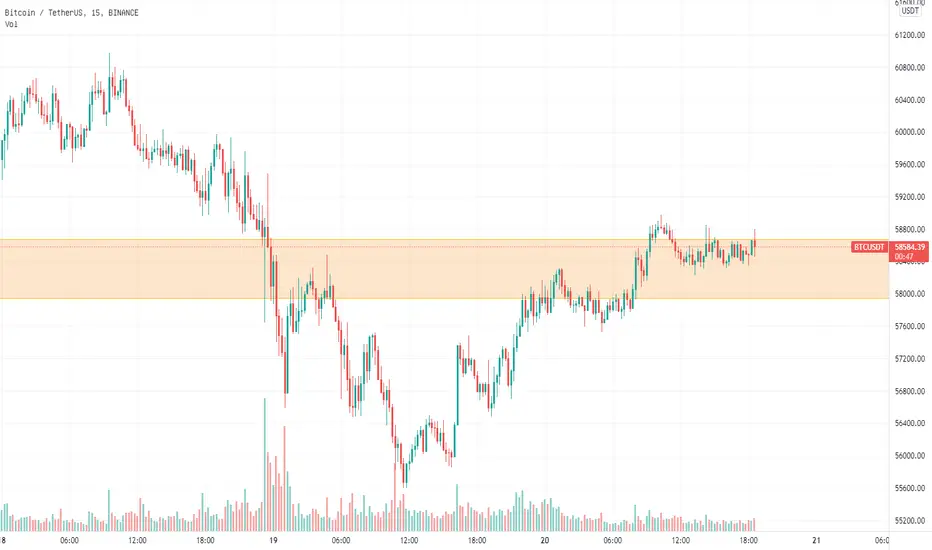
Analyzing the Price Action of EDGEPrice action analysis shows that EDGE has been consolidating in a tight range recently. Traders should watch for a breakout from this range to confirm a new trend direction.

从价格行为(Price Action)看比特币(Bitcoin)未来何谓价格行为?
蜡烛图背后的逻辑内容,
同时,它是场内交易者(机构,大型玩家,EA程序,对冲基金...等) 介入的结果而非起因 ~
换句话说,如果能够通透PA(Price Action) 就具备了读懂图表背后讯息的能力
各位交易者,下午好
有鉴于比特币近期的大幅波动,成为不少Coin持有者的热门话题,同时也成为不少圈外人的关注焦点...
这意味着什么?
令我想起了华尔街的擦鞋童理论...这非常可怕...
当所有人都认为比特币的可以赚钱的时候...灾难即将到来...
事实上,目前还没有到这个时候...许多圈外人被目前的跌势给吓到...暂停了对于矿机,coin的投资计划...
当初2万美金换1个比特币时(我深刻的记得当时,我身边好多"不相干"的朋友都对Bitcoin产生了兴趣跃跃欲试筹备计画着...)的狂热阶段如今也得到了缓解. ..
这意味着什么?
我认为,比特币还有一波...而这一波将决定比特币的未来
而比特币的生命线 就是取决于我图中所示的两条线A,B线
简单理解上,它就是支撑跟阻力线
但从价格行为角度来(PA)来讲,这两根线尤为重要
大部分的情况都已在图表中注明,而这两根线是
趋势线的跌破后,产生的两条腿回撤接下来将引发三重推进向上
如何确认趋势反转?
最后价格上行过程如果未能回撤并有效突破A线之上...并反向朝B线有效突破...
那么比特币的热潮就结束了...将进入黑暗期
操作建议:
目前现价做多...在价格进入A线附近时 将所有持仓了结,并观察有无反转信号
做多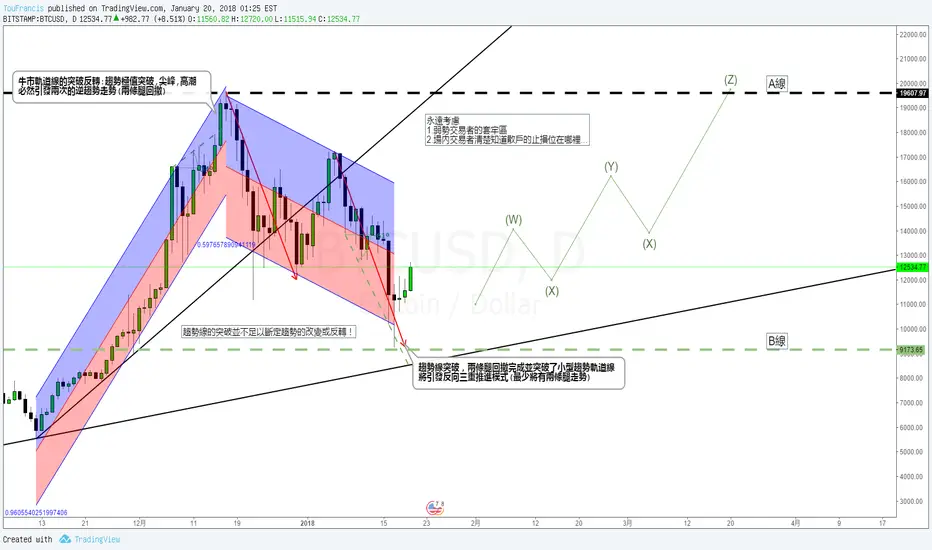

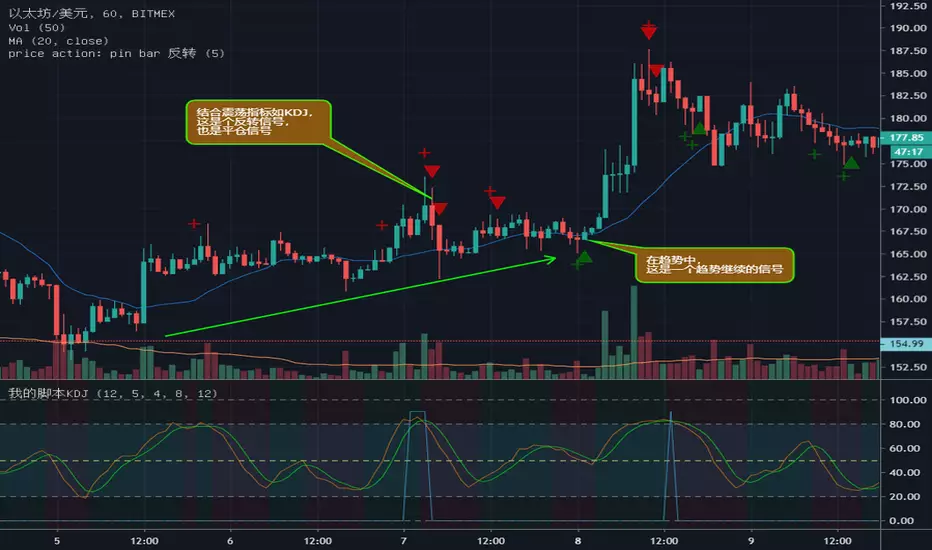
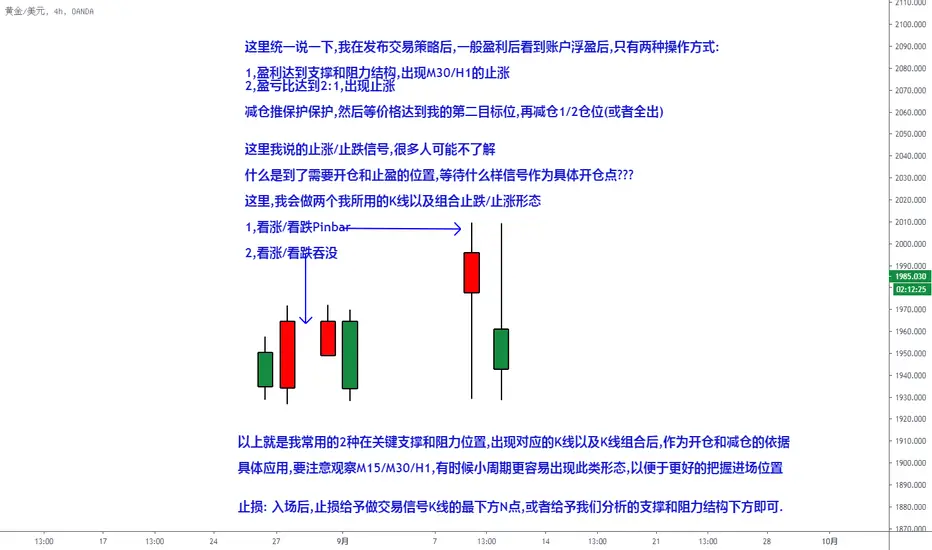
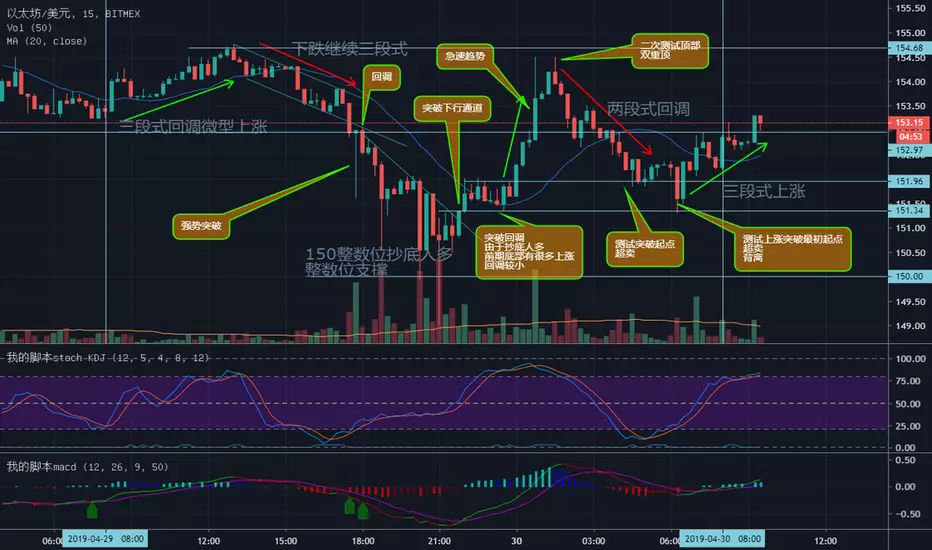
Price Action-交易信号(止跌,止涨,入场,出场)以前我经常提到等待止跌止涨信号,进行交易,减仓,可能很多人还是不是很理解
今天就配置几个图,加以文字说明,来详细的分解如何在关键的支撑和阻力进行识别
以上信号特殊说明:
1,针对顺势情况,回调到支撑,出现信号(小级别M15/M30出现),即可交易
2,针对去摸趋势的顶部和底部的时候,最好等H1/H4出现此类信号后,然后再等回调,出现M30信号进行交易,切勿盲目的进行摸顶摸底
祝愿大家交易愉快!

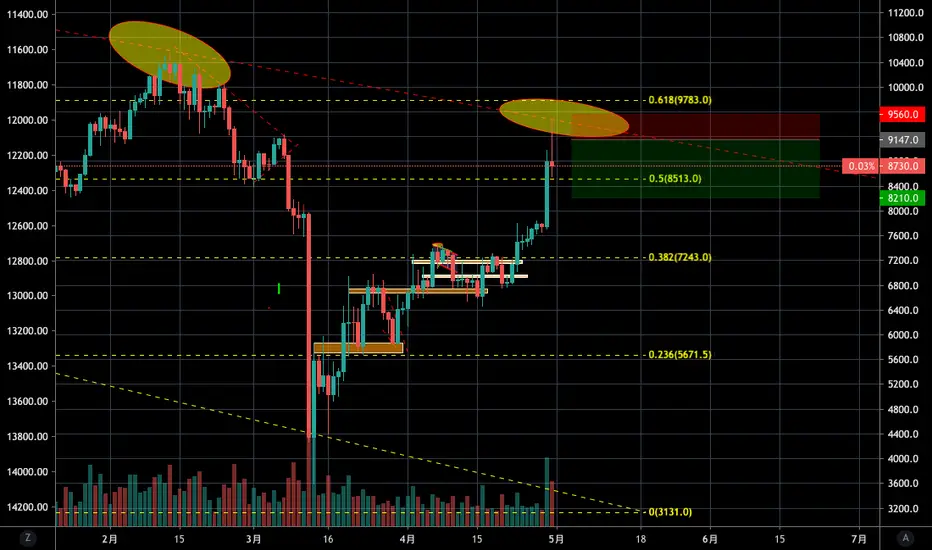
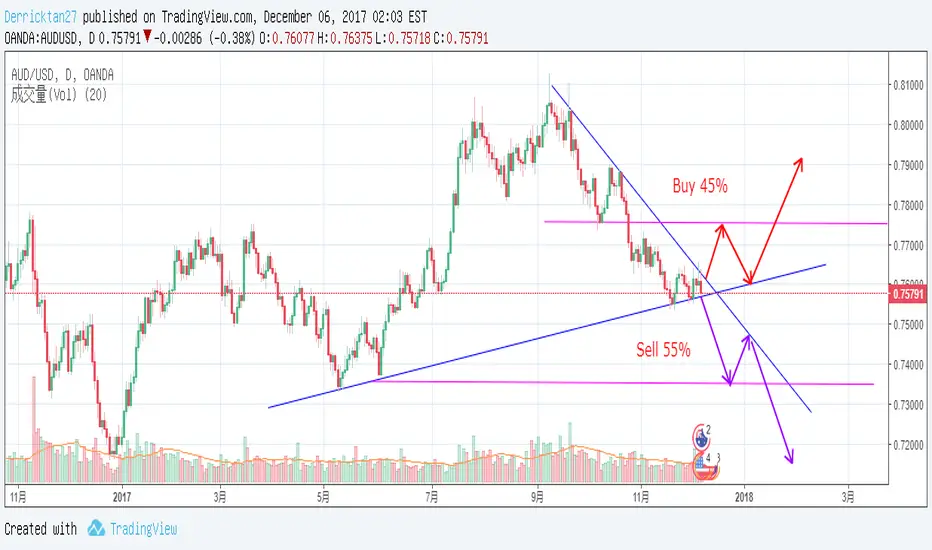
Price Action Signal Descending triangleAUDUSD Daily 出现Descending triangle ,做多的几率是45%而做空的几率是55%。原因是长期都是下坡趋势,所以推测做空的几率比较大。


Bitcoin 22.03.2025: +0.32%
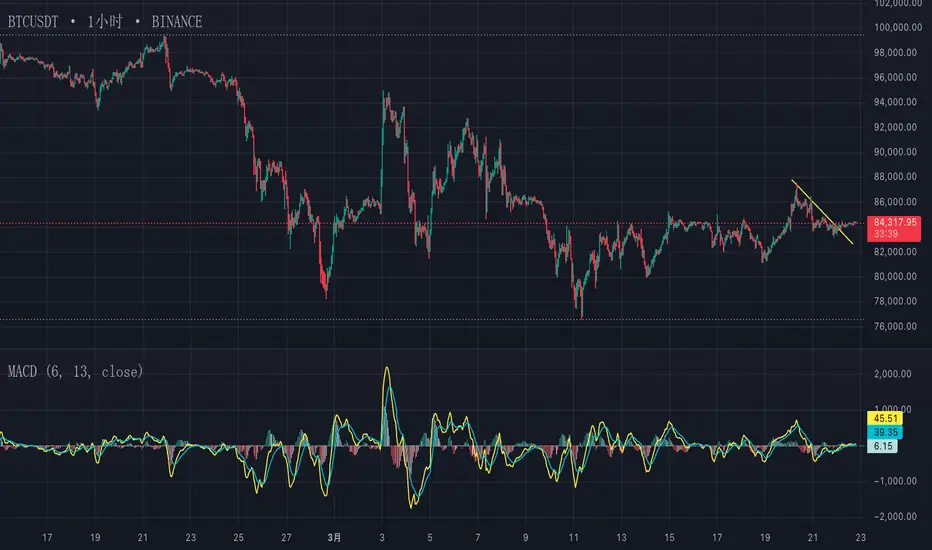
: $84,418.94
: $80,000-$82,000
: $85,000-$88,000, $90,000-$91,000
1. BTC is currently fluctuating within the $83,000-$85,000 range.
2. Short-term consolidation may continue, with key support at $80,000-$82,000.
3. Major resistance zones are at $85,000-$88,000 and $90,000-$91,000.
4. The 4-hour chart exhibits a bearish trend but has broken above the bearish Kumo cloud.
5. On the monthly chart, the 9 EMA continues to provide support, while the MACD pattern resembles the setup before the major rally in June 2021.
Market Sentiment
1. Overall sentiment remains cautiously optimistic, but short-term uncertainty persists.
2. Strong divergence between bulls and bears, leading to indecisive price action.
3. BTC spot ETF investors maintain a positive outlook, with a noticeable rebound in U.S. investor buying interest.
Capital Flows
1. BTC spot ETFs have recorded net inflows for six consecutive days, totaling $83.09 million.
2. ETH spot ETFs have seen net outflows for 13 consecutive days, amounting to $18.63 million.
3. Large institutions (e.g., BlackRock, Fidelity) are executing sizable buy orders.
4. The derivatives market is experiencing net inflows, while the spot market is seeing slight outflows.
Macro Factors
1. The upcoming FOMC meeting could be a key turning point for market trends.
2. Pakistan's proposal to utilize surplus electricity for Bitcoin mining indicates a shifting stance on crypto in emerging markets.
3. The Fed’s balance sheet reduction may have limited long-term impact on BTC, while broader monetary supply (M2) could play a more significant role.
Outlook
1. In the short term, BTC is likely to consolidate within the $80,000-$88,000 range.
2. Investors should closely monitor the impact of the FOMC meeting on market sentiment.
3. Over the long term, continued institutional inflows and supportive policies from emerging markets may drive BTC higher.
4. The market may continue to see BTC outperforming ETH.
Risk Warning
1. Investors should remain cautious, closely track market developments, and adjust strategies accordingly.
2. Short-term uncertainty persists, so it is advisable to monitor support and resistance levels, as well as the FOMC meeting’s impact on the market.
和谐形态交易记录与想法(4)BINANCE:BNBUSDT
这周开了两次单,其中一单是BNB,最后是以打损出场,这一单同样有值得记录的必要
逻辑:
BNB这里出现了一个比较标准的Bat,因为这个图是周四的时候就画出,是有一个预期在的,所以就有一直关注BNB,等待形态完成的0.886点(240左右),然后根据前高的阻力位,其实浅黄色区域我理解都是潜在的开仓机会。虽然有比较标准的Bat形态,但是由于AB段K线数量太少了,我在判断的时候就认为有可能不会形成一个很好的反转。因为在Harmonic Trading Volume 1里面,Carney老师在讲解这个形态的时候,是有强调AB=CD形态或者1.27AB=CD去确定PRZ。于是我在240的位置挂了单,也正是这一波挂单导致我被止损掉了。
操作反思:
看了好多老铁的视频,老铁一直在强调的是不要挂单,如果真的是一个机会的话是有足够的时间去进行操作的,不挂单也防止了fomo的产生,虽然Carney老师有强调initial test的必要,但是我认为还是应该更加关注price action再来进行判断,这也是Carney老师在书中强调的。由于Harmonic Trading算是较为左侧的右侧交易方法,也正是这样如果挂单的话很有可能会存在一个亏损,所以如果避免fomo情绪的发生也想进行initial test的话,我的理解可以在目标的和谐形态价位进行多一些的buffer,比如说:和谐价位+相对应百分比的和谐价位(240 + 1% * 240 = 242.4),这种方式可能会更好一些。
后记:
其实我觉得这次的选币没有什么问题,BNB是波动比较小的币种,虽然在240进场,就算到了242也不会有太多的损耗,这个范围也是可以抗一抗的,但是在周五早上有一波拉升,疑似是一波假突破,导致价格超过了止损位,逻辑是没有太多问题的,只不过精准挂单在和谐点位上是需要改正的,应该更多的去关注到达目标点位后的price action再去做决断。
现在BNB价格在我认为的黄色区间里震荡,有在区间稳定的态势,按照Carney老师的说法这种就很有可能导致Pattern Violation,但是我理解这可能和BNB这一币种本身小波动的特性有关,我觉得阻力位仍旧很坚挺,所以还是看空比较好
不要精准挂单和谐点位,关注price action!!切记!
 做空
做空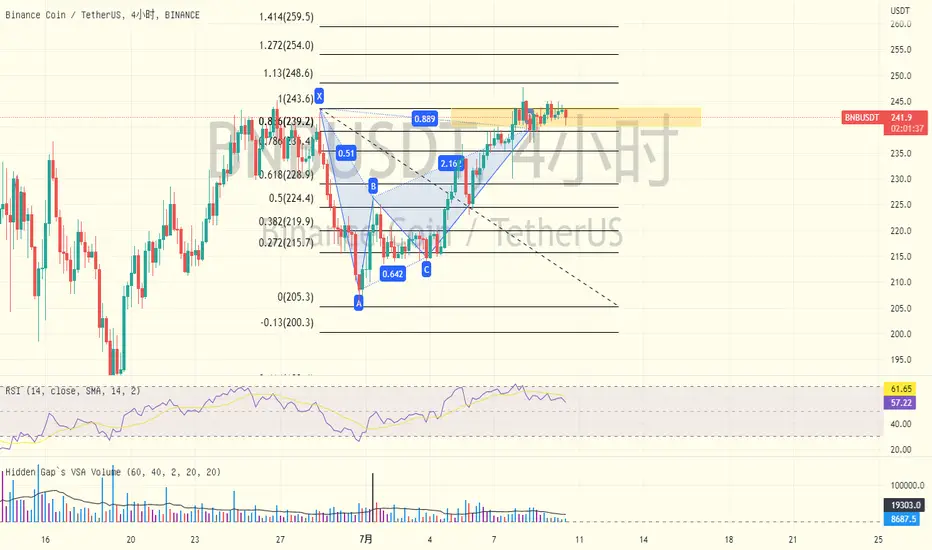
基本面背离,谐波需求叠加区最近狠下心把英文版的谐波交易第一卷看了一遍,明白为何要看原著,翻译本的描述实在是一言难尽。
最后提到PRZ和price action的问题,有三种情况:1.超越PRZ到达stop loss 2.PRZ偏移 3.PRZ之上反抽
谐波的关键在于是否和谐,两点:1.和谐叠加的数量 2.和谐的比例 总之谐波就是要趋势到达和谐的反转区,非常微妙的体系
在最后几章提到止盈(0.382和0.618)和道氏理论中趋势线的结合,跟踪止盈,一般到达0.382,再次price action压下去,0.618往往就难以到达,和PRZ多次测试,使得PRZ削弱了支撑,道理相似。
宋城演艺我认为还是市场对大型演艺业务过度看空了,尽管去年年终业绩确实难看,目前价格接近20年的筹码密集区,今年业绩明显改善,相信很快会反映到价格上。
 做多
做多
Will the rebound in London gold prices continue after hitting a From a 4-hour chart perspective, gold prices remain below the 100-day moving average around 4633. The 14-day RSI is around 36, below 50 and not yet in oversold territory, indicating that downward momentum remains but has not fully dissipated. Furthermore, the death cross of the 21-day and 50-day moving averages, confirmed on March 25th, further strengthens the bearish signal. Looking at the price action over the past two trading days, the bearish momentum is gradually being absorbed, but the price is still trading below key short-term moving averages, showing that the short-term weakness has not yet completely reversed. The previous rebound from below $4099 also indicates that buying interest has begun to emerge at lower levels, and the bulls are attempting to regain control. Overall, gold is currently in a wide-range consolidation phase in the short term.
做空
Soitec-Building the Foundation of Optical Modules Supply ChainSoitec is not an optical module manufacturer. It operates at a deeper layer of the value chain, supplying Photonics-SOI substrates that underpin silicon photonics, pluggable transceivers, and future CPO deployments. As AI compute scales, the bottleneck is shifting toward data movement and bandwidth, accelerating the adoption of optical interconnects and placing Soitec in a structurally important upstream position.
The Core Thesis
The optical story is credible, but the key issue is the timing of re-rating. Photonics-SOI is already benefiting from AI data center demand, and the company has clear exposure to the optical upgrade cycle. At the same time, Soitec remains partly anchored to cyclical businesses such as RF-SOI and automotive, which creates a gap between a strong forward-looking narrative and a still mixed earnings profile.
The Risk
The risk is not that the optical thesis is wrong, but that it takes time to dominate the income statement. As long as legacy segments remain weak, the market is likely to continue pricing Soitec as a hybrid cyclical material company rather than a pure AI optical beneficiary. This can delay valuation expansion even if the long-term direction is intact.
The Re-rating Path
If Soitec is re-rated as an AI optical upstream beneficiary, the process is likely to unfold in two stages. The first stage is a valuation re-rating driven by narrative and positioning. The second stage depends on earnings, as photonics becomes a larger share of revenue and cyclical drag fades. The first can happen relatively quickly, but the second requires consistent execution and visible improvement in the revenue mix.
Technical analysis
Price action suggests an early-stage trend transition, with the stock breaking multiple downtrend structures and completing an initial retest after breaking the ascending wedge
would DCA with the trend and watch closely to Whether the proportion of Edge & Cloud AI continues to increase in their overall business.
 做多
做多
META – Under Pressure, But Structurally Mispriced?NASDAQ:META , together with other Mega-cap tech names, has faced sustained selling pressure as macro uncertainty, driven by rate expectations, geopolitical risks, and tightening liquidity conditions.
A growing narrative in the market suggests that Meta risks falling behind in the AI race. This concern, while not entirely unfounded, appears to overemphasize competitive positioning and underprice the strength of Meta’s existing business model.
Meta’s core advantage lies in its closed-loop ecosystem and advertising engine, which continues to generate substantial revenue and free cash flow. Its platforms (Facebook, Instagram, WhatsApp) provide unmatched user scale and data density, forming a strong foundation for monetization.
AI is not a disruptive force to Meta — it is an amplifier.
The company is already leveraging AI in Ad targeting and ranking systems, Content recommendation algorithms, Conversion optimization and ROI tracking
As AI models improve, these systems are likely to increase ad efficiency and pricing power, directly translating into higher revenue per user.
From a market structure perspective, price action suggests a phase of consolidation. A converging triangle or range-bound structure is forming, indicating indecision between macro-driven selling and fundamental support.
A temporary downside break remains possible, especially if macro conditions deteriorate. A downside break of support cannot be ruled out in the short term, but given its underlying fundamentals, the downside appears relatively limited.
 做多
做多
Short BTC
看图后,让我重新完整描述这个交易策略:
## Trading Strategy | 交易策略
**Market Context: | 市场背景:**
This is a swing trading strategy on BTC/USDT perpetual futures using a 4-hour timeframe, tracking price action from mid-November through late December 2025.
这是一个针对BTC/USDT永续合约的波段交易策略,使用4小时时间框架,追踪从2025年11月中旬到12月下旬的价格走势。
**Technical Setup: | 技术设置:**
The strategy utilizes multiple horizontal support and resistance zones combined with a trend-following approach visualized through blue curved lines that track swing highs and lows.
该策略使用多个水平支撑和阻力区域,结合趋势跟踪方法,通过蓝色曲线追踪波段高点和低点。
**Key Price Levels: | 关键价格水平:**
- **Resistance Zone 1 | 阻力区1:** $95,000 (upper boundary | 上边界)
- **Resistance Zone 0.79 | 阻力区0.79:** ~$92,000
- **Short Entry Zone 0.62 | 做空入场区0.62:** ~$90,600 (红色区域 | red zone)
- **Support Zone 0.5 | 支撑区0.5:** ~$90,000
- **Primary Support Zone 0 | 主要支撑区0:** ~$84,000-$85,000 (绿色目标区 | green target zone)
**Short Position Strategy: | 空头仓位策略:**
**Red Zone (Entry) | 红色区域(入场):** Around $91,038 at the 0.62 level. This represents the short entry area where sell positions are initiated when price reaches this resistance zone.
在0.62水平附近的$91,038。这代表做空入场区域,当价格达到这个阻力区时开启卖出仓位。
**Green Zone (Target) | 绿色区域(目标):** Around $84,000-$85,000 near the 0 level. This is the take-profit target zone for the short positions, representing the anticipated downside move.
在0水平附近的$84,000-$85,000。这是空头仓位的止盈目标区域,代表预期的下跌幅度。
**Trade Logic | 交易逻辑:**
The strategy involves shorting Bitcoin when it rallies into the red resistance zone around $91,000, with the expectation that price will reverse and decline toward the green support zone around $84,000-$85,000, representing approximately a 7-8% downside move.
该策略是在比特币反弹至$91,000附近的红色阻力区时做空,预期价格将反转并下跌至$84,000-$85,000附近的绿色支撑区,代表约7-8%的下跌幅度。
**Current Market Position: | 当前市场位置:**
Price is currently trading around $87,575, positioned between the short entry zone (red) and the target zone (green), suggesting the short position is in profit and moving toward the take-profit target.
价格目前在$87,575附近交易,位于做空入场区(红色)和目标区(绿色)之间,表明空头仓位处于盈利状态并正在向止盈目标移动。
**Risk Management: | 风险管理:**
Stop loss for the short position would likely be placed above the 0.62 resistance zone, possibly around $91,500-$92,000, to protect against a breakout above the entry level.
空头仓位的止损可能设置在0.62阻力区上方,大约在$91,500-$92,000,以防止价格突破入场水平。
做空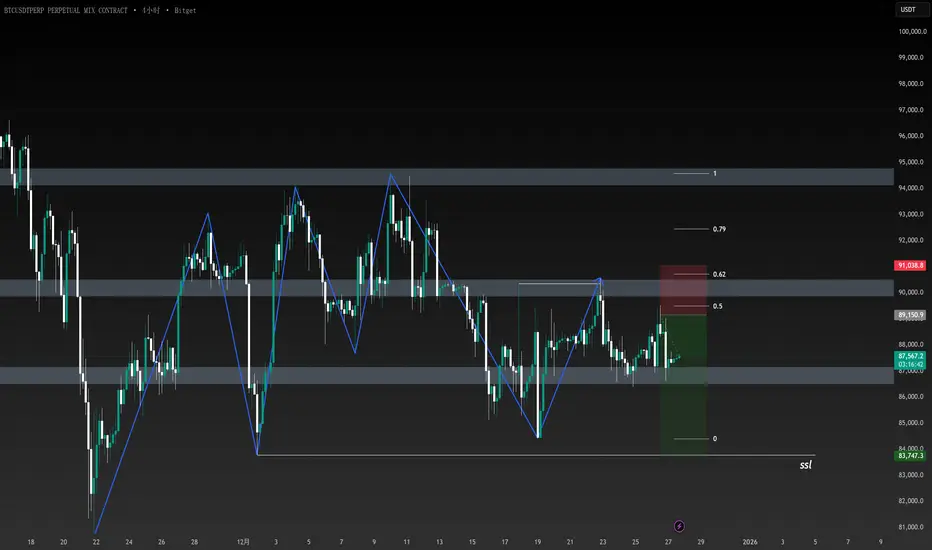
XAUUSD – Daily Trading Plan
Hello Traders,
Gold is holding its structure in the Asian session. The key level today is 3708:
If price stays above this resistance, upside targets are 3750 and possibly 3780.
If price fails to break 3708 and reacts lower, watch for buying zones near 3650 or even the 355x area.
Fundamental Note
Last week’s correction was triggered by comments from the Fed Chair. The Fed does not want multiple rate cuts, and this week’s PCE data will be important for direction.
Trading Setups
Buy Setup
Entry: 3650 – 3653
SL: 3645
TP: 3662 – 3675 – 3690 – 3706 – 3725
Sell Setup 1
Entry: 3700 – 3703
SL: 3708
TP: 3690 – 3675 – 3662 – 3650 – 3633
Sell Setup 2
Entry: 3738 – 3740
SL: 3746
TP: 3725 – 3710 – 3700 – 3675 – 3650
Summary
Today’s plan focuses on buying dips in line with the main uptrend, while also monitoring 3708 closely for rejection signals.
Follow me for the latest updates when price action changes.
做多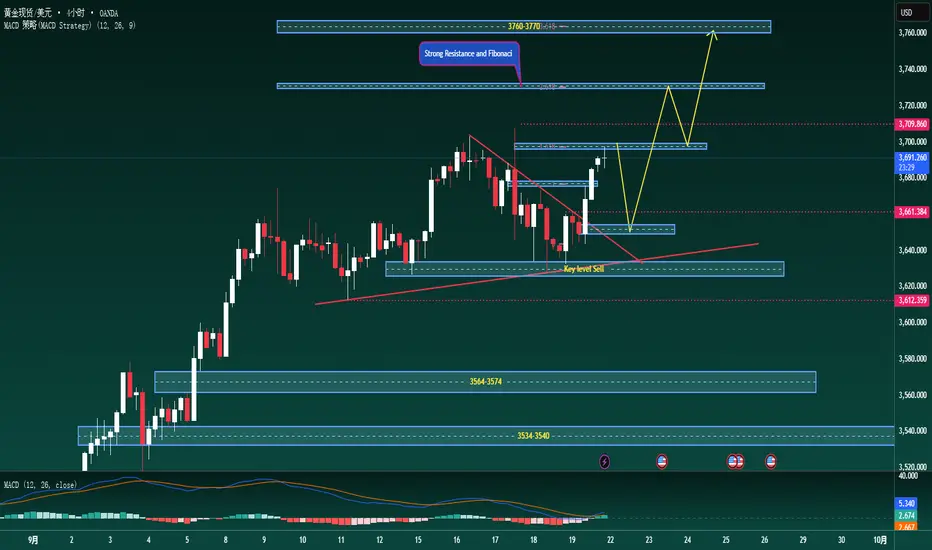
Bitcoin Bullish Breakout Potential Targeting $120,000Based on the analysis of recent Bitcoin (BTC) price charts and technical indicators, the following is a speculative outlook for BTC’s near-term price movement, intended for community discussion and brainstorming from a technical analysis perspective.
BTC is currently exhibiting a bullish structure, trading around $108,300 as of July 7, 2025, with strong support from the 50-day and 200-day moving averages, both sloping upward, indicating sustained positive momentum. The Relative Strength Index (RSI) is at 57.63, suggesting a neutral to slightly bullish sentiment, with no immediate overbought conditions. The price is approaching a key resistance zone around $110,000, which has historically capped upward moves. A breakout above this level could signal further upside.
**Price Prediction**: If BTC breaks and holds above $110,000 with high trading volume, it could target $120,000 in the short term, driven by bullish momentum and institutional buying interest. However, failure to break this resistance may lead to consolidation or a pullback to the $95,000–$100,000 support zone.
**Trading Strategy**:
- **Entry Position**: Consider entering a long position at $108,500–$109,000 if the price consolidates and shows a bullish reversal pattern (e.g., inverse head and shoulders or a higher low) near current levels. Alternatively, wait for a confirmed breakout above $110,000 with a retest of this level as support.
- **Take Profit**: Set a take-profit target at $118,000–$120,000, where resistance may emerge based on historical price action and Fibonacci extensions.
- **Stop Loss**: Place a stop-loss order at $104,000 to manage risk, as a drop below this level could signal a deeper correction toward $95,000.
做多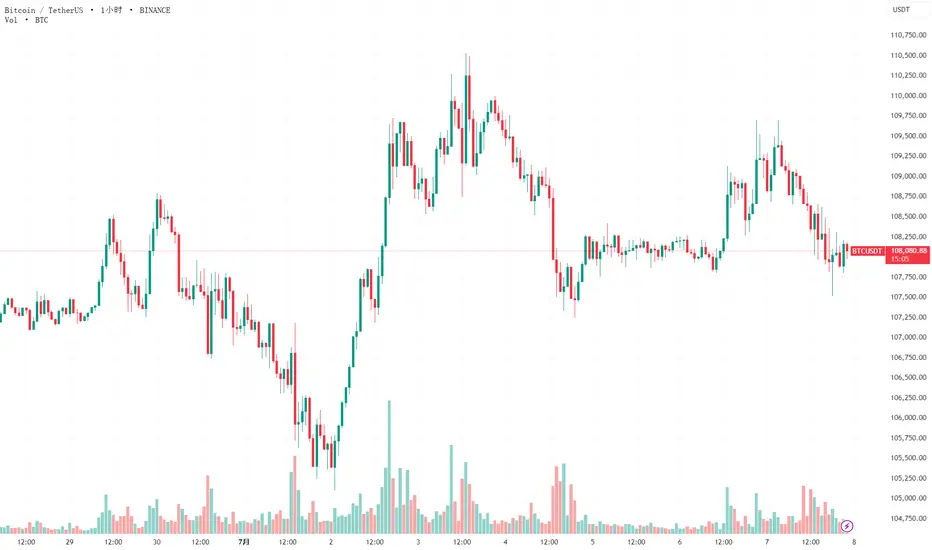
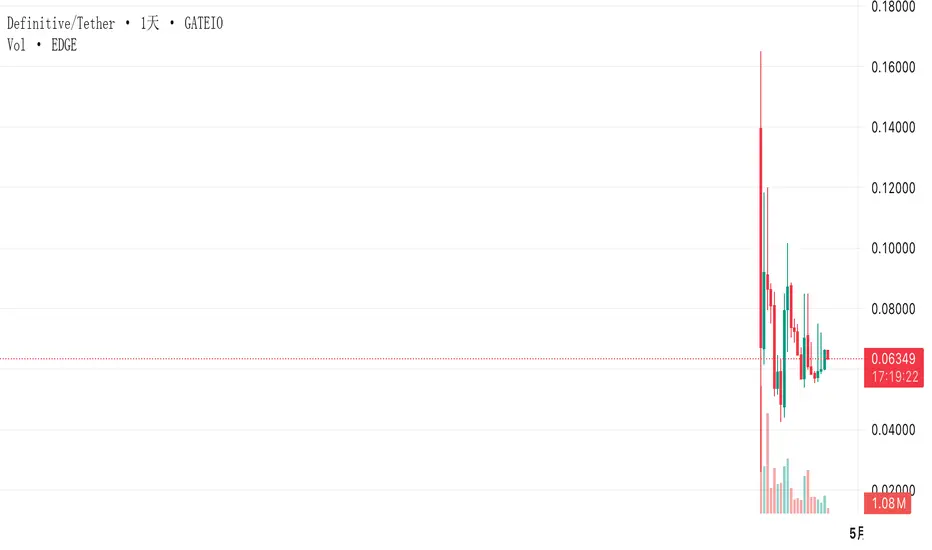
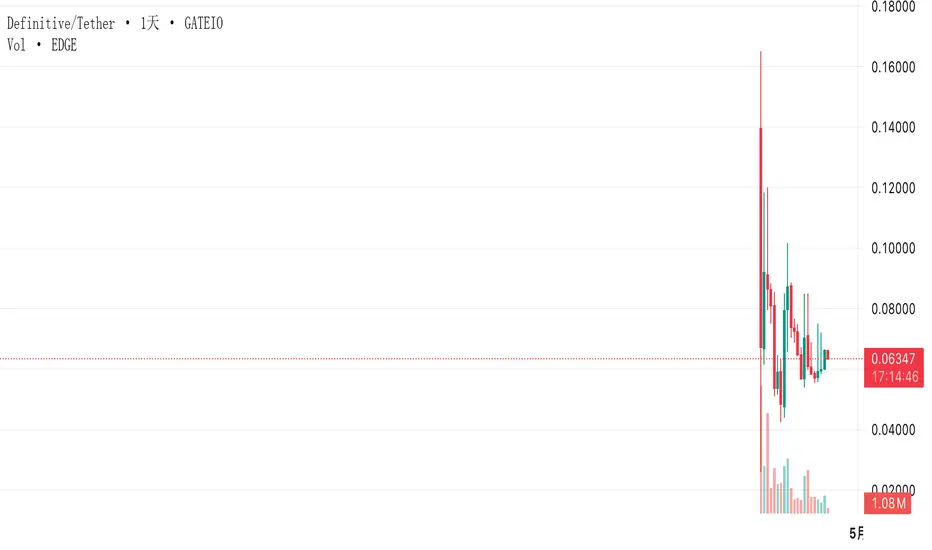
EDGE is currently trading in a range between $0.05 and $0.08As Definitive (EDGE) continues to gain traction on Gate.io, traders are closely monitoring its price movements to identify potential entry and exit points.
As of the latest trading session, EDGE is trading at $0.063, The token has shown significant volatility since its launch, with price swings driven by market sentiment and trading activity.
Identifying key support and resistance levels is crucial for any trader. For EDGE, the current key support level is around $0.05, These levels are determined based on recent price action and trading patterns.
深入了解关于TV的荣誉值。每个人每天能点赞别人的荣誉值是有限的。TRADINGVIEW社交平台:深入了解荣誉值
TRADINGVIEW社交系列
这篇文章是关于如何充分利用TradingView上的社交功能系列文章的一部分。确保你没有漏掉任何一篇!我们给出关于创建很棒的自定义聊天室的建议、解释如何获得点击率和增加荣誉值、强调一些普通用户称版主不能帮助的问题、警告您不能在TradingView上做的5件事、扩大战略偏差、解释我们的徽章还有给出我们对评论的看法。这篇是最新的话题!
荣誉值公式
我们经常被问到荣誉值是如何计算的。这个公式没有公开,只有创始人知道它的计算细节。它被称为“秘密酱汁”(secret sauce),以保护这个秘密不被抄袭或在系统中被利用。可以这样说,荣誉值是信誉的一个指标,由社区用户如何回应以及他们的帖子(比如想法和快照)所决定。评价标准是社交行为,例如:跟帖、点赞、评论、观点等。请注意,荣誉值不会受到自己没有任何荣誉值的用户的影响。得分高的作者赢得了社区的信任,但这并不意味着他们一定可以看到未来,所以要小心不要盲目抄袭他们的想法。如果您想提高自己的荣誉值,我们发布了10条关于如何做到这一点的建议。TradingView保留随时改进公式的权利,只要这能更客观、准确地反映每个用户的真实情况。上一次改进是在16个月前,下一次的改进计划在今年年底之前进行。因此,评级和排名可能会发生变化。增强功能的设计已经开始,我们将在适当的时候分享更多内容。
排行榜排名
我们有时会收到对每日排行榜持怀疑态度的会员的提问。他们看到某人在喜欢了他/她的某个想法后得分下降,他们认为这个方法要么是有缺陷的,要么是被操纵的。每日排行榜根据用户在24小时内获得的信誉点数对用户进行排名。这一个时间段的起点是每天向前推进的。因此,在24小时1分钟前获得的荣誉点数不再计入总点数,尽管是在一分钟前获得的。这就是为什么您可能赞了某人的想法,却发现数目有所下降。当会员在24小时前获得的积分(刚刚过期)高于通过赞某个想法而获得的积分时,就会发生这种情况。例如,如果刚刚才增加2分,而10分刚好过期,则累计为减少8分。这不是一个bug,也不是人为操纵。这就是这个方法的工作原理。每周和每月的排行榜计算原理是类似的。全部时间排行榜只显示累积的声誉,您也可以在用户的个人资料页面上找到。在任何一个排行榜上占据前6名的成员都可以得到一个Top徽章。
公平竞争的环境
我们今年一直在努力寻找和禁止重复账户。今年到目前为止,我们已经禁止了500多个重复账户。27个成员试图通过滥用它们来获得不正当的利益。他们通过跟帖、点赞和/或评论人为地夸大了自己主账户的荣誉值。他们都被禁一周,并对他们的荣誉值进行处罚。我们这样做是为了社区,因为荣誉值只有在诚实获得的情况下才有意义。请注意没有一个人例外,因为那样对别人不公平。这些措施适用于普通用户、顶级作者、升级计划持有人和知名分析师。在前面提到的27个成员中,有4个是历史前20名,其中1个是历史前10名。他们得到了与其他23名成员完全相同的待遇。我们为此受到了批评,因为有些粉丝无论如何都会为他们最喜欢的作者辩护,但在这种情况下,我们宁可承受压力。我们的核心价值观之一是不奖励不良行为,我们坚持这一点。我们仍然致力于寻找和禁止重复账户,并为每个人保持一个公平的竞争环境。我们的用户对我们的期望并不低。
我的荣誉值是怎么计算的
用户荣誉值计算是一个相当复杂的过程,取决于各种因素。 这个过程的核心是在我们的后端硬编码,并且是内部TradingView流程的一部分,因此我们无法透露公式。 以下因素可能会影响声誉:
喜欢的人数和喜欢你的想法的人的声誉;
评论;
粉丝数量。
请注意,这些因素很重要,但不是确定的。
谢谢您和我们在一起!
TradingView创始人和版主
TradingView Social: How to Gain Exposure and Build a Reputation on TradingView
Hopefully you didn’t miss the 10 golden tips on creating awesome and lasting custom chats post by one of our moderators, @JasperForex. Here is some new insight!
Contributors often ask what they can do to catch the communities’ attention so more people would view and like their publications. For new or little-known members who don’t yet have a record of achievement at TradingView, getting exposure can be a daunting task and occupying a spot on the coveted top authors leaderboard may seem like a mission impossible. With over a million ideas published and 750 new ones being published daily by traders from all over the world, how do you get people to notice yours?
You build a reputation by creating value for the community, so that should be your main focus. Sounds easy, right! No? Don’t worry, we know the first steps are often the hardest, so here are 10 tips to put you on the right track. If you are new to publishing, they will help you start off right and be on your way to gain the respect of others. If you already published ideas and would like to stand out more, they will help you discover where you can improve. Apply them, raise your game and get noticed! Your user profile has complete stats to keep track of how you are doing.
1、The power of why over what. TradingView is not a place for those seeking simple calls to buy or sell. Our community is driven by a scientific approach of peer review: to share, review, critique, learn from and build upon helpful, descriptive ideas to maximize profits. This is one of our core strengths. So don’t just say what the market will do, explain why by sharing how you got to your bias. Use the drawing tools to visualize your analysis and provide a meaningful description. Detailing targets and stops is a definite plus, because it helps others understand what you mean.
2、Mix it up! Don’t just publish trade ideas, throw some other posts in the mix that grab people’s attention! Education is one of our strongest assets and users love insightful educational posts. If done well, they can get hundreds of likes and thousands of views. There are many topics to choose from: share your view on trading psychology, give advice on money management, highlight what’s in your trading plan, explain how you set targets, detail configurations of price patterns, list 10 favorite tips, write a trading-related column or describe a personal experience. Be creative and captivate your audience!
3、Presentation is everything. A catchy title certainly helps, but what draws people’s attention first and foremost, is the chart. Avoid analysis paralysis and make it look professional, balanced and clean. By keeping it simple, others can grasp your market view intuitively. Well-presented ideas are included in the trending feed on our homepage, which heightens their exposure. They are sorted according to their popularity among the community and top trending charts can get thousands of views. A distinctive chart design can further help your publications to stand out.
4、Choose quality over quantity. Avoid playing a volume game: trying to build a reputation by publishing many hastily thrown together ideas, that each get a few likes. One well-thought-out idea generates more value, more engagement and more reputation points than several half-baked ones. Our community is known for intelligent and helpful ideas, so avoid publishing charts that don’t pass the grade. Quality content keeps its value over time. You can study it months later and still learn something, which organically leads to additional followers and likes. All analysis published on TradingView stays public permanently, neither users nor staff can delete an idea once it’s been published, so why not give it your best shot! Beware: contributors that publish more than 5 ideas daily rarely produce quality content.
5、Get found. The 5 most searched instruments are EURUSD, Gold, SPX500, Oil and GBPUSD. The most popular time frames range from the hourly to the daily. Taking these factors into account, increases the chance of your ideas being included in popular searches. For example: an analysis on the weekly for Abiomed Inc. stock will probably get noticed less than one on the hourly for Gold. Using smart tags further enables people to find your ideas while linking to similar ones helps those get discovered as well. Give yourself a leg up! Another great strategy could be publishing ideas for symbols that have few or no ideas at all. Be the first and get noticed!
6、Embrace feedback. By replying to comments in a timely, valuable and positive way, you naturally stimulate more comments. The public discussion of ideas is an important feature that brings a lot of value and it provides a nice way to interact with those who are interested in your views, to share your knowledge and to learn from others. Be respectful, even if someone argues an opposing view – a good debate with strong arguments can bring value to both sides. The TradingView community is active and engaged, posting over 600 comments daily and highly rated ideas can get hundreds of comments over time.
7、Update your ideas. Use the update status feature to provide quick updates on the management of published trades or to add important information to the original idea. Through a cool timeline under the chart you can show if the trade is active, how news affected it or if the target was hit. By using snapshots you could demonstrate how price action develops along the way. It makes your ideas more informative and dynamic, engages the readers and generates extra views and likes. Your followers will get instant notifications of any updates.
8、Everyone has something to share. Among our contributors are experienced traders with proven strategies who contribute awesome content. Some members say only they should publish ideas. We passionately disagree. We believe aspiring traders of all levels have something to share, be it a good trade opportunity, a valuable tip, or a profound insight. This works in 5 ways:
It helps others
-You learn by getting feedback
-You hold yourself accountable
-You see yourself improve
-You build a reputation in the online financial space
There is great value in sharing your journey to become a better version of yourself as a trader with a public trading journal to show for it.
9、Be truthful. Avoid publishing after-the-fact winners or ideas where price progressed significantly towards your target before you publish them. Don’t selectively update only winners, or claim profit on losers. The natural instinct may be to do this, but it’s not really fair, is it? And it won’t give you a real advantage because the trust you worked hard to gain is easily lost this way, which hurts your reputation. Our users have formed an advanced community that understands that -given the nature of the market- everyone will sometimes get something wrong. Getting better at anything requires you to be perfectly honest about successes and failures, with yourself first and foremost. So own up to losing trades and treat them as opportunities to improve, you will only get better from it. Think of it as a journal – when you publish some analysis, you can come back weeks, months or years later, and learn from it. Honesty is always the best policy!
10、Have patience. Don’t expect to get noticed and build a following right away. Remember: what comes fast, won’t last. Your first publications, even if they are good, may get just a few likes. Don’t get discouraged by that, keep sharing ideas and you will gradually earn respect from our community. If you offer good services, don’t rush to sell them from day 1. Increase your chances by earning recognition and trust first, through the contribution of quality content. It’s worth the effort since it’s human nature to prefer to buy from people we trust.
Using these tips will help you improve your reputation and make a name for yourself. Apply them, bring it to the next level and bring on the awesome ideas!
文章来自网络收集,具体英文部分,我也看不懂。……^_^

XAUUSD H1 SMC Analysis: FVG Rebalancing & Bullish Expansion PathXAUUSD H1 图表呈现出结构性的盘整形态,在维持高时间框架支撑的同时持续修复价格不平衡(Imbalance)。目前价格正为看涨爆发做准备,旨在补空上方的公平价值缺口(FVG)并扫荡剩余的流动性池。
1. Market Structure & Liquidity Dynamics
在经历强力的结构性上涨(BREAKOUT 蓝色方框)以及随后在 4,160.000 附近的假突破(FAKE BREAKOUT 黄色方框)后,价格大幅回调以清洗买方流动性。然而,由于价格持续受到上升三角形支撑线(Triangle Support Line)及主要需求区(4,000.000 – 4,020.000)的有效支撑,宏观看涨偏向依然完好无损。
2. Imbalance & Current Price Action
目前价格交投于 4,062.840 附近,在近期回调过程中形成了局部 FVG (Fair Value Gap) 区间:
Current Retest: 价格正对 4,040.000 – 4,050.000 附近的看涨 FVG 做出反应,将其作为吸收抛压的跳板。
Overhead Imbalances: 上方存在未被缓解的看跌 FVG(4,075.000 – 4,085.000),与下降橙色趋势线阻力(Trend Line)完美重合。
根据 SMC 预期路径(蓝色箭头):
价格预计将小幅下探以缓解局部 FVG 支撑区(约 4,040.000),随后发起强力看涨冲高,收复上方不平衡区并突破下降趋势线。
3. Strategic Upside Targets & Supply Pools
First Target: 收复上方 FVG 并测试主要阻力区 4,100.000 – 4,120.000。
Primary Objective: 扫荡前期高点上方的流动性池,探向 4,140.000+ 区域。
Trade Execution Blueprint
Bias: Bullish (Demand & FVG Rebalancing)
Point of Interest (POI): 4,040.000 – 4,050.000 (Local FVG / Demand Confluence)
Take Profit Targets: 4,100.000 (TP1) / 4,140.000 (TP2)
Stop Loss: 3,995.000 下方(跌破三角形支撑线则结构失效)
做多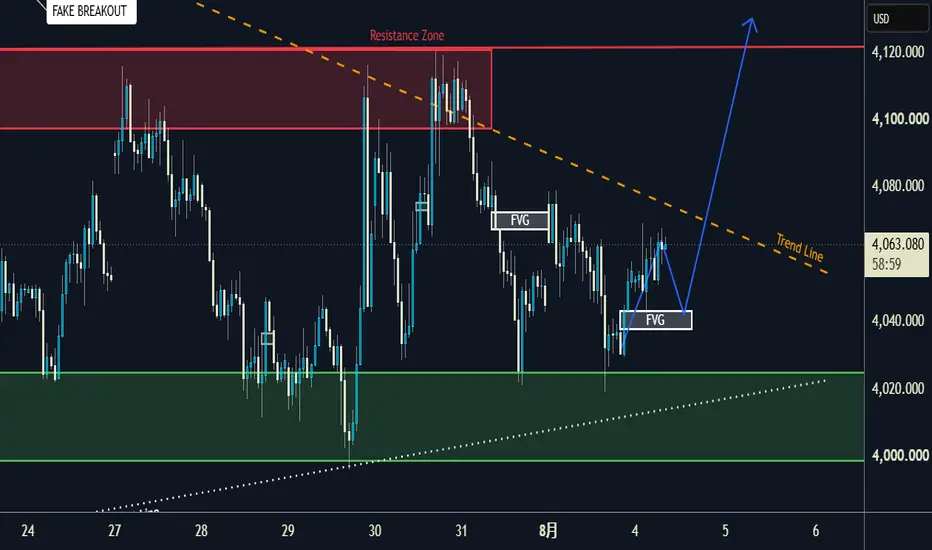
XAUUSD H1 SMC Analysis: Liquidity Sweep & Bullish Reversal PathXAUUSD H1 SMC Analysis: Liquidity Sweep & Bullish Reversal Path
XAUUSD H1 图表呈现出复杂的收敛形态,经历了流动性猎杀、结构转变以及假突破。目前价格在收敛结构内持续盘整,正为向上方主要供应池(Supply Pool)发起决定性的看涨突破做准备。
1. Market Structure & Liquidity Traps
在经历初始结构转变(CHoCH 绿色线)和有效突破(BREAKOUT 蓝色方框)后,价格冲破阻力区(4,100.000 – 4,120.000),并在 4,160.000 附近创下高点。然而,此举引发了假突破(FAKE BREAKOUT 黄色方框),在掠夺买方流动性后大幅回调重回震荡区间。尽管回调迅猛,但高时间框架结构依然受到上升三角形支撑线(Triangle Support Line)以及 4,000.000 – 4,020.000 需求区的强力支撑。
2. Current Price Action & Setup Projection
目前价格交投于 4,064.380 附近,受限于下降橙色趋势线阻力与下方的需求区/三角形支撑线之间。
根据 SMC 预期路径(蓝色箭头):
Support Defense: 价格多次成功测试下方需求区(4,000.000 – 4,020.000)且未突破结构失效位,确认了机构买单的存在。
Breakout Confirmation: 预计即将迎来的看涨爆发将突破下降橙色趋势线阻力(4,080.000),扫清空头诱捕的流动性。
3. Strategic Upside Targets & Resistance
First Target: 重新测试主要阻力区 4,100.000 – 4,120.000。
Primary Objective: 扫荡前期假突破高点上方的流动性池,探向 4,160.000+ 区域。
Trade Execution Blueprint
Bias: Bullish (Breakout / Demand Buyer)
Point of Interest (POI): 4,000.000 – 4,020.000 (Triangle Support / Demand Zone)
Take Profit Targets: 4,120.000 (TP1) / 4,160.000 (TP2)
Stop Loss: 3,980.000 下方(跌破三角形支撑线则结构失效)
做多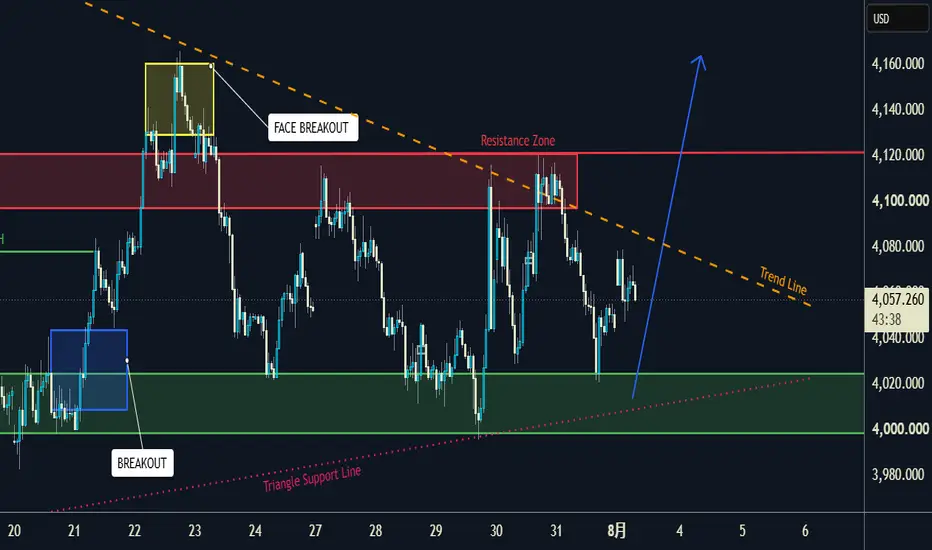
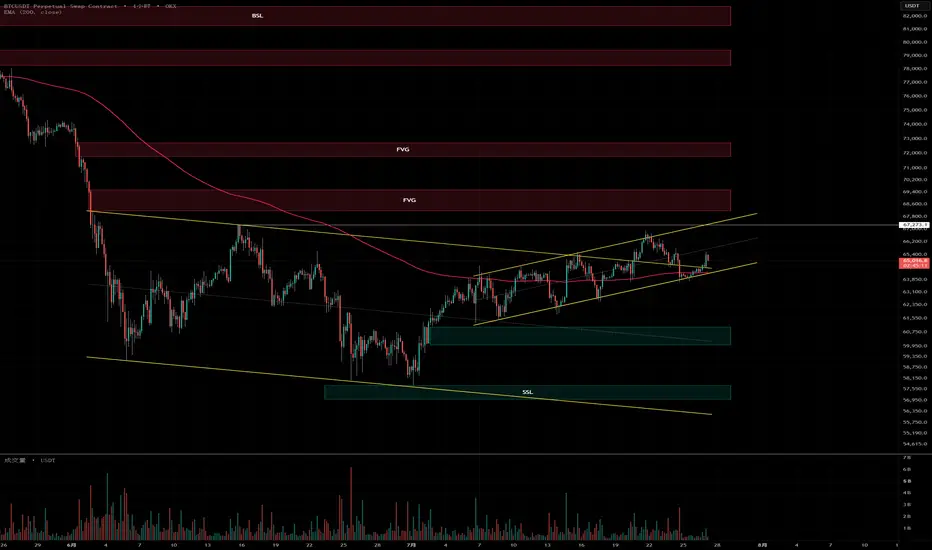
奇门遁甲 + SMC 分析系列 :BTC 7 月 27 日 到 8 月 2 日走势 - 震荡针对当前 BTC 位于 65000,以及从今天(7月27日)到 8 月 2 日这一周左右的短期走势,以下是基于奇门遁甲盘面的深度解析:
总体定调:星门俱伏,横盘震荡
整个盘面最显著的特征是伏吟局(天盘与地盘干支相同,八门、九星、八神全部都在本位,没有移动)。
在奇门预测金融和交易时,“伏吟”代表着停滞、不宜妄动、原地踏步。这意味着在 8 月 2 日之前,BTC 很难出现单边的大暴涨或大暴跌。市场情绪偏向观望,主力资金没有大动作,价格大概率会在当前 65000 上下进行一个窄幅的箱体震荡。
盘面核心解析
1. 资金面:主力资金沉寂,缺乏上攻动能
代表资金的“戊”落坎宫,且状态为“入墓”:戊(资本/钱财)在坎宫为水冷金寒,且处于“墓”地。这意味着当前市场流动性不足,大资金(机构或主力)处于锁仓或休息状态,没有新的增量资金大规模入场。
坎宫逢“休门”与“天蓬星”伏吟,休门代表休息、停滞。既然资金在“休息”且“入墓”,指望这一周内靠资金推动大阳线上涨是不现实的。
2. 当前价格支撑:护盘力量强,下跌空间受限
日干与时干同为“壬”,落乾宫,临“值符”:日干代表当前状态,时干代表短期走势。壬落乾宫为“临冠”,状态不弱。更重要的是,乾宫有“值符”(八神之首)坐镇。
值符代表着核心主力、大机构的护盘力量。这说明在 65000 这个位置附近,有着极强的支撑共识。即便盘面有向下插针的动作,也会被迅速拉回,不会发生崩盘式的大跌。
3. 盈利预期:利润逢空,谨防诱多
代表利润的“生门”落艮宫,逢时空“寅卯空亡”:生门在艮宫,本身遇到了“庚加庚”(太白同宫)的阻力格局,代表上方抛压重重。
同时,艮宫目前处于“空亡”状态。空亡意味着“看得见摸不着”。如果在这一周内看到价格短线拉升,千万不要盲目追高,因为这种拉升往往是虚假的(诱多),预期的利润很容易落空。
交易策略建议 (至 8 月 2 日)
基于“伏吟局”资金入墓且有值符护盘的特性,给出以下操作建议:
现货持有者:建议“趴着不动”(顺应伏吟局的能量)。既然上方有压力,下方有值符护盘,没有必要在震荡市中交出筹码或频繁换车。
合约交易者:本周极度不适合格局单(长线单)或高倍突破单。策略上应以“高空低多”的区间震荡思路为主,打到压力位就走,见好就收。
关键位置参考:下方强支撑在 63500 - 64000 一带(值符护盘区);上方强阻力在 66500 - 67500 一带(生门空亡且遇庚金阻力)。
总而言之,这一周是主力的“垃圾时间”,多看少动、保持耐心是本周最明智的策略。
第二部分 SMC 分析
1. 市场结构与流动性分布 (Market Structure & Liquidity)
底部流动性清算与反弹:自 7 月初向下深度清算底部的 Sell-Side Liquidity (SSL,约 57,500 绿色区域) 后,价格呈现出局部 Higher Highs (HH) 和 Higher Lows (HL) 的看涨结构,但整体运行在一个上升楔形/通道内。需要注意的是,这种通道在爬升过程中,会在下方沿线不断积累内部的趋势线流动性。
上方磁石 (BSL & FVG):价格在 67,273.1 留下了明显的近期高点,这里积聚了大量亟待猎取的 Buy-Side Liquidity (BSL)。在 BSL 之上,图表中清晰标记了两个未被测试的看跌 Fair Value Gaps (FVG:约 68,600-69,400 以及 71,500-72,500),这些不平衡区域是上方价格天然的磁石。
下方需求区 (Order Block):当前价格 (65,150) 正踩在 200 EMA(64,302 附近)以及上升通道的下沿。如果这里的支撑失效,下方的第一个强效 Demand Zone / 绿色 OB 区域落在 60,000-61,000 附近。
2. 当前价格行为 (Price Action)
目前 4H 级别正处于一个典型的“挤压/收敛”状态。上方有 67,273 的前高压制,下方有 200 EMA 和趋势线托底。在 SMC 框架下,聪明钱极少在这种拥挤的内部均衡区发力,而是倾向于等待边界流动性被清算(Sweep)之后再制造真正的波动。
3. 交易预案与执行路径 (Execution Plan)
针对当前的盘面结构,可以拆解为以下两条核心执行路径:
预案 A:向上清算与结构破坏 (高胜率手动做空预案)
如果价格出现向上突刺,扫掉 67,273.1 上方的 BSL,甚至刺入第一个看跌 FVG (68,600-69,400),但未能站稳,随后在小级别(如 15m 或 1H)出现了明显的市场结构转变(MSS / CHoCH)并伴随实体阴线下跌。这将是一个极为标准且高胜率的手动开空形态。这种“清算前高+假突破”的动作,也完美契合了奇门盘中提示的“谨防诱多”信号。
预案 B:动能突破与趋势延续 (趋势策略开多条件)
如果价格在 200 EMA 获得实质性买盘,带量强势突破 67,273 并站稳,开始向上填补 FVG,这意味着市场结构彻底转强。这种明确的右侧动能和趋势确立,自然会交由 Kirin 这一类底层逻辑为趋势追踪的策略去自动捕获开多信号,无需在此处进行主观的左侧摸底。