XAUUSD — Weekly Market Structure & Price ActionGold Spot / U.S. Dollar (1W)
The weekly chart shows a strong prior bullish structure followed by a corrective move beneath a descending trendline. Price has recently reacted from the marked support zone and is now approaching the 1W Fair Value Gap (FVG) area.
Key observations:
🔹 Weekly support: around 3,900–4,050
🔹 BSL / liquidity area: around 4,100
🔹 1W FVG: approximately 4,150–4,350
🔹 Current price is testing the upper portion of the marked FVG.
🔹 The descending trendline remains an important area of resistance.
🔹 A decisive weekly break above the trendline could provide stronger evidence of a potential structure shift.
🔹 If price rejects the FVG, the marked support zone becomes an important area to watch.
🧠 Possible Scenario
Bullish scenario:
If price holds the FVG and establishes acceptance above the descending trendline, the next major upside area visible on this chart is around 5,000–5,500.
Bearish scenario:
A clear rejection from the FVG followed by weakness below the nearby structure could bring attention back toward the 3,900–4,050 support zone.
⚠️ Educational analysis only — not financial advice or a trade recommendation. These are potential scenarios based solely on the chart structure; confirmation and risk management remain essential.
 Long
Long
The Ultimate Inflation Proxy: Why Sumitomo Metal Mining (5713.T)Hello Traders,
Are you feeling cautious about buying major tech names or the Nikkei at these elevated levels? Looking for a robust safe haven against sticky inflation?
If we peel back the layers of global cross-asset rotation, a massive subterranean shift is occurring. Today, I want to share a quantitative and macro perspective on why Sumitomo Metal Mining (TSE: 5713) is currently exhibiting a textbook setup for global value and macro investors.
1. The Macro Divergence: Why Base Metals?
When we analyze the market not just against the USD (DXY) but against the broader commodity index (DBC), a stark reality emerges. The "real return" of many US mega-caps and major indices is essentially being eaten alive by inflation, flatlining against DBC.
Where is the smart money hiding? Our cross-asset relative strength models indicate a massive, localized capital concentration into the Japanese "Non-Ferrous Metals" sector, heavily outperforming both global peers and the broader TOPIX. 5713 is the undisputed crown jewel of this inflow.
2. Don't Let the Price Tag Fool You: A Fundamental Beast
Trading around the 10,000 JPY psychological level, the stock might visually look "expensive" to retail traders. However, a peek under the hood reveals a valuation anomaly where earnings growth is drastically outpacing the stock price.
Margin Expansion: Over the TTM, Operating Margins have surged from 11.32% to 16.65%, and Net Margins from 10.12% to 16.28%.
Capital Efficiency: ROE has improved to a solid 12.08%, and ROIC to 10.30%, placing it well within the ranks of global quality compounders.
Cash Flow Explosion: Free Cash Flow (FCF) per share has skyrocketed over 4x (from 70.2 JPY to 301.4 JPY). It is literally a cash-generating machine in the current macro environment.
Fortress Balance Sheet & Dividends: With a Long-Term Debt/Equity ratio of just 0.15, debt risk is virtually non-existent. Dividends per share have more than doubled (104 JPY to 228 JPY) with a highly sustainable payout ratio of 35.1%.
Deep Value Multiples: Despite the absolute price, it trades at a mere 11.59x TTM P/E, 1.28x P/B, and an EV/EBITDA of 10.91. The fundamentals have completely detached from any notion of being "overbought."
3. Technical Setup: The Multi-Decade "Wave 3" Dream
Take a look at the attached ultra-long-term Monthly (1M) chart.
The Macro Channel: Mapping the cycle from the early 2000s using a Fibonacci channel reveals that after a massive, prolonged consolidation (a macro Wave 2), the asset is currently launching perfectly off the lower trajectory. This aligns flawlessly with the sticky consolidation seen in global commodity indices.
The "Dream" Target: If this truly is the genesis of a super-cycle Wave 3, the upside targets (e.g., the 1.618 extension around 25,000 JPY) seem almost absurd. Let's keep that strictly as a "dream scenario" for now.
Realistic Entry Strategy: Dreams aside, the massive monthly momentum is undeniably pointing north. After fighting through the 10,000 JPY psychological barrier and squeezing energy, we are looking for the initial breakout. The highest-probability setup here is to buy the dips on lower timeframes (e.g., 30m/1H), backed by the bulletproof fundamentals mentioned above. A realistic initial target is the upper channel boundary near 18,000 JPY.
We are witnessing a rare dual-tailwind: a Global Macro Capital Shift combined with an EPS & Cash Flow Explosion. Add this to your watchlist and track the relative strength!
Trade safe.
This publication is for educational and informational purposes only and does not constitute financial advice, investment recommendations, or an endorsement to buy or sell any security. All financial metrics and market analysis presented are based on publicly available data, and past performance or current financial health does not guarantee future market results. Trading and investing in equities and commodities involve substantial risk of loss. All investment decisions and trading executions must be made entirely at your own risk and discretion.
BTC/USD: Supply Zone Rejection Setup targeting Sell-Side ?Overview
Bitcoin ( BITSTAMP:BTCUSD ) on the 1-hour timeframe demonstrates a classic Smart Money Concepts (SMC) structure. After sweeping low-level liquidity near the $76,500 region, price underwent a strong Market Shift Structure (MSS) to tap liquidity above $82,300 (BSL). Following a sharp drop from the highs, price is consolidating beneath a key Supply Zone.
Key Technical Observations:
Buyside Liquidity (BSL): Established at $82,300, where the recent rally topped out.
Supply Zone: Defined between $80,500 – $81,500, acting as the primary point of interest (POI) for prospective sellers.
Sellside Liquidity (SSL): Key downside target sits at $78,600 (recent swing low).
Current Action: Price is hovering around $79,974, building energy for a potential push into the supply block before looking for continuation lower.
Trade Plan & Outlook:
Bearish Scenario (Primary): Look for a pullback into the $80,500 – $81,500 Supply Zone. Confirmation of rejection within this zone opens a short setup targeting $78,600 (SSL) as the primary take-profit target.
Alternative Scenario: A strong break and sustained hourly close above $81,500 invalidates the short bias and targets a test of the BSL high at $82,300+.  Short
Short
Silver | When the Patterns Whisper⏱️ Reading Time: ~3 minutes
Following our previous analyses, Silver is now at a point where the current structure needs to prove itself. Two primary cases remain on the table, and their details may change as the structure develops.
🟦 Scenario 1 | Bullish Case
In this view, the recent move could be part of a five-wave impulsive structure. If the current wave continues with impulsive character, we would expect the corrections between waves to develop according to their degree and structural position.
A strong break above the previous high would be significant, as it could increase the probability of further upside within the larger wave. In that case, the higher targets shown on the chart would become relevant.
For now, however, price growth alone is not enough; the structure must prove itself.
⬛ Scenario 2 | Bearish Case
In the conservative scenario, the recent decline may still be part of a larger corrective structure, while the current advance could simply be another corrective wave.
In this case, a zigzag or a more complex corrective structure may develop, followed by another decline to potentially complete Wave IV.
Therefore, the market's reaction at key levels and the character of the next move are more important for distinguishing these two structures than short-term direction alone.
We do not predict structures; we identify them through price behavior.
And as always:
The patterns whisper. We listen.
Mr. Nobody
Silver / U.S. Dollar
2 days ago
Silver | Has Wave IV Ended, or Is One More Decline Still Ahead?
3 days ago
Silver | Let the Waves Speak
 Long
Long
Long 
XAUUSD — Gold at a Decision Point: Breakout or Breakdown?Gold is approaching a key decision point on the 1H chart. Price is compressing between descending resistance and rising support, while the Volume Profile and marked order blocks provide additional areas to monitor.
🟢 Bullish scenario
A 1H close above the descending trendline would confirm a bullish breakout.
The key condition is not simply a wick through resistance — I want to see the breakout hold on a retest.
Bullish confirmation: 1H close above descending resistance + successful retest
Potential targets: 30-Min OB around 4,560–4,570 , followed by the upper resistance area.
🔴 Bearish scenario
A 1H close below the rising support would weaken the current structure and shift attention toward the lower part of the range.
Bearish confirmation: 1H close below rising support + failed retest
Potential path: lower channel → 1H OB around 4,285–4,300
⚪ If neither side breaks
If price continues to hold inside the structure, there is no need to force a trade. The range remains valid until one side confirms.
Key takeaway
The level that breaks first matters more than predicting the direction in advance.
We are watching the reaction at the trendlines, the retest after confirmation, and the marked order blocks before considering the next directional move.
This is technical market analysis, not financial advice. Manage risk according to your own trading plan.  Long
Long
How to Use the STP Top 10 Trade Opportunity Scanner / ScreenerIn this training video, I walk through how to use the **STP Top 10 Large Move Radar** to quickly identify and rank stocks showing the strongest potential for a significant price move.
The Radar is designed to reduce the time spent reviewing charts by evaluating multiple technical conditions and ranking the strongest opportunities in a single, easy-to-read table.
In this video, I cover:
• How to add and configure the STP Top 10 Large Move Radar
• How the Radar evaluates stocks
• How to read the Opportunity Score
• What the Trend, Speed, Squeeze, Breakout, Structure, Volatility, and Volume information means
• How to interpret the ranked results
• How to adjust the number of opportunities displayed
• How I use the Radar to identify stocks for further chart analysis
• How to move from a Radar candidate to a potential trade setup
The Radar is intended to be an **opportunity-discovery tool rather than an automatic buy-or-sell signal**. A stock appearing near the top of the list suggests multiple conditions are aligning, and the stock may warrant additional analysis.
My workflow is:
**Find the Opportunity → Review the Radar → Analyze the Chart → Confirm the Setup → Make the Trade Decision**
The **STP Top 10 Large Move Radar is available for free on TradingView** and can be used by stock and options traders looking for a faster way to identify potential intraday, momentum, breakout, and swing trading opportunities.
This video is for educational and informational purposes only and should not be considered financial advice. Always perform your own analysis and manage risk based on your individual trading plan.
 Education

XAUUSD: Bearish Matryoshka Sequence & BC ShortGold initiated a macro bearish sequence from the cycle peak down into Red (A), retracing to establish Red (B) before resuming downward order flow. Within the subsequent impulse, price formed an internal sub-cycle (Pink sequence) that cleanly fulfilled its micro ABC target around 4,400–4,600. The completion of this sub-sequence unlocked its Whole Correction Level (WCL), which converged directly with the macro Red BC correction zone to print a major confluence rejection at Black Point (B).
Following the defense of the WCL/BC cluster at 4,983.597, aggressive distribution pushed price below the Black (A) pivot, officially activating the Black Matryoshka sequence. Instead of chasing the breakdown, patience allowed the impulse to bottom out and retrace into the newly projected Black BC zone (4,412–4,650). Price has cleanly mitigated this correction pocket, offering an asymmetric limit entry aligned with higher-timeframe bearish continuation.
Structural invalidation is placed strictly above Black (B) at 4,983.597, where any breach immediately kills sequence context. Take Profit 1 targets the macro Red (C) zone at 3,000–3,450 to bank 75% of the position and move the stop loss to breakeven. The remaining 25% runner will ride through any intermediate retracements toward the extended Matryoshka Target (TP2) at 2,250–2,650. Short 
Amazon Holds Above Support — Can Buyers Rebuild Momentum?Market Structure
Amazon remains in a short-term recovery after finding support following the sharp decline from its early-August high. While the broader structure is still correcting from the previous rally, recent price action suggests sellers are losing momentum as price begins to stabilize above an important demand zone. A series of higher lows would be needed to confirm that buyers are gradually regaining control.
Market Sentiment - Neutral to Moderately Bullish
Market sentiment has improved from recent lows but remains balanced. Buyers are attempting to establish a base, while sellers continue defending nearby resistance. The next directional move will likely depend on whether price can break above the recent consolidation range.
Bullish Scenario
If buyers continue defending the current support area and reclaim 262.00, bullish momentum could strengthen. A sustained move above 266.00 would confirm renewed buying pressure and open the door for a recovery toward 272.00.
Bearish Scenario
If sellers push price below 256.00, the recent recovery attempt could fail and expose the next support around 252.00. A decisive break beneath that level would increase the probability of a broader corrective decline.
────────────────────
Market Outlook
The recent consolidation suggests Amazon is attempting to build a base after a prolonged pullback. Momentum has become more balanced, with neither buyers nor sellers holding a clear advantage. The next breakout from the current range will likely determine the short-term direction.
────────────────────
Key Levels
First Resistance 262.00
Second Resistance 266.00
First Support 256.00
Second Support 252.00
────────────────────
Future Scenarios
A sustained move above 262.00 would indicate buyers are regaining confidence and could drive price toward 266.00, with 272.00 becoming the next upside objective.
However, if price fails to hold above 256.00, selling pressure could increase toward 252.00. Losing that support would likely extend the corrective phase before another recovery attempt develops.
────────────────────
Event Risk
Amazon continues to react to both company-specific developments and broader macroeconomic conditions.
Traders remain focused on AWS growth, e-commerce demand, AI investment, cloud competition, consumer spending trends, U.S. Treasury yields, and Federal Reserve policy. Broader sentiment across the Nasdaq and large-cap technology stocks will also remain an important driver of Amazon's short-term price action.
The next confirmed major macro event is the Federal Reserve meeting on September 15–16, 2026. Any shift in interest-rate expectations could significantly affect technology stocks through changes in valuation expectations and overall market sentiment.
Ultimately, price reaction matters more than the headlines. If positive news cannot push Amazon above 262.00–266.00, consolidation may continue. Conversely, if negative news fails to break 256.00–252.00, buyers may be preparing for another recovery.
────────────────────
Please share your view below:
Do you expect Amazon to break above the current consolidation range, or will sellers keep the market under pressure for longer?
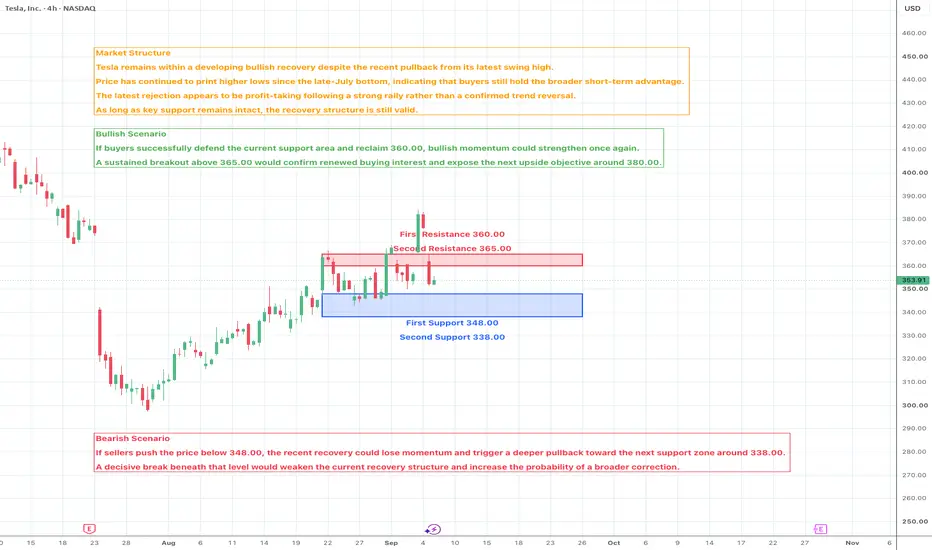
More market structure and key level updates will be shared regularly. Tesla Pulls Back After Rally Tesla Pulls Back After Rally — Is This a Healthy Reset or the Start of a Deeper Correction?
Market Structure
Tesla remains within a developing bullish recovery despite the recent pullback from its latest swing high. Price has continued to print higher lows since the late-July bottom, indicating that buyers still hold the broader short-term advantage. The latest rejection appears to be profit-taking following a strong rally rather than a confirmed trend reversal. As long as key support remains intact, the recovery structure is still valid.
Market Sentiment - Moderately Bullish
Market sentiment remains moderately bullish. Although short-term momentum has slowed after the recent rejection, buyers continue to defend higher support levels. The market is currently waiting for fresh momentum before deciding whether the recovery can extend toward the next resistance area.
Bullish Scenario
If buyers successfully defend the current support area and reclaim 360.00, bullish momentum could strengthen once again. A sustained breakout above 365.00 would confirm renewed buying interest and expose the next upside objective around 380.00.
Bearish Scenario
If sellers push price below 348.00, the recent recovery could lose momentum and trigger a deeper pullback toward the next support zone around 338.00. A decisive break beneath that level would weaken the current recovery structure and increase the probability of a broader correction.
────────────────────
Market Outlook
The recent decline looks more like a healthy pullback following a strong advance than the beginning of a bearish reversal. Buyers are now attempting to establish another higher low, while sellers continue defending the recent highs. The next directional move will likely depend on which side breaks first.
────────────────────
Key Levels
First Resistance 360.00
Second Resistance 365.00
First Support 348.00
Second Support 338.00
────────────────────
Future Scenarios
A sustained move above 360.00 would indicate buyers are regaining momentum and could drive price toward 365.00 and eventually 380.00.
However, if price fails to hold above 348.00, selling pressure could increase toward 338.00. Losing that support would likely trigger a broader corrective phase before buyers attempt another recovery.
────────────────────
Event Risk
Tesla remains highly sensitive to both company-specific developments and broader macroeconomic conditions.
Traders continue to monitor EV demand, vehicle delivery expectations, autonomous driving developments, energy business updates, battery technology, CEO-related headlines, U.S. Treasury yields, and Federal Reserve policy. Broader sentiment across the Nasdaq and growth stocks will also remain an important driver of Tesla's short-term price action.
The next confirmed major macro event is the Federal Reserve meeting on September 15–16, 2026. Any shift in interest-rate expectations could significantly affect growth stocks and overall market sentiment.
Ultimately, price reaction matters more than the headlines. If positive news cannot lift Tesla above 360.00–365.00, the current consolidation may continue. Conversely, if negative news fails to break 348.00–338.00, buyers may be preparing for another leg higher.
────────────────────
Please share your view below:
Do you expect Tesla to resume its recovery and challenge the recent highs, or will the current pullback develop into a larger correction?
More market structure and key level updates will be shared regularly. NVIDIA Retests Highs — Can Bulls Sustain the AI-Driven Rally?Market Structure
NVIDIA remains within a strong bullish structure after recovering sharply from the late-August pullback. The recent advance has produced another higher high, confirming that buyers continue to dominate the broader trend. Although price has begun to consolidate following the latest breakout, the overall structure remains constructive as long as key support levels hold.
Market Sentiment - Bullish
Market sentiment remains bullish. Strong buying interest continues to support NVIDIA, driven by persistent optimism surrounding AI-related demand and semiconductor leadership. While short-term profit-taking may create temporary volatility, buyers continue to maintain the structural advantage.
Bullish Scenario
If buyers successfully defend the current support area and reclaim 232.00, bullish momentum could strengthen once again. A sustained breakout above 235.00 would confirm renewed buying interest and expose the next upside objective around 240.00.
Bearish Scenario
If sellers push price below 226.00, the recent breakout may lose momentum and trigger a deeper pullback toward the next support zone around 220.00. A decisive break beneath that level would weaken the current bullish structure and increase the probability of a broader correction.
────────────────────
Market Outlook
The recent pullback appears to be a normal consolidation following another breakout rather than the beginning of a trend reversal. Buyers continue to defend higher support levels, and the next directional move will likely depend on whether price can establish another higher low before attempting a fresh breakout.
────────────────────
Key Levels
First Resistance 232.00
Second Resistance 235.00
First Support 226.00
Second Support 220.00
────────────────────
Future Scenarios
A sustained move above 232.00 would suggest buyers remain firmly in control, potentially driving price toward 235.00 and eventually 240.00.
However, if price fails to hold above 226.00, selling pressure could increase toward 220.00. Losing that support would likely trigger a broader corrective phase before the longer-term uptrend resumes.
────────────────────
Event Risk
NVIDIA remains highly sensitive to both company-specific developments and broader macroeconomic conditions.
Traders continue to monitor AI infrastructure spending, data center demand, semiconductor industry developments, enterprise investment, upcoming earnings expectations, U.S. Treasury yields, and Federal Reserve policy. Performance across the Nasdaq and broader technology sector will also remain a key driver of NVIDIA's short-term direction.
The next confirmed major macro event is the Federal Reserve meeting on September 15–16, 2026. Any shift in interest-rate expectations could significantly affect technology valuations and overall market sentiment.
Ultimately, price reaction matters more than the headlines. If positive news cannot push NVIDIA above 232.00–235.00, short-term profit-taking may continue. Conversely, if negative news fails to break 226.00–220.00, buyers may be preparing for another leg higher.
────────────────────
Please share your view below:
Do you expect NVIDIA to extend its breakout and reach new highs, or is a larger pullback becoming more likely?
More market structure and key level updates will be shared regularly. Google — Is the Next Breakout Approaching?Market Structure
Google remains in a broader recovery structure despite the recent sideways consolidation. Following the sharp rally from late July, price has transitioned into a range-bound phase rather than giving back its gains, suggesting that buyers are absorbing selling pressure. While short-term momentum has slowed, the broader structure still favors the upside as long as key support holds.
Market Sentiment - Moderately Bullish
Market sentiment remains cautiously bullish. Buyers have maintained control by preventing a deeper correction, but fresh momentum will likely require a decisive breakout above nearby resistance. Until then, consolidation remains the dominant short-term theme.
Bullish Scenario
If buyers successfully reclaim 348.00, bullish momentum could gradually strengthen. A sustained breakout above 355.00 would confirm renewed buying interest and expose the next resistance area around 365.00.
Bearish Scenario
If sellers push price below 336.00, the consolidation could develop into a deeper correction toward the next support zone near 330.00. A decisive break beneath that level would weaken the current recovery structure and increase the probability of a broader pullback.
────────────────────
Market Outlook
The recent price action looks more like consolidation after a strong recovery than the beginning of a bearish reversal. Buyers continue defending an important support area, and the next directional move will likely depend on whether price can break above the current trading range. A successful breakout would reinforce the broader bullish structure.
────────────────────
Key Levels
First Resistance 348.00
Second Resistance 355.00
First Support 336.00
Second Support 330.00
────────────────────
Future Scenarios
A sustained move above 348.00 would suggest buyers are regaining momentum, potentially driving price toward 355.00 and eventually 365.00.
However, if price fails to hold above 336.00, selling pressure could increase toward 330.00. Losing that support would likely trigger a deeper corrective phase before the broader recovery resumes.
────────────────────
Event Risk
Google continues to react to both company-specific developments and broader macroeconomic conditions.
Traders remain focused on AI monetization, cloud computing growth, digital advertising demand, regulatory developments, upcoming earnings expectations, U.S. Treasury yields, and Federal Reserve policy. Performance across the Nasdaq and the broader technology sector will also remain an important driver of Google's short-term direction.
The next confirmed major macro event is the Federal Reserve meeting on September 15–16, 2026. Any shift in interest-rate expectations could influence technology valuations and overall market sentiment.
Ultimately, price reaction matters more than the headlines. If positive news cannot lift Google above 348.00–355.00, sellers may continue to keep price within the current range. Conversely, if negative news fails to break 336.00–330.00, buyers may be preparing for another leg higher.
────────────────────
Please share your view below:
Do you expect Google to break out of its current consolidation and continue higher, or will the range remain intact?
More market structure and key level updates will be shared regularly. Meta Rebounds Into Resistance — Can Bulls Extend the Recovery?Market Structure
Meta is attempting to recover after forming a meaningful swing low in late August. The recent rally has established a sequence of higher highs and higher lows on the lower timeframe, suggesting that buyers are gradually regaining control. However, price is now approaching an important resistance area where previous selling pressure emerged. A successful breakout would strengthen the recovery, while rejection could lead to another period of consolidation.
Market Sentiment - Moderately Bullish
Market sentiment has improved following the recent rebound. Buyers have regained short-term momentum, but confidence remains measured as price tests a key resistance zone. A confirmed breakout is still needed to reinforce the broader bullish outlook.
Bullish Scenario
If buyers successfully push above 620.00, bullish momentum could accelerate. A sustained breakout above 630.00 would confirm renewed buying interest and expose the next upside objective around 650.00.
Bearish Scenario
If sellers defend the current resistance and price falls below 600.00, the recovery may lose momentum. A decisive break beneath 585.00 would increase the probability of a deeper pullback toward the recent swing low.
────────────────────
Market Outlook
The recent advance suggests buyers are rebuilding momentum after the previous correction. Price is now testing an important resistance area that will likely determine the next directional move. Holding above nearby support while breaking higher would reinforce the recovery trend, whereas another rejection may keep Meta trading within a broader consolidation range.
────────────────────
Key Levels
First Resistance 620.00
Second Resistance 630.00
First Support 600.00
Second Support 585.00
────────────────────
Future Scenarios
A sustained move above 620.00 would indicate buyers are taking back control, opening the way toward 630.00 and potentially 650.00.
However, if price fails to break resistance and falls below 600.00, selling pressure could return toward 585.00. Losing that support would weaken the current recovery and increase the likelihood of a broader corrective move.
────────────────────
Event Risk
Meta remains sensitive to both company-specific developments and broader macroeconomic conditions.
Traders continue to monitor AI investment trends, digital advertising demand, user engagement metrics, regulatory developments, U.S. Treasury yields, and Federal Reserve policy expectations. Performance across the Nasdaq and the broader technology sector will also remain a major driver of Meta's short-term direction.
The next confirmed major macro event is the Federal Reserve meeting on September 15–16, 2026. Any shift in interest-rate expectations could influence technology valuations and overall market sentiment.
Ultimately, price reaction matters more than the headlines. If positive news cannot lift Meta above 620.00–630.00, sellers may continue to cap the recovery. Conversely, if negative news fails to break 600.00–585.00, buyers may be preparing for another leg higher.
────────────────────
Please share your view below:
Do you expect Meta to break above the current resistance and continue its recovery, or will sellers regain control?
More market structure and key level updates will be shared regularly. Microsoft — Can Buyers Regain Momentum?Market Structure
Microsoft remains within a broader bullish structure despite the latest pullback from recent highs. The strong impulsive rally from late July established a series of higher highs and higher lows, confirming that buyers continue to dominate the larger trend. However, the recent rejection near the 510 area has triggered a short-term correction, bringing price back toward an important support region. As long as higher lows continue to hold, the broader bullish trend remains intact.
Market Sentiment - Moderately Bullish
Market sentiment remains cautiously bullish. Although recent profit-taking has weakened short-term momentum, buyers still maintain the structural advantage while price trades above key support. The current pullback appears to be a pause within the prevailing uptrend rather than a confirmed trend reversal.
Bullish Scenario
If buyers successfully defend the current support area and reclaim 505.00, bullish momentum could gradually strengthen again. A breakout above 512.00 would confirm renewed buying interest and expose the recent swing high, potentially opening the door for further upside.
Bearish Scenario
If sellers push price below 495.00, the correction could extend toward the next support zone around 485.00. A decisive break beneath that level would weaken the current bullish structure and increase the probability of a deeper retracement toward the August breakout area.
────────────────────
Market Outlook
The recent decline looks more like a healthy pullback following a strong rally than the beginning of a major trend reversal. Buyers are now testing an important support region, and the next directional move will largely depend on whether this area produces another higher low. A recovery above nearby resistance would reinforce Microsoft's broader bullish trend.
────────────────────
Key Levels
First Resistance 505.00
Second Resistance 512.00
First Support 495.00
Second Support 485.00
────────────────────
Future Scenarios
A sustained move above 505.00 would suggest buyers are regaining control, potentially driving price toward 512.00 and eventually retesting the recent highs.
However, if price fails to hold above 495.00, selling pressure could increase toward 485.00. Losing that support would likely trigger a deeper corrective phase before the longer-term uptrend resumes.
────────────────────
Event Risk
Microsoft remains sensitive to both company-specific catalysts and broader macroeconomic developments.
Traders continue to monitor AI-related investment trends, Azure cloud growth, enterprise software demand, upcoming earnings expectations, U.S. Treasury yields, and Federal Reserve policy. Performance across the broader Nasdaq and technology sector will also remain an important driver of Microsoft's short-term direction.
The next confirmed major macro event is the Federal Reserve meeting on September 15–16, 2026. Any shift in interest-rate expectations could significantly impact technology valuations and overall market sentiment.
Ultimately, price reaction matters more than the headlines. If positive news cannot lift Microsoft back above 505.00–512.00, sellers may continue to control short-term momentum. Conversely, if negative news fails to break 495.00–485.00, buyers may be preparing for another leg higher.
────────────────────
Please share your view below:
Do you expect Microsoft to resume its broader uptrend from the current support area, or is a deeper correction still ahead?
More market structure and key level updates will be shared regularly. Apple Pulls Back From Resistance — Can Bulls Defend the Uptrend?Market Structure
Apple remains within a broader bullish trend despite the recent pullback from its latest swing high. The series of higher highs and higher lows is still intact, but short-term momentum has weakened after failing to sustain prices above the recent peak. Price is now retracing toward a key support area where buyers will need to step in to preserve the broader uptrend.
Market Sentiment - Moderately Bullish
Overall sentiment remains cautiously bullish. Although recent profit-taking has slowed upside momentum, the broader market structure continues to favor buyers as long as price holds above key support levels.
Bullish Scenario
If buyers successfully defend the current support area and reclaim 324.00, bullish momentum could gradually return. A breakout above 329.00 would confirm renewed buying interest and expose the recent swing high around 342.00.
Bearish Scenario
If sellers push price below 316.00, the correction could extend toward the next support zone around 310.00. A decisive break beneath that level would weaken the current bullish structure and increase the probability of a deeper retracement toward the previous consolidation area.
────────────────────
Market Outlook
The recent decline appears to be a healthy correction rather than a confirmed trend reversal. Buyers are testing an important support region, and the next directional move will largely depend on whether this area produces another higher low. A recovery above nearby resistance would reinforce the longer-term bullish trend.
────────────────────
Key Levels
First Resistance 324.00
Second Resistance 329.00
First Support 316.00
Second Support 310.00
────────────────────
Future Scenarios
A sustained move above 324.00 would suggest buyers are regaining control, opening the door for another advance toward 329.00 and potentially a retest of the recent high near 342.00.
However, if price fails to hold above 316.00, selling pressure may increase toward 310.00. Losing that support could trigger a broader corrective phase before the longer-term uptrend resumes.
────────────────────
Event Risk
Apple continues to be influenced by both company-specific developments and broader macroeconomic conditions.
Traders remain focused on upcoming product-related news, corporate earnings expectations, AI investment trends, U.S. consumer demand, Treasury yields, and Federal Reserve policy expectations. Broader movements in the Nasdaq and overall technology sector sentiment are also likely to influence Apple's short-term price action.
The next confirmed major macro event is the Federal Reserve meeting on September 15–16, 2026. Any shift in interest-rate expectations could significantly impact technology stocks through changes in valuation and overall market risk appetite.
Ultimately, price reaction matters more than the headlines. If positive news cannot push Apple back above 324.00–329.00, sellers may continue to dominate in the short term. Conversely, if negative news fails to break 316.00–310.00, buyers may be preparing for another leg higher.
────────────────────
Please share your view below:
Do you expect Apple to resume its uptrend from the current support area, or is a deeper pullback still ahead?
More market structure and key level updates will be shared regularly.  Short
Short
 Short
Short
 Long
Long
BTC/USDC 2H: Liquidity Sweep & Potential Retracement Into DemandMarket structure: BTC is currently trading around 79,643 after a strong impulsive move into the 81,000–82,000 area. The chart shows multiple liquidity sweeps (LQ sweeps) followed by rejection, suggesting that price may seek lower liquidity before another directional move.
🔎 Key Levels
Resistance / Supply: 81,000 – 82,000
Current price: ~79,643
Near-term demand: 77,300 – 78,000
1H Order Block: around 76,000 – 76,400
Major demand: 74,500 – 75,500
BSL: Above the recent highs / liquidity pools
📉 Potential Scenario
Price appears to be consolidating below the recent high. A possible bearish retracement could develop toward the 77,300–78,000 demand zone. If price reaches this area and shows a bullish reaction, it could become an area of interest for a potential continuation higher.
A 2H close below the demand zone would weaken this setup and could expose the lower 1H OB / 76K area.
🧠 Market Logic
Liquidity → displacement → retracement → reaction
The important confirmation is price reaction at the marked demand zone, rather than assuming the zone will automatically hold.
⚠️ Educational market analysis only — not financial advice. Always manage risk and do your own research. Long 
BTCUSD — Rising Trendline Breakdown | Bearish Structure🔹 BTCUSD is showing a clear shift in short-term market structure after price broke below the rising trendline that had supported the previous advance. The rejection near the 80,000–81,000 resistance zone was followed by a sharp move lower, and price is now consolidating around the 77,500–78,200 area. This suggests that sellers have gained some short-term control, while the former trendline could now act as overhead resistance if price attempts a recovery.
🔸 From a price action perspective, continued weakness below the broken structure may open a path toward the 74,000 area, where previous price action could attract liquidity and demand. However, a reclaim of the broken trendline and stronger acceptance above nearby resistance could weaken the bearish structure and support a recovery toward the upper range. Traders may wait for clear price confirmation before considering any trade, particularly around the key support and resistance zones.
This analysis is for educational purposes only and does not constitute financial or investment advice. Always conduct your own research before making trading decisions. Short