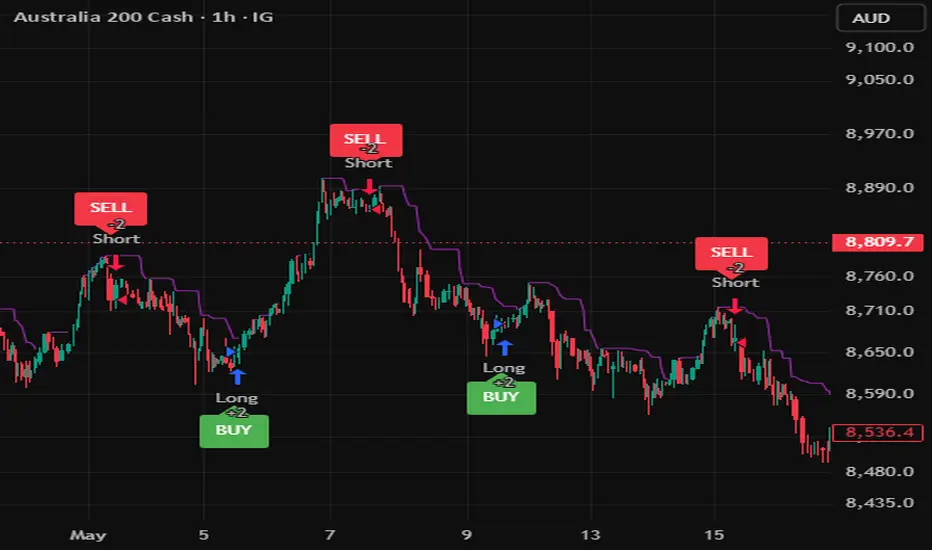
EOLAX Signal Pro - Bollinger Mecha 35%este indicador combina 3 indicadores juntos, sobre compra o sobre venta agotada combinado con rsi y bandas de bollinguer. una combinacion perfecta para la entrada.指标由sfonio提供134
Zero Lag CVD, RSI & Stochastic Divergence (All-in-One) [D4A]Zero Lag CVD, RSI, Stochastic Divergence Overview Zero-Lag Divergence indicator is designed to identify bullish and bearish divergences as they happen, without relying on traditional pivot confirmation delays. By comparing price action with output of CVD, RSI and Stochastic across two independent detection periods, the indicator helps traders spot potential trend exhaustion and reversal opportunities earlier than conventional divergence tools. How is this indicator different from other si指标由dub4art提供已更新 14 1.3 K
EWO,RSI advanced Signals Strategy - Exhaustion Filter## EWO, RSI, MFI - Advanced Exhaustion Filter ## Overview Strategy - Advanced Exhaustion Filter is a comprehensive momentum and mean-reversion trading strategy designed for Pine Script v6. It combines multi-indicator momentum tracking with structural price filters to protect traders from "falling knives" during market capitulation and distribution phases. By blending the Elliott Wave Oscillator (EWO), Relative Strength Index (RSI), Money Flow Index (MFI), and volume-weighted confirmations, th策略由Pridarasx提供已更新 3 1.8 K
Hybrid OscillatorHybrid Oscillator Hybrid Oscillator is a visual oscillator designed to read momentum pressure, overbought conditions, oversold conditions, oscillator crosses, extreme zones and directional fading inside a separate chart pane. the indicator combines a selected oscillator engine with a smoothed wave, a secondary cross line, gradient zones, level dots and alert conditions. the goal is to help traders understand when momentum is expanding, when it is reaching an extreme area, when it is cooling d指标由Alpha_Wizard提供48
Kevin's swingdicatorsKevin's swingdicators Kevin's swingdicators is a combined indicator for swing trading analysis. It includes an RSI divergence module and a configurable moving average ribbon. The moving average module plots up to six moving averages on the price chart. By default, the first four moving averages are enabled: 20 SMA, 50 SMA, 100 SMA and 200 SMA. The fifth and sixth moving averages are disabled by default and can be configured manually. Users can change the moving average type, source, length and指标由ScubaRo提供已更新 9
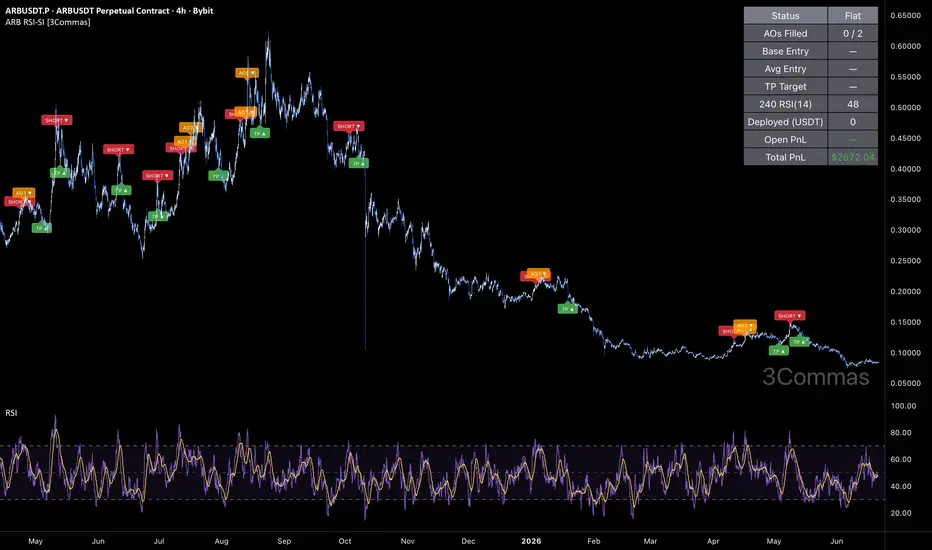
ARB RSI Short Indicator [3Commas]ARB RSI Short Indicator 🔷 What it does: This is the signal-only companion to the ARB RSI Short strategy — it fires alerts without running a backtest engine. It tracks one virtual short at a time, opened when the 4-hour RSI(14) crosses back DOWN through 74 (an overbought rollover). Two averaging orders stack ABOVE entry at +5% and +10% (sizes scaled 1.7×: 850, then 1,445). The deal closes on a fixed 6% Take Profit from the average. There is no Stop Loss — the position is bounded by the 2-rung 指标由3Commas提供6
3D: Real Smartphone Monitor Pro3D Real Smartphone Monitor Pro: Master Discipline and The Art of "No Position" IMPORTANT: First-Time Setup and Size Adjustment Because TradingView automatically scales the Y-axis (price) and X-axis (time) differently depending on the asset and your screen resolution, this 3D monitor may appear stretched, squashed, or incorrectly sized upon initial application. This is a standard limitation of projecting 3D elements onto 2D charts. How to resolve this immediately: Open the Indicator Se指标由ALT_analyst提供已更新 116
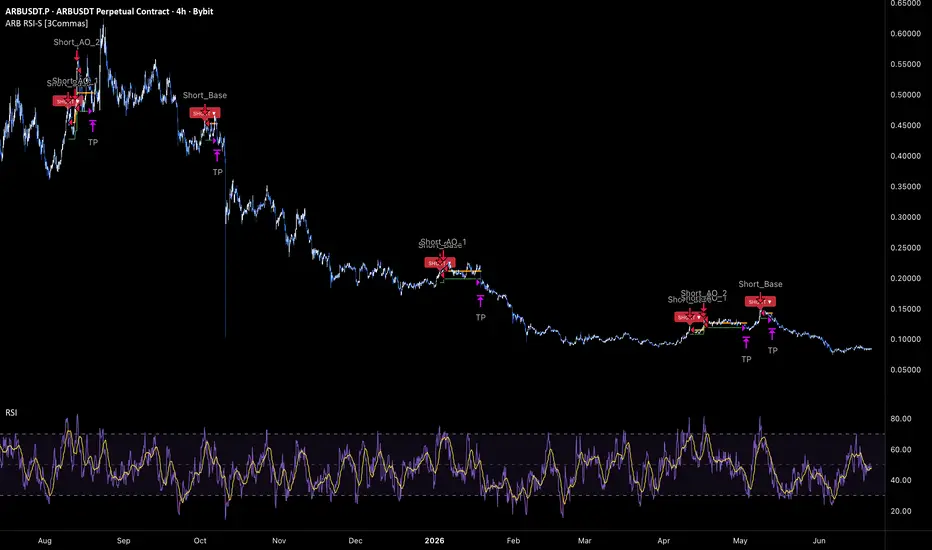
ARB RSI Short Strategy [3Commas]ARB RSI Short Strategy 🔷 What it does: A short-only, momentum-fade DCA system for Arbitrum on the 4-hour chart. The deal opens only when the 4h RSI(14) crosses back DOWN through 74 — a clean overbought rollover, which on a higher timeframe is a rare, selective event. Two averaging orders then stack ABOVE the base entry (+5% and +10% adverse) with sizes scaled 1.7× per rung, so a continued push higher improves the average. The position closes on a fixed 6% Take Profit from the average. There i策略由3Commas提供20
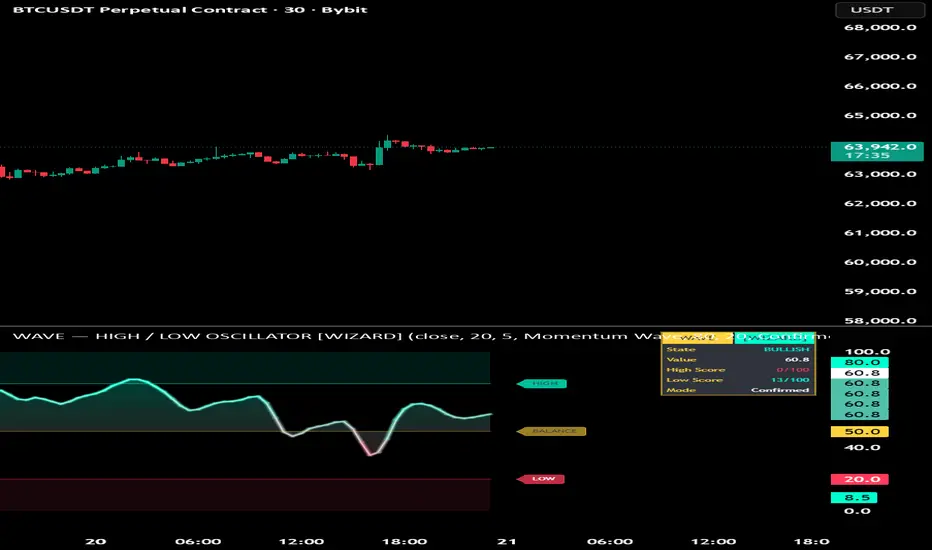
Wave Oscillatorwave high low detector pro wave high low detector is a bounded oscillator designed to help identify potential local high and low areas using momentum, rsi behavior, pivot confirmation, candle rejection, divergence, atr exhaustion, structure breaks, cooldown logic and quality scoring. the oscillator moves between 0 and 100. a value near 100 means price is trading close to the upper part of its recent range or showing strong upside momentum. a value near 0 means price is trading close to the l指标由Alpha_Wizard提供32
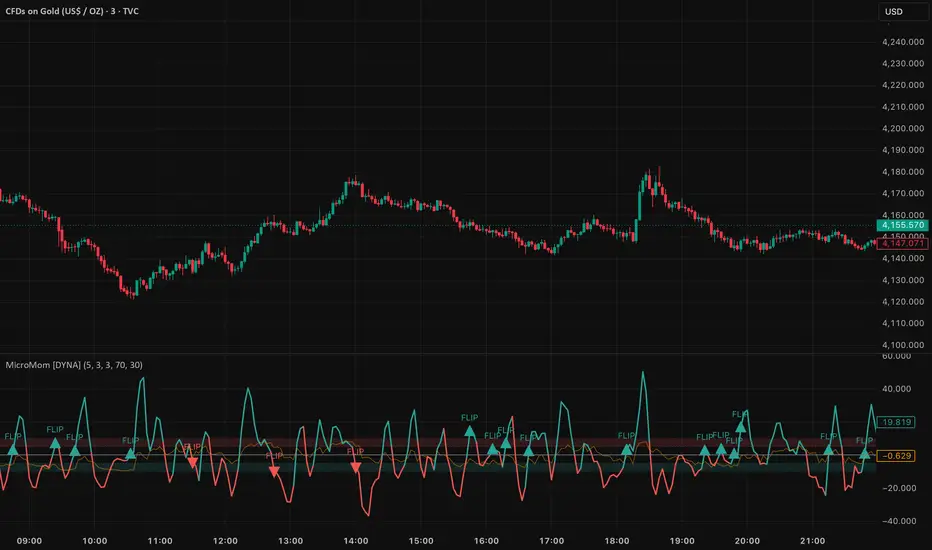
Micro Momentum Oscillator [DYNA]Micro Momentum Oscillator is a purpose-built momentum tool for scalpers who need to know the instant short-term momentum shifts direction. It doesn't just tell you whether RSI is high or low -- it measures how fast RSI is changing and fires a signal the moment that rate of change flips in an extreme zone. Most oscillators lag behind price on micro timeframes. By the time a standard RSI or MACD prints a crossover on a 1-minute chart, the move is already half over. Micro Momentum Oscillator solve指标由van007trader提供17
MACD RSI Signal [XWiseTrade]MACD RSI Signal The classic MACD settings — 12, 26, 9 — were chosen decades ago for daily stock charts, where they roughly meant "half a month, one month, and a week." Almost everyone then copies those exact numbers onto 5-minute, 15-minute and hourly charts, where they no longer correspond to anything meaningful. This indicator rebuilds the MACD/RSI combination for intraday trading, with periods anchored to how the global trading day is actually structured, and with RSI graded in zones rather 指标由xwisetrade提供72
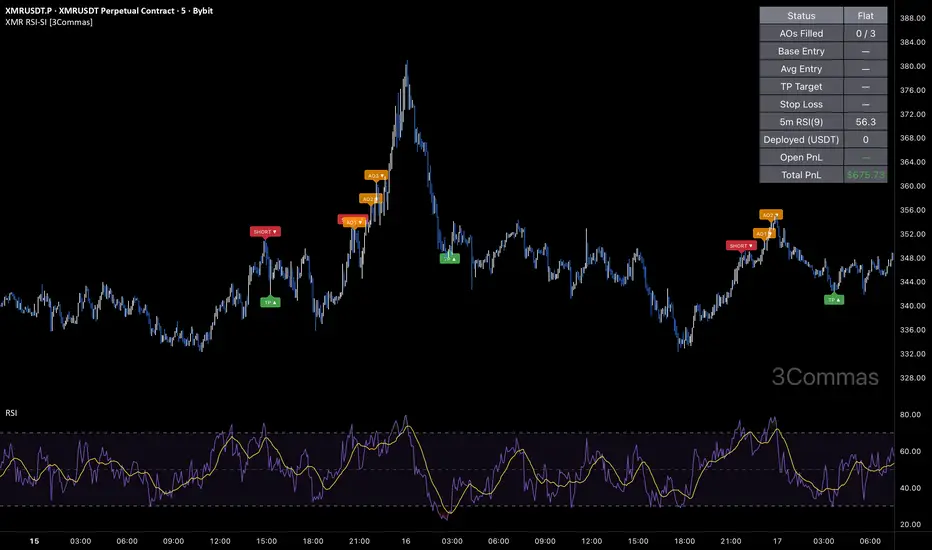
XMR RSI Short Indicator [3Commas]XMR RSI Short Indicator 🔷 What it does: This is the signal-only companion to the XMR RSI Short strategy — it fires alerts without running a backtest engine. It tracks one virtual short at a time, opened when the 5-minute RSI(9) crosses back DOWN through 80 (an overbought rollover). Up to three averaging orders stack at +1%, +2%, and +3% above entry (equal size). The deal closes on a 1.3% Take Profit from the average with a 0.3% trailing lock, or a hard 8% Stop Loss. Running average entry, dep指标由3Commas提供7
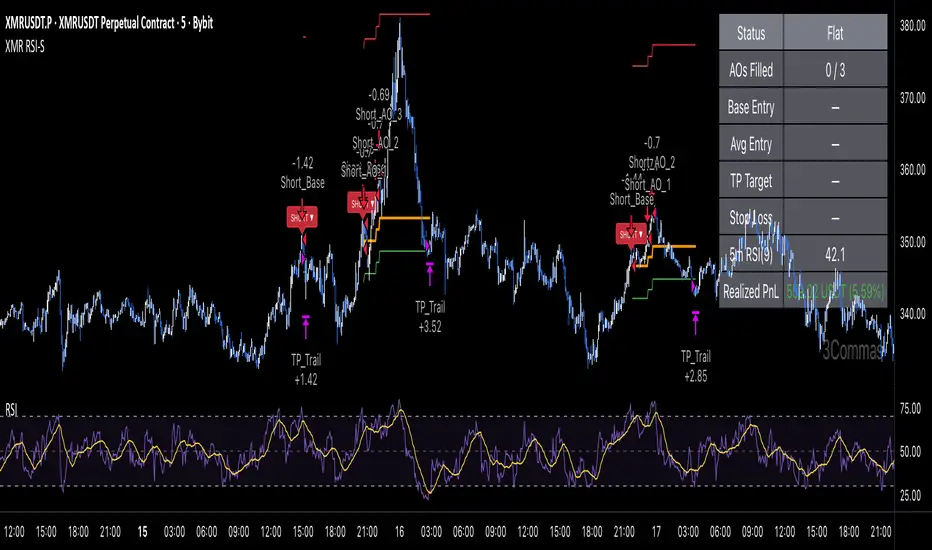
XMR RSI Short Strategy [3Commas]XMR RSI Short Strategy 🔷 What it does: A short-only, momentum-fade DCA system for Monero. The deal arms the moment a fast push higher exhausts itself: the 5-minute RSI(9) must cross back DOWN through the 80 line. From that base short, up to three averaging orders stack at +1%, +2%, and +3% above entry (equal size), so a continued push higher simply improves the average. The position is then released on a 1.3% Take Profit from the average with a 0.3% trailing lock, while a hard 8% Stop Loss de策略由3Commas提供22
Reversion Setup - Bollinger Bands + RSI Live Dashboard📊 REVERSION SETUP — Bollinger Bands + Live RSI Dashboard A focused mean-reversion tool combining Bollinger Bands with a real-time RSI dashboard — built to spot potential reversal zones without cluttering your chart or burning extra indicator slots. ✅ Bollinger Bands — fully configurable (period, deviation, source, color) ✅ Live RSI Dashboard — current RSI value, overbought/oversold levels, and real-time alert status, shown in a clean table instead of a separate pane 🎯 WHY THIS COMBO指标由Wolfi_FX提供15
Trend Setup - 3 EMA + RSI Dashboard📊 TREND SETUP — EMAs + Live RSI Dashboard A clean, all-in-one trend tool combining the 3 most-used EMAs with a real-time RSI dashboard — no need to load multiple indicators separately. ✅ EMA 50 / 100 / 200 — fully configurable (period, source, color, on/off) ✅ Live RSI Dashboard — shows current RSI value, overbought/oversold levels, and a real-time status alert, displayed in a sleek table instead of a cluttered separate pane 🎯 WHY THIS COMBO EMAs give you the big-picture trend direct指标由Wolfi_FX提供9
Multi-TF Dashboard 📊 MULTI-TIMEFRAME DASHBOARD — Everything in one table Stop jumping between charts to check timeframe confluence. This dashboard shows you, in a single configurable table: ✅ RSI (14) — automatically color-coded for overbought/oversold ✅ MACD — bullish/bearish direction based on line/signal crossover ✅ EMA Bias — trend based on price vs your EMA (configurable period) ✅ ATR — volatility classified as High/Medium/Low vs its own historical average ✅ MACD Divergences — both regular AND hidden, dete指标由Wolfi_FX提供15
ORB ORB V2 plots the Opening Range Breakout for the Asia, London, or New York session, using the high and low of a selectable timeframe candle (1 to 240 min) captured at the exact session open in New York time. What it draws: High, midpoint (50%), and low lines of the opening range, extended live for the duration of the session Color-coded labels showing the exact price of each level A vertical opening marker at session start Built-in bias filter: A configurable EMA (default 20-period on the 1H t指标由Wolfi_FX提供已更新 29
ZenScalper Pro 70/30 Heads-Up + 73/27 ContinuationRSI continuation indicator using 70/30 heads-up levels and 73/27 confirmation levels. Includes volume confirmation, EMA trend filter, watch signals, and customizable RSI coloring.指标由ZenScalper69提供8
Undertow BacktestSTRATEGY — UNDERTOW BACKTEST SHORT SUMMARY The backtest engine for Undertow. Simulate the buy/sell dots across any asset and timeframe, and choose whether to trade only the strong signals or every crossover. WHAT IT IS Undertow Backtest is the strategy version of the Undertow indicator. It applies Undertow's buy and sell logic to historical data and reports how a simple long-only approach would have performed — net profit, win rate, drawdown, and a full trade list — in TradingView's Strat策略由grieto提供15
BocchiTheTrader | Quantum Trend Matrix# BocchiTheTrader | Quantum Trend Matrix ## 🚀 OVERVIEW In modern electronic markets, retail traders suffer from cognitive overload. Managing multiple charts, fragmented timeframes, and dozens of conflicting indicators often leads to analysis paralysis and execution delays. The **Quantum Trend Matrix** by **BocchiTheTrader** solves this structural problem. It is an enterprise-grade, localized Heads-Up Display (HUD) that synthesizes a high-fidelity technical matrix directly onto your active trad指标由BocchiTheTraderr提供71
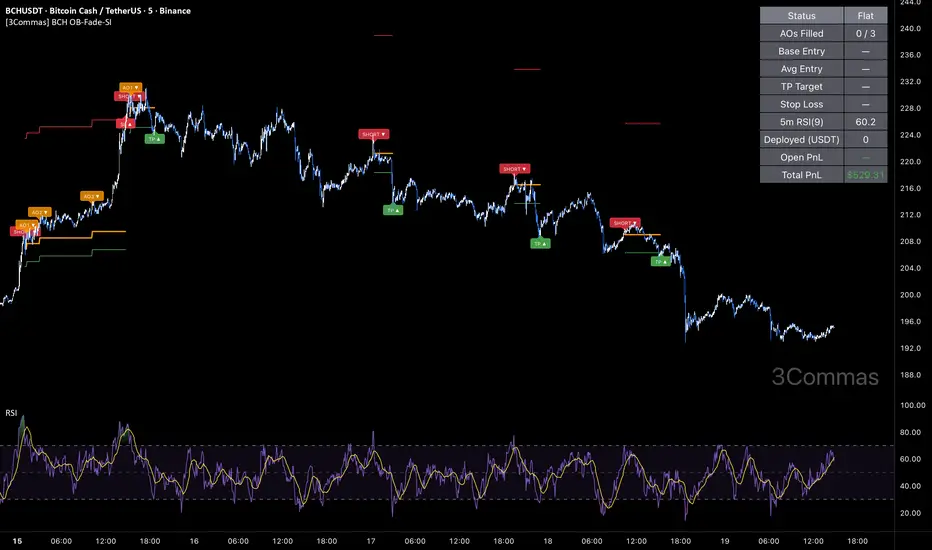
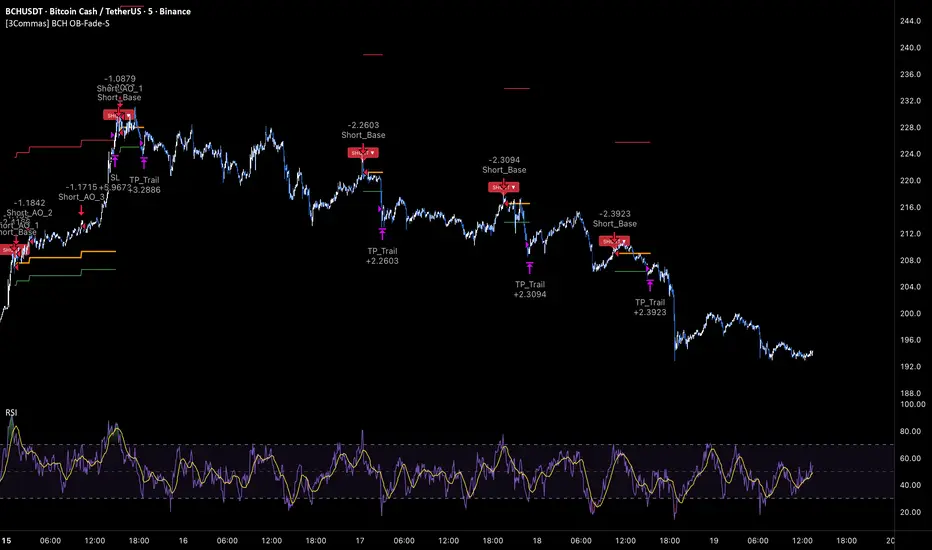
[3Commas] BCH Overbought RSI Fade - Short Indicator BCH Overbought RSI Fade - Short Indicator 🔷 What it does: This is the signal-only companion to the BCH Overbought RSI Fade Short strategy — it fires alerts without running a backtest engine. It tracks one virtual short at a time, opened when the 5-minute RSI(9) crosses back DOWN through 80 (an overbought rollover). Up to three averaging orders stack at +1%, +2%, and +3% above entry (equal size). The deal closes on a 1.3% Take Profit from the average with a 0.3% trailing lock, or a hard 8% Stop指标由3Commas提供39
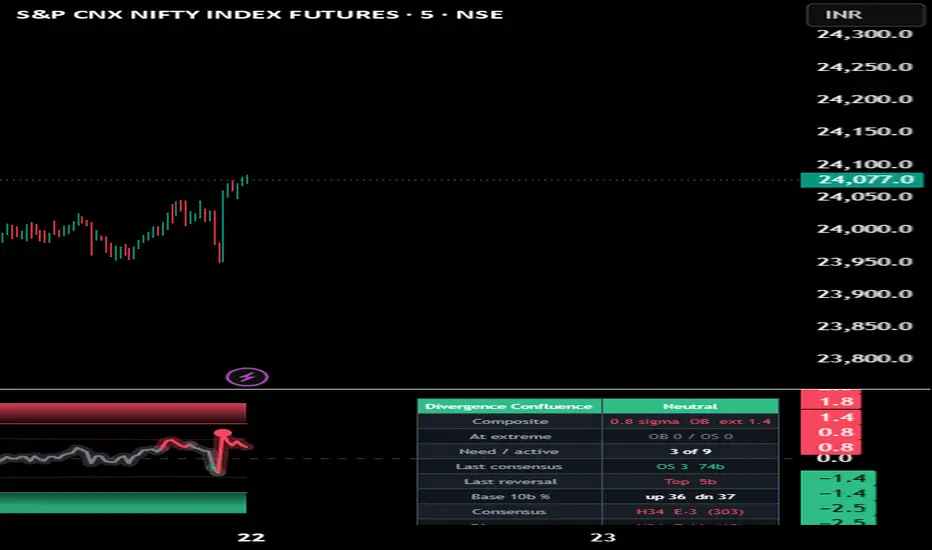
Multi Factor Divergence Confluence OscillatorMulti-Factor Divergence Confluence Oscillator What it is This indicator detects price/oscillator divergence on four independent indicator families at the same price pivots and reports how many of them agree. The lower-pane histogram shows the signed agreement count — positive (bullish) above the zero line, negative (bearish) below — and a signal is flagged only when at least N independent families diverge at the same swing. It is a context tool that measures agreement, not a buy/sell system, 指标由Market_Logic_India提供已更新 22
RSI Microstruttura MTF AutoThis indicator reads the RSI of the timeframes immediately below your chart to judge whether an RSI move is backed by real underlying momentum or likely to fail. It auto-detects your chart timeframe and pulls the RSI from the 5 standard grades directly beneath it — no manual setup. On a daily chart it reads 4h, 3h, 2h, 1h and 45m. Two lines are plotted. The thick line is the "micro" average: the mean RSI across those 5 lower timeframes. The orange line is the average of their moving averages (SM指标由andreapsoroulas21提供15
[3Commas] BCH Overbought RSI Fade - Short Strategy BCH Overbought RSI Fade - Short Strategy 🔷 What it does: A short-only, momentum-fade DCA system for Bitcoin Cash. The deal arms the moment a fast push higher exhausts itself: the 5-minute RSI(9) must cross back DOWN through the 80 line. From that base short, up to three averaging orders stack at +1%, +2%, and +3% above entry (equal size), so a continued push higher simply improves the average. The position is then released on a 1.3% Take Profit from the average with a 0.3% trailing lock, while策略由3Commas提供40