Expected Move BandsEvery options desk opens the week with the same question: how far is this thing supposed to travel by Friday? The answer is already priced. Implied vol is the market's own estimate of the coming move, and you can read it straight off the chart instead of running the math in your head.
This draws that estimate as bands around price. It anchors to the open of each week, or month, and holds the bands flat across the period, the way a desk marks its expected range on Monday morning and watches price work inside it.
The inner band is one standard deviation. If the market's vol read is right, price closes inside it about two times out of three. The wider band is two sigma, the tail. When price breaks the one-sigma band and holds out there, that is range expansion, the move getting repriced while it happens.
The bands are fed by whichever volatility index belongs to the instrument you are charting -- GVZ if it is gold, OVX for crude, VXN on the Nasdaq, DVOL on bitcoin, VIX on the S&P. The dashboard names the one it picked. That is the only case where implied vol is actually observed.
Where no such index exists, the bands are derived instead: a reference index scaled by the ratio of this instrument's realized vol to the reference's. The level and the event risk still come from a real options series and only the ratio is estimated, and the dashboard marks it DERIVED. It cannot see risk specific to one instrument, such as a single name going into its own earnings.
Where neither is possible nothing is drawn and the dashboard says why. There is no realized-vol fallback, deliberately: a backward-looking estimate diverges from traded implied vol exactly in the regimes you would open this for. Into a known event, implied rises while realized is still asleep. After a shock, realized stays elevated while implied mean-reverts. A band I cannot stand behind does not get drawn.
The dashboard shows the IV source and which tier it came from, the live IV, the expected move in points and percent, and the exact levels. Labels print the prices on the chart. Alerts fire when price closes outside one sigma or tags two.
Read the band correctly: an expected move is a probability statement, not a boundary. Price closing outside the one-sigma band roughly a third of the time is the model working, not failing. The realized-vol ratio behind derived mode is measured on daily bars, so it does not shift when you change chart timeframe. 指标

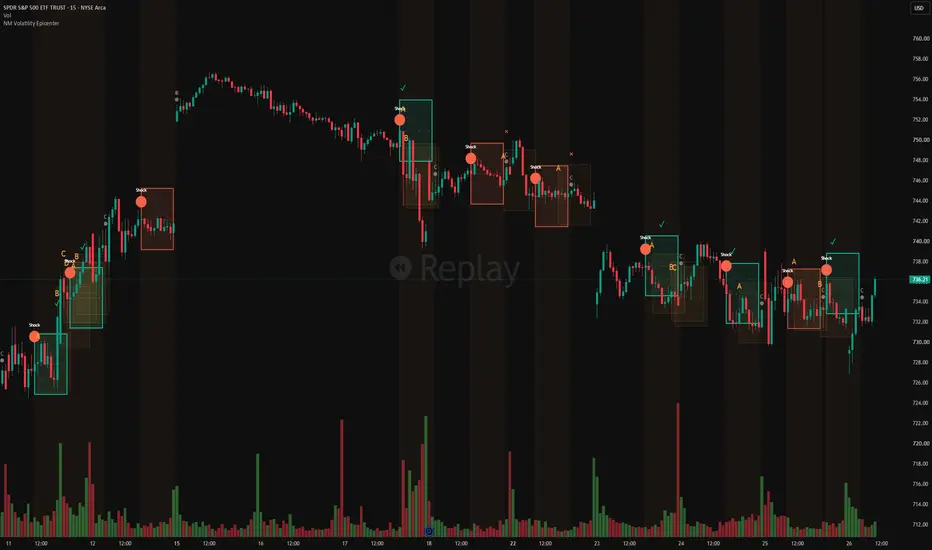
Volatility Epicenter and AftershocksVolatility Epicenter and Aftershocks is an event-conditioned market-memory indicator. It detects moments when a recent six-bar path is unusually dominated by one or two returns and unusually active relative to the same part of the trading session.
When a primary Shock is confirmed, the indicator freezes a movement box around that bar's close. The box does not say price will rise or fall. Its height comes from the maximum excursions of completed historical Shock events over the same forward horizon.
HOW MARKET MEMORY WORKS
This script does not use an LSTM or neural network. Its memory consists of rolling empirical distributions and a transparent event-state machine.
For log return r(t) = ln(Close(t) / Close(t−1)), the recent path and volatility concentration are:
Path = Σ|r|
Concentration = Σr⁴ / (Σr²)²
Seasonal memory compares the current Path with its median at the same time in previous sessions:
Seasonal Ratio = Current Path / Same-Time Historical Median
A Shock occurs when both Concentration and Seasonal Ratio exceed their rolling percentile thresholds. Thresholds are calculated before adding the current observation, preventing leakage.
After each Shock matures, the script stores its maximum 3-, 5- and 10-bar excursion:
Excursion(h) = max
The box uses the selected percentile of completed 10-bar excursions:
Upper = Shock Close × exp(Excursion Percentile)
Lower = Shock Close × exp(−Excursion Percentile)
The first Shock fixes the box and expiry. Additional detections inside that window become A, B, C aftershocks without restarting it.
In simplified form:
shock = concentration >= historical_threshold
and seasonal_ratio >= historical_threshold
box_height = percentile(completed_shock_excursions)
This is empirical market memory —not ATR, candle-size projection or black-box prediction.
Why this is not another breakout or large-candle script
• A breakout is defined by price crossing a level. Epicenter does not use support, resistance, channels, or prior highs and lows to define a Shock.
• A large-candle alert is usually defined by one candle's body or range. Epicenter evaluates the structure of a multi-bar return path.
• ATR measures average true range. Epicenter asks whether the same amount of movement arrived in a concentrated burst rather than being distributed across bars.
• The empirical box is not an ATR multiple and is not projected from the Shock candle's size. It is learned from completed post-Shock excursions.
What market memory means
Read the chart in ten seconds
• Shock - the primary volatility event. It starts the original movement window.
• Solid rectangle - the empirical range associated with the primary shock.
• A, B, C... - additional shocks detected before the original window ends.
• Dotted rectangles - aftershock context. They are not scored as separate targets.
• Standalone green check - price reached either boundary of the primary box before expiry.
• Standalone red cross - the original window ended before either boundary was reached.
What the box means
The range is learned from the maximum excursions of completed historical shock events. Box-height percentile controls how wide that range is:
• P50 is the typical reach. Approximately half of comparable completed shocks moved farther and half moved less.
• P85 is a wider stress envelope. Only a smaller minority of comparable completed shocks moved farther.
The box is symmetric because the model estimates movement magnitude, not direction. A wider box is not a stronger bullish or bearish opinion.
Practical use
• Separate an ordinary large candle from a path whose volatility structure is genuinely unusual for that session time.
• Add event context to a breakout: a breakout with no Shock is a level event; a breakout with a Shock also carries concentrated-volatility risk.
• Recognize a Shock inside a range even when no breakout system would react.
• Use P50 as a typical remembered excursion and P85 as a wider stress envelope when planning exposure, stops, or monitoring intensity.
• Audit whether the remembered boundary was reached before the original ten-bar window cooled.
How the event is detected
The engine uses confirmed chart bars and combines two conditions across the recent six-bar path:
1. Variance concentration: whether one or two returns dominate the recent path's realized variance.
2. Seasonal volatility abnormality: how active the recent path is compared with the same bar position in prior sessions.
A primary event appears only when both measures exceed their rolling thresholds. Additional detections inside the primary window are labelled as aftershocks rather than restarting the main outcome test.
Non-repainting design
• Events are confirmed only after a chart bar closes.
• The primary box coordinates are frozen when created.
• Aftershocks do not extend or reset the primary box's original window.
• A check or X is added only after the corresponding outcome is observable.
• Keep all preserves historical boxes for audit. Latest only is an explicit display choice that suppresses secondary boxes.
Recommended starting setup
• Timeframe: 15 minutes.
• Session preset: Auto.
• Box-height percentile: 50.
• Box history: Keep all.
• Zone annotations: Marks only.
Recommended presets:
SPY, QQQ and US stocks: US ETF RTH
NQ and ES: CME equity futures
Gold, Silver and energy futures: Metals / energy futures
Bitcoin and crypto: Crypto 24/7
NIFTY and BANKNIFTY: Custom session, 09:15 start and 25 bars per session on a 15-minute chart
BOX HEIGHT
P50 shows the typical historical reach and is the recommended default.
P60 to P75 shows an expanded movement range.
P80 to P85 shows a wider stress envelope.
A higher percentile is not a stronger prediction. It simply displays a wider historical range.
HIGHER-TIMEFRAME BOXES
Use Adaptive mode on charts above 15 minutes. Boxes become available after five completed Shock outcomes and may use outcomes that cross session boundaries.
Strict mode requires the full historical sample and same-session outcomes.
Early Shocks may appear without boxes while the market memory is warming up. The script does not add boxes retrospectively because that would introduce lookahead.
DISPLAY
Keep all preserves historical boxes for auditing.
Latest only keeps the newest primary box.
Marks only is recommended. It displays checks and crosses without adding text inside boxes.
Full text adds explanations inside boxes but may become crowded.
SENSITIVITY
Recommended balanced settings are a six-bar path, concentration percentile of 80, seasonal-volatility percentile of 50 and a ten-bar aftershock window.
Higher thresholds produce fewer and more exceptional Shocks. Lower thresholds produce more signals.
Changing the timeframe, session preset or detection settings recalculates the model across the available chart history. This is recalculation under a different configuration, not repainting.
Session presets are included for US ETF regular hours, CME equity futures, metals and energy futures, crypto, and custom sessions. The model must collect enough calibration and completed-event history before boxes can be displayed.
ALERTS
• Primary volatility epicenter detected.
• Secondary aftershock detected.
• Projected percentile boundary achieved.
• Original aftershock window cooled.
Important limitations
• This is not a buy/sell system and does not predict direction.
• The empirical range describes this symbol's observed history; it is not a guarantee of 指标

2022 Model+ (M1D)2022 Model+
Maps the ICT 2022 Model sequence on the chart and frames it against a multi-timeframe read of structure, liquidity and imbalance.
The 2022 Model is a sequence, not a pattern:
Liquidity is raided, price displaces away from the raid, and the displacement leaves a fair value gap that becomes the entry reference. This tool marks the first two stages where they actually happen and draws the context the third is read against.
The marker
A swing pool is raided by a wick and the candle closes back inside it — a raid that failed, not a break. That arms a setup. If price then displaces away from the raid extreme by more than the threshold before the setup expires, the marker fires: the raided level draws dotted back to where it formed, the leg is shaded, and a label reports its size. A close back through the raided level cancels the setup instead, because the raid held. A deeper wick while the setup is live re-measures from the new extreme.
The threshold is a share of the previous day's range or a fixed point distance. The scaled option is the default and is measured against the day rather than against chart bars, so the same setting means the same thing on any chart timeframe and travels across futures, metals and crypto.
Confirmed events only
Every marker, level and zone is recorded when the candle that produced it closes, and its position is not recalculated afterwards. The forming candle can draw nothing and remove nothing — a setup found an hour ago sits where it was found, and stays until its own state or the display cap retires it, not until the calculation window moves past it. Alerts follow the same rule.
Three timeframes
Swept liquidity, market structure shifts and fair value gaps are each read on three timeframes at once — a primary higher timeframe plus a mid and a low layer, all set in one place.
Each of the three is defined once and shared, so the layers can never disagree about what they are looking at, and the higher timeframe is always served first. A level already claimed by a senior timeframe is not drawn again by a junior one, because that is the same event seen at finer resolution. A lower-timeframe read at its own level still draws — catching the move before the higher timeframe confirms it is the entire point of the layer.
Swept liquidity.
A swing high or low that a later candle raids and then closes back inside. Every sweep draws identically whatever its timeframe, because a spent pool is a spent pool; the label carries the timeframe, which is the one thing the line cannot express.
Market structure shifts.
A true swing broken by a body close. A true swing is a level price actually turned at: a swing low sits where a down candle gives way to an up candle, not merely at a low that happens to sit below its neighbours. The first close beyond the swing's full wick extreme marks the shift; later closes past it are continuation. The three layers rank by weight and style so the timeframe of a shift reads at a glance.
Fair value gaps.
BISI+ and SIBI- zones, gated by gap height and by the displacement that opened them. A zone moves through live, active, inverted and spent, and its border changes with each; that state advances on chart bars, so a zone is marked entered by the bar that actually enters it. Each zone starts at the exact bar whose wick formed its defining edge rather than at a timeframe boundary, so it is always clear which candle the imbalance came off. Overlapping and stacked zones are thinned against a shared budget, so the zone count on the chart is the number set rather than that number once per layer.
The day
The current day's open, high, low and quadrant ladder, projected across price as a live premium and discount reference. The day boundary is either midnight New York or the symbol's own daily roll.
Beside price, the day is drawn as a projected candle — whole, or opened up into its own quarters or sixths. Split, it also draws dividers and each block's high and low back onto the chart, so the internal shape of the day reads in place as well as beside it. A countdown shows the time left on the block currently forming.
Context
Previous-day levels.
The prior day's high, low and midpoint. A level runs to the right while it is still live and stops at the wick that swept it once taken, so the line spans exactly the window in which the level mattered.
SMT divergence.
Where a swept level was taken on the chart symbol but the correlated market failed to take its matching swing, the two extremes are joined. Index futures, metals and major crypto pair automatically; any symbol can be set manually. A divergence price later trades back through is marked broken rather than removed.
A four-row console reporting day bias, premium or discount, which side the last higher-timeframe sweep took, and which of the previous day's pools have already gone. Everything else draws on the chart at the price it happened, so the console does not repeat it.
Alerts on confirmed closes only, for swept liquidity and structure shifts on each of the three layers, and for the model's own sweep-and-reclaim moment. The forming candle can draw on the chart but can never fire an alert.
Settings
Grouped in reading order: the model first, then the daily frame, the projected candle, the timeframe engine, then each context layer and finally presentation. Every element switches off independently, and colour, width and label size are exposed throughout.
Notes
A layer whose timeframe does not sit between the chart and the primary higher timeframe is hidden rather than drawn wrongly.
SMT is unavailable in bar replay — replay rewinds the chart symbol alone, so the correlated symbol keeps returning live data and the two no longer line up. Nothing is drawn rather than something wrong. It is also silent if a paired symbol does not resolve on your data plan; set the symbol manually.
Disclaimer
This is an analysis tool. It marks structure and delivery — it does not produce trade signals, entries, targets or position sizing.
This is not financial advice. Markets carry risk and past behaviour does not predict future behaviour; every decision taken using this tool is your own. 指标

Uptrick: Adaptive Trend TrailIntroduction
Uptrick: Adaptive Trend Trail is a trend-following overlay indicator that holds one of three states, bullish, bearish or neutral, where neutral applies only before the first confirmed flip on the chart. That state is visualized through a layered ATR trail or volatility bands, colored candles, and reversal labels. Rather than deriving direction from a single crossover, the indicator builds a composite regime score from nine weighted measurements, requires agreement from three internally calculated adaptive Supertrends, and then applies confirmation, cooldown and hysteresis rules whose strictness changes with measured market conditions. It also includes a valuation meter and a set of internal simulation statistics displayed in the Data Window.
The design intent is to require more evidence before accepting a state change when measured directional efficiency is low, rather than to detect every turn as early as possible.
Originality
A trend state can be derived from a single measurement: a moving average cross, one Supertrend, or one oscillator threshold. Each responds to a different aspect of price and each has conditions where it carries less information. A long moving average responds slowly. A single volatility-stop line can change direction repeatedly when price oscillates within its band width. An oscillator carries no information about price structure or volatility state. This script combines measurements that are informative under different conditions, so that no single one can force a state change on its own, and it makes the strictness of the decision depend on measured market conditions rather than holding it fixed.
Why these specific components were chosen :
Directional efficiency (net movement over total path traveled over 10 bars) is used because it distinguishes directional movement from back-and-forth movement covering the same ground. Its inverse, chop, is the central control variable of the script. Chop is not only an input to the score; it directly changes how many Supertrends must agree, how many bars a signal must persist, how wide the hysteresis gate is, and how long the cooldown lasts. This is the mechanism that lets one configuration behave differently in high-efficiency and low-efficiency conditions without the user changing settings.
Three Supertrends at different ATR lengths (fast 9, medium 14, slow 21) are used instead of one because a single Supertrend returns a binary direction with no measure of agreement. Three produce a vote count, which serves both as a gate (how many must agree) and as a continuous input to the composite score (vote difference divided by three). Their ATR multipliers are not fixed: chop and volatility expansion are added on top of the user's base factor, so all three widen as efficiency falls or volatility expands.
Distance from the EMA baseline and momentum are both normalized by ATR rather than used raw. This expresses them relative to recent volatility and reduces their dependence on the instrument's absolute price scale, so the same threshold values remain meaningful on instruments with very different nominal prices.
Baseline slope and a slower HL2 baseline slope are included because distance alone does not distinguish a market moving away from its mean from one moving back toward it. Two slopes at different speeds mean a short-term push against a flat longer-term structure contributes less to the score than an aligned move.
RSI is included with a small weight (0.08) as a momentum cross-check rather than as a signal generator. At that weight it cannot on its own carry the score past the gate.
Candle pressure (body direction and close location within the bar) and structure breaks (close beyond the prior N-bar high or low) are included with small weights (0.05 each) because they respond on the current bar, adding a small amount of immediacy to a score otherwise built from lagging averages.
How they work together : the nine fields are blended into one regime value smoothed by a 3-period EMA. That value must exceed a dynamic gate whose size grows with selectivity, chop and volatility deviation. Price must also be displaced from the baseline. Momentum must have the correct sign. The Supertrend vote must be confirmed and persistent. Only then does a candidate exist, and the candidate must persist for one to three consecutive bars depending on chop, with a cooldown of six to ten bars since the last flip. A separate strong-move path can bypass the candidate persistence requirement and the cooldown when all three Supertrends agree unanimously, the score exceeds the gate by an additional margin, momentum is strong and efficiency is above 0.42. It does not bypass the underlying Supertrend persistence requirement. Finally, a takeover rule requires the fast Supertrend plus at least one slower one to agree with the new direction, so a flip cannot occur against the shorter-term Supertrend structure.
The valuation meter and the internal simulation exist to provide context on the same chart rather than requiring separate indicators: one shows where smoothed RSI currently sits on a segmented scale, the other reports how the script's own state changes would have resolved under a simple trailing-stop assumption.
Features
Single trend state driving all visuals, bullish or bearish once the first flip occurs, neutral before that point
Composite regime score built from nine weighted fields, blended and smoothed with a 3-period EMA
Weighting: baseline distance 0.22, Supertrend consensus 0.20, momentum 0.19, baseline slope 0.14, slow baseline slope 0.10, directional efficiency 0.09, RSI 0.08, candle pressure 0.05, structure break 0.05
Directional efficiency engine measuring net movement against total path over 10 bars, producing a chop value used throughout the script
Volatility regime measurement comparing current ATR to its 50-period EMA, producing expansion and deviation values
Three internally calculated Supertrends (fast, medium, slow) used for logic only and not plotted on the chart
Adaptive Supertrend factors, where chop and volatility expansion are added on top of each user-set base multiplier, with the slow Supertrend receiving the largest adjustment
Vote-based Supertrend consensus requiring two of three in normal conditions and three of three when chop exceeds 0.70
Supertrend persistence requirement of one confirmed bar normally and two when chop exceeds 0.72
Dynamic hysteresis gate that widens with the selectivity input, with chop, and with volatility deviation
Price displacement filter requiring close to be above or below the baseline by an ATR-scaled amount
Momentum sign filter requiring directional momentum beyond a small deadband
Adaptive confirmation requiring one, two or three consecutive candidate bars depending on measured chop
Strong-move path that can bypass the candidate confirmation requirement and the cooldown when all three Supertrends agree, the score clears the gate by an additional 0.26, momentum exceeds 0.16 and efficiency exceeds 0.42, while still requiring Supertrend persistence
Takeover rule requiring the fast Supertrend plus one slower Supertrend to align with the new direction before any flip
Adaptive cooldown of six to ten bars between state changes, scaled by chop
All state changes evaluated on confirmed bars only, so the state does not flip on an unclosed bar
Trail overlay mode with three layers constructed at 0.55, 1.15 and 1.60 ATR multiples from the smoothed baseline, placed below it in bullish states and above it in bearish states, scaled by the width input
Bands overlay mode with three levels on each side of the baseline at 1.30, 2.00 and 2.90 ATR multiples, scaled by the width input, using an additional smoothing stage applied to the already-smoothed baseline and ATR
Overlay None mode that hides the Trail and Bands while leaving the other independently controlled outputs available
Smoothness control applied to the baseline and ATR used for the overlay geometry
Trend candles that recolor the price bars to the active state
Reversal labels printed on the bar where the state changes, placed relative to the outer trail layer
Valuation meter drawn as a table with a segmented scale and a pointer showing where 3-period smoothed RSI(14) currently sits
Four meter sizes: Off, Compact (11 segments), Normal (17 segments) and Large (25 segments)
Six meter positions covering top and bottom, left, center and right
Internal historical trade simulation driven by the script's own state changes, reported in the Data Window
Simulation outputs: return percent, win rate percent, profit factor, maximum drawdown percent and closed trade count
Simulation uses a fixed 10000 starting equity and full-equity sizing, with a fee equal to 0.1 percent of entry equity deducted at entry and a further amount equal to 0.1 percent of that same entry equity applied at exit
Simulation stop is set from the outer trail on the entry bar, constrained to at least one minimum tick beyond the entry close, and thereafter can only move in the position's favorable direction using the previous bar's outer trail value
Simulation return figure includes unrealized profit or loss on any position still open, so it is not a closed-trade-only figure
Two alert conditions, one for the bullish flip and one for the bearish flip, each carrying the ticker in the message
Inputs
Group 01, Trend Engine
Trend Length, default 34, range 10 to 200. Sets the primary EMA baseline used for the overlay, the distance field and the baseline slope field. It also determines two internally derived lengths: the slower HL2 baseline is calculated at approximately 70 percent of this value with a floor of 10, and the structure-break lookback is approximately 12 percent of this value with a floor of 3.
Momentum Length, default 12, range 3 to 100. Lookback used to measure directional momentum before ATR normalization.
Signal Selectivity, default 0.35, range 0.10 to 1.25. Raises both the hysteresis gate and the required price displacement. Higher values produce fewer state changes.
Group 02, Supertrend Confirmation
Fast Length, default 9, range 2 to 100. ATR length of the fast internal Supertrend.
Fast Factor, default 1.45, range 0.25 to 10.0. Base ATR multiplier of the fast internal Supertrend before adaptive widening.
Medium Length, default 14, range 2 to 150. ATR length of the medium internal Supertrend.
Medium Factor, default 1.95, range 0.25 to 10.0. Base ATR multiplier of the medium internal Supertrend.
Slow Length, default 21, range 2 to 200. ATR length of the slow internal Supertrend, acting as the broader continuation confirmation.
Slow Factor, default 2.55, range 0.25 to 10.0. Base ATR multiplier of the slow internal Supertrend.
Group 03, Overlay
Overlay, default Trail, options Trail, Bands, None. Selects which overlay geometry is drawn, or hides both.
Width, default 1.00, range 0.40 to 2.50. Scales the distance of all trail layers and all band levels from the baseline. Because the internal simulation uses the outer trail layer as its stop, this input also changes the Data Window statistics. It does not affect the trend engine.
Smoothness, default 5, range 1 to 20. Smooths the baseline and ATR used to build the overlay geometry, and is applied a second time to those already-smoothed values when Bands mode is selected. Because the outer trail layer is built from these smoothed values, this input also changes the Data Window statistics. It does not affect the trend engine.
Group 04, Valuation
Meter Size, default Normal, options Off, Compact, Normal, Large. Controls whether the meter is shown and how many segments it uses.
Position, default Top Center, options Top Left, Top Center, Top Right, Bottom Left, Bottom Center, Bottom Right.
How It Works
The baseline is an EMA of close over the Trend Length. ATR(14) is the volatility unit and is floored at one tick to avoid division problems on illiquid data.
Directional efficiency is the absolute 10-bar net price change divided by the sum of the absolute bar-to-bar changes over the same window, clamped between 0 and 1. Chop is one minus that value. Efficiency is signed by the 10-bar direction to form the efficiency field.
Volatility regime compares current ATR to its 50-period EMA. Expansion is the amount above one, clamped to 1.25. Deviation is the absolute distance from one, clamped to 1.50.
The three Supertrend factors are the user's base values plus a chop term and a volatility expansion term. Their directions become bullish or bearish votes. The vote requirement is two of three normally and three of three when chop exceeds 0.70, and the confirmed vote must persist for one confirmed bar, or two when chop exceeds 0.72.
Nine fields are then blended. Distance from baseline and momentum are divided by ATR and clamped. Baseline slope and slow baseline slope are three-bar changes divided by ATR and clamped. RSI(14) is centered on 50 and clamped. The Supertrend field is the vote difference divided by three. Candle pressure combines body direction and close location within the bar. Structure is plus one when close breaks the prior N-bar high and minus one when it breaks the prior N-bar low. The weighted sum is smoothed with a 3-period EMA to produce the regime value.
The gate is 0.22 plus selectivity times 0.12, plus chop times 0.085, plus a volatility deviation term capped at 0.06. A bullish candidate exists when the regime exceeds the gate, close is above the baseline by the required ATR displacement, momentum is positive beyond its deadband, and the bullish Supertrend consensus is persistent. The bearish candidate is the mirror.
A candidate must persist for one bar in high-efficiency conditions, two when chop exceeds 0.40, and three when chop exceeds 0.72. The strong-move path can bypass that candidate persistence requirement and the cooldown, but only when all three Supertrends agree, the regime clears the gate by an additional 0.26, momentum exceeds 0.16 in absolute terms and efficiency is above 0.42. Because the strong-move path is itself built on the candidate condition, it does not bypass the Supertrend persistence requirement. It is intended to provide a faster response when directional evidence is unusually strong under the script's own measurements.
Before any flip is accepted, the takeover rule requires the fast Supertrend and at least one of the medium or slow Supertrends to be aligned with the new direction. A cooldown of six bars plus up to four additional bars scaled by chop must also have elapsed since the last flip, unless the strong-move path is active. All of this is evaluated on confirmed bars only.
When the state flips, the counters reset, the label prints, the candles recolor and the overlay switches sides. Before the first flip on a chart the state is neutral, candles are yellow, and the trail layers sit flat on the baseline.
The valuation meter takes RSI(14), smooths it with a 3-period EMA, and maps it onto the selected number of segments with a pointer. It is a positioning display for smoothed RSI and nothing more; it does not measure fair value and is not part of the trend decision.
The Data Window values come from a simplified internal historical trade simulation implemented inside the indicator. The script is an indicator, not a TradingView strategy, so these are not Strategy Tester results and no Strategy Tester properties apply. The simulation opens a position at the close of each flip bar and closes it on either an opposite flip or a stop. The stop is set on the entry bar from the outer trail, constrained to at least one minimum tick beyond the entry close, and thereafter can only move in the position's favorable direction using the previous bar's outer trail value. Starting equity is 10000, the full equity is used on every position, a fee equal to 0.1 percent of entry equity is deducted at entry, and a further amount equal to 0.1 percent of that same entry equity is applied at exit. Win rate and profit factor are classified on the fee-inclusive result of each position. The return figure is calculated from equity including unrealized profit or loss on any position still open, so it is not a closed-trade-only figure.
These assumptions are deliberately simplified. The purpose is to compare the effect of different settings against one another on the same symbol, not to model a tradable account. Full-equity sizing is used so the figures are not dependent on an arbitrary position size choice, and no sizing shown here is being recommended. No slippage, spread, funding cost or gap-through-stop execution is modelled, so the simulation does not reproduce actual execution conditions and may differ materially from live trading. There is no take profit and positions are never partially closed. These values describe the script's own historical state changes under those assumptions and are not evidence about future behavior.
How to Use
Add the indicator to a clean chart and read the current state from the candle color and the overlay side. In Trail mode the layers are constructed below the smoothed baseline while the state is bullish and above it while the state is bearish. In Bands mode the three levels on each side show how far price has extended from the baseline in ATR terms.
Increase Signal Selectivity if you are getting more state changes than you want, or increase Trend Length for a slower baseline. Increase the Supertrend factors to require larger moves before the internal confirmation layer will agree. Reduce the factors and lengths for faster and noisier behavior on lower timeframes.
Width and Smoothness do not affect the trend engine, so flips and alerts are identical regardless of their values. Both do change the Data Window statistics, because the stop used by the internal simulation is drawn from the outer trail layer.
The two alerts fire on confirmed bars when the state changes. Treat the Data Window values as a rough comparison tool between settings on the loaded symbol and history, subject to the assumptions listed above.
Limitations to be aware of: because confirmation, persistence, takeover and cooldown conditions must all be satisfied before a state change is accepted, a flip can occur after price has already moved some distance from where the previous state ended. During lower-efficiency conditions the script requires additional Supertrend agreement and additional confirmation bars, which increases that distance further. These mechanisms intentionally prioritize confirmation over earliest possible detection, and that trade-off cannot be removed by settings, only shifted. Values on the current unclosed bar can change until that bar closes, since state changes are only committed on confirmed bars. The chart begins in a neutral state until the first flip is accepted. Behavior varies substantially between symbols and timeframes, and the defaults are a starting point rather than an optimized configuration.
Conclusion
Uptrick: Adaptive Trend Trail derives a trend state from nine weighted measurements rather than a single crossing, and makes the strictness of that decision a function of measured directional efficiency and volatility through the chop and volatility terms. The overlay, the trend candles, the valuation meter and the internal simulation are there to make that state and its context readable on one chart. It is a decision-support tool for discretionary trend reading and is intended to be used alongside your own analysis and risk management rather than as a standalone system.
Disclaimer
This indicator is provided for educational and informational purposes only. It is not financial advice and does not constitute a recommendation to buy or sell any instrument. All trading involves risk and can result in substantial losses. Leveraged products can involve additional risks that depend on the instrument, broker and account structure. Past behavior of this indicator, including any statistics it displays, does not predict or guarantee future results. Signals, statistics and visuals vary across symbols, timeframes and market conditions. You are solely responsible for your own trading decisions and should test any tool thoroughly and apply your own risk management before using it with real capital. 指标

VWAP Rope Band by ByblloVWAP Rope Band plots a smoothed trend line (the "rope") that only moves once price has traveled beyond a VWAP-deviation threshold from its last position - small back-and-forth noise around VWAP is absorbed, and the line only steps when a move is statistically meaningful.
The threshold is the standard deviation of (close - VWAP) over a lookback period, scaled by a multiplier, so the surrounding band automatically widens or narrows with how far price is currently dispersing from VWAP - no manual adjustment needed as volatility changes.
A genuine trend reversal is only registered once the rope actually reverses direction (not on every VWAP wiggle). That short transition window gets its own color, an optional gradient cloud, and an optional Buy/Sell badge at the exact bar the reversal is confirmed.
INTENDED USE
Works well for short-term futures scalping - Nasdaq futures, KOSPI200 futures, and similar instruments. Built and tested primarily on the 1-minute chart, but the underlying VWAP/rope/band logic is timeframe-agnostic and holds up well on 2, 3, and 5-minute charts and other intraday timeframes too. The StdDev Length and Band Multiplier adapt to volatility automatically, but it's worth rechecking them when you switch timeframe or instrument.
FEATURES
- Threshold-based "rope" trend line that ignores VWAP noise, only stepping on statistically meaningful deviations
- Volatility-adaptive band (self-widening/narrowing standard-deviation envelope around the rope)
- True-gradient cloud fill between rope and band, with adjustable steepness
- Confirmed-reversal transition detection with its own color/cloud, auto-expiring after 5 bars if unresolved
- Optional Buy/Sell badge plotted at the exact bar a reversal is confirmed
- Two alert families: simple rope crossover/crossunder, and confirmed Buy/Sell signal alerts
- Works on any chart type (candlestick, Heikin Ashi, Renko, etc.) since prices are pulled via request.security() from the underlying ticker
This is a visual/alerting tool only - it does not place real orders. For educational and informational purposes only, not financial advice. Always verify how the rope and bands behave on your specific symbol and timeframe before relying on them for live trading. 指标

Return Dispersion Matrix [The Quant Science]Introduction
The Return Dispersion Matrix is a quantitative analysis tool that maps the temporal dependence of returns. In technical terms, performs a two-dimensional, 1-lag autocorrelation analysis, measuring the relationship and relative frequency between the return of the previous session (Yesterday) and that of the current session (Today) within specific volatility ranges.
It answers the key questions:
💭 🔑 “When a candle closes in the green or red, what is the most common range of returns?”
💭 🔑 “When the price did X yesterday, what does it probably do today?”
What does this indicator do?
1. Automatically calculate the probability of future returns for a given range of values and display the result in the right-hand column.
2. Instantly identify the market trend using the quadrants. Calculates the quadrant with the highest number of points and highlights it by lighting it up.
🟢 Q1
A green candle followed by another green candle
High concentration of points indicates that positive days tend to generate immediate additional momentum
Suitable for trend-following and bullish breakout strategies
🟢 Q2
A red candle followed by a green candle
Heavy trading volume indicates a “resilient” market: buyers step in immediately when prices fall (“buy the dip”)
Suitable for accumulation strategies on pullbacks
🔴 Q3
A red candle followed by another red candle
Indicates that sales generate further sales without immediate support
Sign of underlying weakness or persistent downtrends
🔴 Q4
A green candle followed by a red candle
There are many indications that rallies are short-lived and lead to rapid profit-taking in the Suitable for “sell the rally” strategies
The horizontal X-axis represents the return of the previous candle (t-1), while the vertical Y-axis shows the return of the current candle (t). This allows you to visually determine whether a positive or negative day tends to be followed by one of the same sign (persistence) or the opposite sign (mean reversion).
X-axis
To the right of 0: previous candle closed in positive territory (+)
To the left of 0: previous candle closed in negative territory (-)
Y-axis
Above 0: current candle is closing / has closed in positive territory (+)
Below 0: current candle is closing / has closed in negative territory (-)
3. Automatically calculates volatility bands. It identifies the maximum range observed during the analysis period and divides the positive values into bands. These values are displayed in the left column in white.
4. Automatically calculates frequency clusters. The density and transparency of the points immediately reveal where most sessions are concentrated and which events represent anomalies or extreme outliers.
Uses
Identifying the Market Regime
Observing the concentration of points reveals the prevailing nature of the asset:
Q1 / Q3 Prevalence (Trend / Inertia): The market tends toward continuation. The best strategy is to buy on breakouts or sell on support breaks.
Prevalence of Q2 / Q4 (Mean Reversion): Buying at highs is statistically a losing strategy.
Assessment of Asymmetry and Risk Management (Fat Tails)
By comparing the vertical extent of the points on the positive and negative sides:
If, on the negative side (Q3 / Q4), the points frequently reach the extreme ranges (e.g., -L4 or -L5), while on the positive side they stop at +L2, the asset exhibits asymmetric downside volatility (crash risk). Essential for the correct calculation of position sizing and for the strategic placement of stop-loss orders.
Operational Execution Filter (Probabilistic Edge)
The tool acts as a statistical validator before entering the market:
Example: A trader wants to go long on an asset. The matrix shows that, under current conditions, Quadrant Q2 has a frequency of 45% (high probability that a red day will be followed by a green day). Instead of buying during the positive candle, the trader waits for a negative session to close before placing a buy order at the next opening, thereby maximizing expected return.
Settings
Traders can easily adjust the indicator's parameters using the user interface.
Data Points Visualization: adjust the number of points within the matrix
Matrix Offset: move the table to the right on the graph
Levels Color: set the indicator colors
Highlight Dominant Quadrant: apply automatic calculation of the winning quadrant
指标

Market Bottom Finder [Quantum Algo]Market Bottom Finder
═══════════════════════════════════════════════
🔶 OVERVIEW
Market Bottom Finder is a capitulation detector. It watches for the moment panic selling exhausts itself — the fear spike, the final violent flush, the volume climax, the long rejection wick — and marks that bar as a graded bottom candidate directly on your chart.
The engine is built on the Williams Vix Fix, the classic synthetic fear gauge, and extends it with four additional independent witnesses: an accumulated-stretch pressure integral, momentum-exhaustion analysis, a volume climax filter, and oscillator divergence. The more witnesses agree, the higher the grade — and a five-witness alignment prints as a gold Capitulation marker.
What makes this tool different from every other bottom indicator is accountability: every marker SETTLES. A fixed number of bars after it prints, each marker is recolored by what actually happened — solid if price held above the detected low, faded if it failed. Your chart displays the tool's genuine historical hit rate at all times. No hindsight highlight reel is possible, because the failures stay visible.
═══════════════════════════════════════════════
🔶 WHAT IS A MARKET BOTTOM?
A durable market bottom is rarely a quiet event. It is usually a capitulation: the point where fearful holders finally surrender, selling accelerates into a climax, and the supply of panic sellers runs out. The signature is consistent across markets and decades — a spike in the fear gauge, unusually fast downward movement that suddenly decelerates, climactic volume, and a candle that dives deep and closes far off its low.
This indicator formalizes that signature into measurable conditions and requires several of them to align at once.
═══════════════════════════════════════════════
🔶 WHAT IS THE WILLIAMS VIX FIX?
The Vix Fix, created by Larry Williams, synthesizes a volatility-index-style fear reading from price alone: it measures how far the current low has fallen from the highest close of the recent window. When that distance expands violently, fear is spiking — on any symbol, including those with no options market and no published volatility index.
This script extends the classic gauge with an adaptive threshold: a spike is defined as the gauge exceeding a high percentile of its own recent history, so the definition of "extreme fear" recalibrates automatically to every symbol, timeframe and volatility regime.
═══════════════════════════════════════════════
🔶 WHY IS THIS ORIGINAL?
1. Adaptive fear threshold. Fixed trigger levels fail across symbols; this gauge defines extremity from the symbol's own distribution.
2. Snapback Pressure. An accumulated-stretch integral, inspired by the action-integral form used in physics as a modeling device: the longer and deeper price stays extended below its long-term average, the more the pressure charges toward one hundred percent. A single red candle barely moves it; sustained capitulation charges it fully. Bottoms require charged pressure — depth AND duration, not depth alone.
3. Witness grading. Fear extremity, volume climax, wick rejection, oscillator divergence and high pressure are counted as independent witnesses. Grades are shown as diamonds on every marker; five or more prints a gold Capitulation.
4. Settling markers. Every marker resolves into its real outcome after a fixed window, in public, on the chart. The tool grades its own homework.
5. Two-horizon statistics. The dashboard reports how often detected bottoms held after ten and after thirty bars — computed on your exact chart, shrunk toward neutral at small samples, with Wilson lower bounds available. Each new marker's tooltip quotes the historical hold rate at the moment it prints.
═══════════════════════════════════════════════
🔶 HOW IT WORKS
— The fear gauge is computed each bar and compared against its adaptive percentile threshold; spikes paint a translucent fear wash on the chart.
— Downward momentum is measured in Average True Range units; a bottom requires a genuinely violent arrival that has begun decelerating.
— The pressure integral accumulates while price is stretched below its long-term average and decays quickly once it re-enters.
— When a fear spike, exhausted momentum and charged pressure coincide, a bottom candidate prints and is graded by the remaining witnesses.
— After the settle window, the marker is recolored by outcome, and the ten- and thirty-bar results feed the statistics panel.
All detection happens on confirmed bars. Markers do not repaint; a settled marker never changes again.
═══════════════════════════════════════════════
🔶 HOW TO USE IT
— As a context tool: the fear wash and pressure row tell you when conditions for a durable low are building, before any marker prints.
— As a confirmation layer: combine a Capitulation marker with your own support levels, volume profile or higher-timeframe structure rather than acting on it in isolation.
— Grade discipline: the gold five-plus-witness Capitulations are historically the events worth the most attention; single-diamond bottoms are early warnings, not conclusions.
— Read your chart's own statistics first: the Held rows tell you how this exact symbol and timeframe has responded historically.
— Works on all markets — crypto, stocks, indices, forex — on timeframes from 1H to Weekly. Mirror top detection is available as an optional toggle.
═══════════════════════════════════════════════
🔶 SETTINGS
— Fear Gauge: lookback, adaptive threshold window and percentile, chart wash toggle.
— Bottom Detection: minimum momentum, minimum pressure, volume climax level, cooldown, settle window, markers kept, optional top mirror.
— Statistics: sample cap, minimum samples, shrinkage strength, Wilson z-score.
— Full color and dashboard customization.
═══════════════════════════════════════════════
🔶 ALERTS
— Fear Spike — the gauge crossed its adaptive threshold.
— Bottom Detected — fear, exhaustion and charged pressure aligned.
— Capitulation (Grade A) — five or more witnesses aligned.
— Top Detected — mirror logic, when enabled.
═══════════════════════════════════════════════
🔶 FAQ
Q: Does it repaint?
A: No. Detection uses confirmed bars only, and settled markers are permanent. The settling recolor is the tool honestly reporting an outcome, not a signal changing.
Q: Does it catch every bottom?
A: No, and it is not designed to. It detects capitulation-style bottoms — the panic-flush signature. Slow, quiet rounded bottoms without a fear spike will not qualify. Requiring the full signature is what keeps the marker meaningful.
Q: Why did a marker print and price still went lower?
A: Because no bottom detector is right every time — and this is the only one that shows you exactly how often it is right, on your chart, via the settled markers and the Held statistics. Capitulation events historically cluster near durable lows; they do not guarantee them.
Q: What do the Held percentages mean?
A: The share of past detected bottoms after which price was higher ten and thirty bars later, on the current symbol and timeframe. Small samples are shrunk toward fifty percent so early numbers cannot overstate the edge. They describe history; they are not predictions.
Q: Which settings should I change first?
A: The Fear Spike Percentile (higher = rarer, stronger events) and the Minimum Snapback Pressure (higher = demands more sustained capitulation).
═══════════════════════════════════════════════
🔶 CREDITS
The Vix Fix synthetic fear gauge is by Larry Williams. The Relative Strength Index and Average True Range are by J. Welles Wilder Jr. (1978). The pressure integral follows the action-integral form of Wentzel, Kramers and Brillouin (1926), used strictly as a modeling device. The Wilson score interval is by Edwin B. Wilson (1927). The adaptive threshold, witness grading engine, settling audit, per-symbol statistics and all code in this script are original work — no third-party or open-source script code was reused.
═══════════════════════════════════════════════
🔶 LIMITATIONS
— Capitulation detection identifies panic exhaustion; it cannot identify news-driven regime changes or slow structural declines.
— Statistics describe the current chart's history only; past frequencies never guarantee future outcomes.
— On illiquid symbols, volume-based witnesses are less reliable.
═══════════════════════════════════════════════
🔶 DISCLAIMER
This indicator is a research and charting tool provided for educational purposes. It is not financial advice, and nothing it displays is a recommendation to buy or sell any asset. Trading involves substantial risk of loss. Always do your own analysis and manage risk responsibly. 指标

Vol Premium GaugeIf you sell options, covered calls, puts, condors, whatever, the question is always the same: am I getting paid enough?
Implied vol is what the market thinks will happen. Realized vol is what actually did. The gap between them is the insurance premium sellers collect. When it is fat, great. When it is thin or negative, you are picking up pennies in front of a steamroller.
This applies beyond vanilla options. If you run concentrated liquidity on an automated market maker you are effectively short a straddle, selling gamma in exchange for fees, and the same logic holds: you want to provide liquidity when implied vol is rich relative to realized, because that is when the fees are most likely to outpace the impermanent loss. When the premium is thin you are giving away optionality for very little.
This puts that IV versus RV relationship on your chart.
The IV line pulls a real volatility index, and only a real one: VIX on the S&P, VXN on the Nasdaq, GVZ on gold, OVX on crude, DVOL on bitcoin. The dashboard names the index it used.
If the instrument on your chart has no volatility index of its own, this reports no premium at all. That is deliberate. A premium is the gap between what the market charges and what actually happened, so estimating the first half from the second half measures your own estimator rather than the market. Realized vol still plots in three windows, fast, standard and slow, so you can see whether recent vol is spiking or compressing, and the verdict row reads RV ONLY.
An earlier version scored every non-crypto symbol against VIX, which is the implied vol of the S&P rather than of the stock in front of you. A typical single name realizes well above VIX, so the spread came out negative and it read "cheap" on nearly everything. That is fixed by refusing to guess rather than by guessing better.
The histogram is the spread, IV minus RV. Green when the premium is fat, red when thin. The filled area between the lines makes the relationship obvious at a glance, and price bars colour in the rich and cheap zones so you can read it without switching panes.
The dashboard carries IV Rank and Percentile over the trailing year. High rank plus a fat spread is the sweet spot for selling. Low rank with a thin spread means step aside. The verdict row says it plainly: SELL PREMIUM, AVOID SELLING, or NEUTRAL. Triangles mark state changes.
Implied tends to overstate realized on average, and that structural overpayment is where the money comes from. But it is not constant. Some weeks the spread is wide open, some weeks there is nothing there, and this is for telling the difference quickly.
One caveat that matters: the premium is a condition, not a timing signal. A rich premium can stay rich, and a thin one can persist for weeks. Pair it with a trend or regime read so you are not selling into a move. 指标

Volume with AlertVolume with Alert
DESCRIPTION
Volume with Alert is a lightweight volume indicator built to make abnormal volume spikes easy to spot and to trigger alerts automatically. It plots volume as colored columns, adds an optional volume moving average for visual context, and highlights any bar whose volume meets or exceeds a threshold you define — no manual line-watching required.
WHAT IT'S MADE OF
- Volume histogram: standard up/down colored volume bars.
- Threshold line: a dashed horizontal line at the volume level you set, so you can see at a glance how far current volume is from your alert level.
- Volume moving average: a simple moving average of volume, plotted purely for visual reference — it does not affect the alert.
- Highlight color: any bar with volume greater than or equal to your threshold turns yellow, instantly flagging high-volume bars on the chart.
INPUTS
- "Alert when volume is ≥ to": set your own fixed volume threshold, in the instrument's native volume units. Any bar reaching this value is highlighted and can trigger an alert.
- "Volume moving average length (visual only)": the number of bars used to calculate the moving average line. Purely visual — adjust it to smooth or tighten the average as you like.
HOW TO SET AN ALERT
1. Add the indicator to your chart and set your threshold in the settings.
2. Right-click the chart (or press Alt+A) and choose "Add alert."
3. Under "Condition," select "Vol Alert," then choose "Volume exceeds threshold."
4. Choose "Once Per Bar" to be notified in real time as the bar forms, or "Once Per Bar Close" to wait until the bar closes before alerting.
5. Customize the alert message if needed and save.
NOTES
- The threshold is a fixed value, so tune it per instrument and timeframe — volume scales vary a lot between forex, futures, and stocks.
- The moving average is informational only; it does not gate or influence the alert condition. 指标

Compression Expansion Map [Pineify]Compression Expansion Map
Overview
Compression Expansion Map is a Pine Script v6 volatility lifecycle oscillator. It converts Bollinger and Keltner widths into comparable compression depths, records joint dwell, and confirms release with rising ATR.
Problem Definition
A squeeze flag only asks whether one envelope is inside another. It hides how unusual current narrowness is versus history, whether two volatility measures agree, and whether contraction has persisted. It can call any exit an expansion when width merely normalizes. Fixed thresholds transfer poorly across markets and timeframes because scales and distributions differ.
Design Rationale
Bollinger width uses standard deviation; Keltner width uses ATR. Each is basis-normalized and ranked against its own history. An agreement discount prevents one narrow envelope from creating maximum energy while the other remains broad; dwell separates a brief dip from a mature regime.
“Not compressed” is insufficient. Release must follow minimum dwell, reduce compression at minimum velocity, and show positive ATR slope. This adds lag but filters normalization. Ranks resist outliers, while sacrificing absolute magnitude.
Key Features
Self-normalized Bollinger and Keltner bandwidth percentiles.
Agreement-weighted compression energy with dwell maturity.
Release velocity, ATR slope, and ATR percentile combined into expansion force.
Centered field, DNA, halo, phases, dashboard, and confirmed alerts.
How It Works
Bollinger width is band distance divided by absolute basis; Keltner width is normalized identically. ta.percentrank maps each to 0–100; inversion gives high depth to historically narrow envelopes.
Average depth receives a 0.60-to-1.00 agreement factor based on depth distance. Above threshold, a bar counter starts. Progress toward Minimum Compression Bars raises energy from 75% to 100%, so Primed requires depth and residence.
Release velocity is the one-bar decline in compression; ATR slope compares current ATR with its earlier value. The first confirmed bar outside mature compression must pass both thresholds. Expansion force blends capped velocity, positive slope, and ATR percentile. It persists only while ATR rises and never beyond Maximum Expansion Hold. No future or external data is requested.
How Multiple Indicators Work Together
This is one sequence, not an unrelated blend. Bollinger observes dispersion; Keltner observes true range. Ranks create comparability, agreement prevents domination, and dwell stores persistence. Release velocity measures discharge; ATR slope tests acceleration. DNA lines expose inputs while the hero field and dashboard explain state.
Trading Ideas and Insights
A rising positive field means volatility is unusually compressed versus history. Primed is persistent compression, not direction. The expansion diamond confirms qualified release but cannot predict its direction. Repeated starts without maturity can mark unstable ranges; long dwell followed by weak release can mean normalization. These are contexts, not entry or performance claims.
Unique Aspects
The components are standard; the lifecycle is the contribution. Two normalized depths must agree, compression accumulates residence memory, and expansion requires release from maturity plus range acceleration. The charge/release layout makes order visible. Implementation is independent; no retrieved source was used, reconstructed, translated, or altered.
How to Use
Allow the percentile lookback to warm up.
Read the positive field as compression energy and compare DNA lines for agreement.
Treat Primed as volatility context, not direction.
Use the negative field and confirmed diamond for a qualified release.
Confirm direction, liquidity, execution, and risk independently.
Disable secondary layers for a cleaner view.
Customization
Envelope Length sets the window; multipliers alter raw widths; rank lookback controls context and adaptation.
Compression Threshold controls narrowness, while Minimum Compression Bars adds maturity and lag. Release Velocity controls discharge. ATR Slope settings define acceleration: lower values react faster but admit weaker releases. Maximum Expansion Hold caps persistence. Reevaluate settings across markets and timeframes.
Assumptions and Limitations
History must be representative. Percentiles are relative, both envelopes share price data, and ATR is directionless. Expansion cannot determine breakout direction or continuation.
Live-bar values and phases may change before close; markers and alerts require barstate.isconfirmed . There is no lookahead, negative offset, external symbol, or higher-timeframe request, but the model is lagging and parameter-sensitive. Gaps, illiquidity, regime breaks, and short history reduce usefulness. Orders, fees, slippage, and profitability are outside scope.
Conclusion
Compression Expansion Map replaces a Boolean squeeze with an inspectable lifecycle. Depth measures charge, dwell measures maturity, and qualified release plus ATR acceleration measures expansion without claiming direction or outcomes.
指标

Squeeze AI - Breakout Direction Probability [Dots3Red]🗜️ SQUEEZE AI - BREAKOUT DIRECTION PROBABILITY
A squeeze tells you volatility is loading. It has never told you which way it's going to release. This script fixes that second half of the problem - not by predicting the future, but by remembering the past. Every completed squeeze on your chart becomes a measured data point, and when a new squeeze fires, the script reports what the most similar past squeezes actually did.
✨ WHY THIS MATTERS
Bollinger-inside-Keltner squeeze detection has existed for years, and every version of it does the same thing: flags that a squeeze is happening, then flags that it released. What happens next has always been left to the trader's judgment.
This script keeps score instead. It records the character of every squeeze that completes — how long it ran, how tight it got, what volume and momentum looked like — and pairs that with what price genuinely did afterward. When the next squeeze fires, it doesn't guess; it looks up the most similar squeezes this chart has actually produced and reports their real outcomes.
📊 ▲ 68% | +2.1 ATR | N=34
That reads as: of the 34 most similar past squeezes on this chart, 68% broke upward, averaging a 2.1 ATR move. Measured history, not a formula assuming squeezes behave a certain way.
⚙️ HOW IT WORKS
🗜️ Squeeze detection — the standard definition: Bollinger Bands (mean ± standard deviation) compress fully inside Keltner Channels (mean ± ATR). The moment BB's upper band drops below KC's upper band and BB's lower band rises above KC's lower band, a squeeze is active. A minimum-duration filter discards brief compressions too short to carry real information.
📐 Compression depth — beyond simple on/off, the script tracks how tight the squeeze actually gets: 0% means BB has barely tucked inside KC, approaching 100% means BB has nearly collapsed to a point. This becomes one of the features used for matching, since a shallow squeeze and an extreme one are genuinely different situations.
🧠 The KNN engine — every completed squeeze is stored as five measurements: duration, compression depth, average volume behavior during the squeeze, momentum at release, and volatility context. When it resolves, the actual outcome — direction and distance in ATR — is recorded against those five measurements. A new squeeze is compared against this stored history, and the K most similar past squeezes vote on direction and expected distance.
🔮 Live anticipation — while a squeeze is still compressing, before it even releases, an optional live label shows the KNN's current lean based on the squeeze's characteristics so far. This updates as the compression develops, so you're not waiting for the release to get a read.
🔒 Non-repainting — squeeze tracking, firing, and outcome grading all happen only on confirmed bars. The live anticipation label is explicitly a live-state readout (clearly distinguished from the historical fire labels) and is deleted and redrawn each update rather than left as a permanent mark.
🧭 HOW TO USE
1️⃣ Wait for the sample count. Early on a fresh chart, fire labels will show "Training… (4/12)" instead of a probability. The engine needs a real base of completed squeezes before its reads mean anything — don't trust a probability built on a handful of samples.
2️⃣ Read the N, not just the percentage. "▲ 68% | N=34" is a meaningfully different statement than "▲ 68% | N=8" — the first is a real pattern, the second could easily be noise. The script always shows N specifically so you can judge that yourself.
3️⃣ Watch the live anticipation label as the squeeze develops. A squeeze's characteristics (duration, compression, volume) can shift the KNN lean while it's still compressing — the live label lets you see that lean forming before release, not just after.
4️⃣ Check the dashboard's global stat for chart-level context. Beyond any single squeeze, the dashboard tracks what percentage of every recorded squeeze on this chart broke upward overall — useful context for whether this instrument has had a directional bias in its squeeze behavior.
5️⃣ Tune the minimum squeeze duration to the timeframe. A 4-bar minimum on a daily chart and a 4-bar minimum on a 1-minute chart represent very different amounts of real compression — adjust it to the timeframe you're actually trading.
🛠️ SETTINGS
🗜️ Squeeze Detection
• BB Length / Multiplier, KC Length / Multiplier — standard Bollinger and Keltner parameters
• Min Squeeze Duration — shortest compression the script will bother recording
📊 KNN Engine
• Outcome Window — bars after release over which direction and distance are measured
• K Neighbors — how many similar past squeezes vote on the current one
• Max / Min Training Samples — memory cap and the minimum before probabilities display
• ATR Baseline Period — the volatility-context window used in matching
🎨 Visualization
• Fill between BB — boolean to control area fill
• Squeeze Background Tint, Squeeze Zone Box — two independent ways to mark the active compression, usable together or separately
• Fire Labels with Probability — the KNN readout shown on release
• Live Anticipation Label — the developing-squeeze readout described above
🖥️ Dashboard
• Show/hide, position — current squeeze state and duration, compression %, live KNN read, and chart-wide sample totals
EXAMPLE (area fill between BB bands)
📝 NOTES
Squeeze frequency varies enormously by instrument and timeframe — a fast-moving asset will accumulate the sample count needed for meaningful probabilities much faster than a slow one. On a new chart, expect several squeezes to pass before the KNN read becomes genuinely informative rather than a placeholder.
⚠️ DISCLAIMER
This is an analytical and visualization tool. It does not generate trade signals and does not constitute financial advice. Historical squeeze outcomes do not guarantee how any future squeeze will resolve. 指标

Volatility Regime Breakout [Squeeze + ATR + Trend + PreAlert]Volatility Regime Breakout
A hybrid indicator combining three layers of confirmation to detect the birth of high-volatility regimes and filter out low-quality entries in sideways markets.
How it works:
🔹 Squeeze (BB vs KC): detects when Bollinger Bands compress inside Keltner Channels — a low-volatility phase that historically precedes strong directional moves.
🔹 Pre-Alert: before the release, the indicator measures whether the compression is accelerating (band-width contraction) to give you early warning (purple background + ⚠ icon) that an entry may be developing — this is not an entry signal, it's an early heads-up.
🔹 Expansion confirmation (ATR Ratio): on squeeze release, the script requires the ATR to be genuinely expanding relative to its baseline, filtering out false breakouts with no real range/momentum behind them.
🔹 Trend direction (EMA + slope): only generates a buy/sell signal when the breakout aligns with the underlying trend direction, avoiding counter-trend entries on the first impulse.
Includes:
Three distinct background states: normal squeeze, pre-alert, confirmed breakout
BUY/SELL signals on bar close only (no repainting)
Suggested Stop Loss / Take Profit levels based on ATR (visual reference only, not automatic execution)
Independent, configurable alerts for pre-alert and confirmed entry, with custom messages
All sensitivity parameters are adjustable from the settings panel
Recommended for: BTC and high-volatility crypto assets, 1h timeframe and above to reduce noise.
⚠️ This script is a technical analysis tool, not an automated trading system or financial advice. SL/TP levels are for reference only. We recommend validating the logic through your own backtesting before using it on a live account, and always applying proper risk management. 指标

Precedent [ThrowMaster]===============================================================
WHAT IT IS
===============================================================
Precedent does not predict. It measures.
Every time a defined market event confirms on your chart, Precedent
records what price actually did over the following N bars. Once enough
comparable records have accumulated, it displays the empirical
distribution of those recorded outcomes: how far price travelled, how
often it reached a given distance, and how many bars that took.
The question it answers is narrow and deliberately so:
"On this symbol, on this timeframe, when this kind of event happened
at this kind of price level in this kind of market condition, what
followed afterwards, and across how many cases?"
Every number shown is measured from the visible history of the chart you
are looking at. Nothing is imported from another market, no outcome
percentages are hard-coded, and no distribution shape is assumed. If the
chart has not yet produced enough comparable cases, the indicator stays
silent and tells you how many it has.
This is a context tool. It produces no buy or sell signals, no entry
prices, and no stop levels, and it is not designed to be used as one.
Please read the section titled THE MOST IMPORTANT WARNING before using
it on a live chart.
===============================================================
HOW IT WORKS
===============================================================
1. LEVEL MAP
A running inventory of prices that carry structural meaning is
maintained bar by bar:
- Swing pivots confirmed with a symmetrical left/right lookback
(default 21 bars each side for external structure, 5 for internal).
- Equal highs and equal lows: when a new pivot lands within the merge
tolerance of an existing level, that level's touch count increases
rather than a second level being created.
- Unfilled fair value gaps: a three-bar imbalance where the current
bar's low is above the high from two bars ago (or the mirror for
the bearish case). Each additional gap overlapping the same price
adds to that level's weight, so three gaps stacked at one price
are recorded as one level carrying three factors.
- Order blocks: the extreme of the last opposite-coloured candle
immediately before a displacement bar, where displacement means a
body in the top 15 percent of the last 100 bodies AND the move
takes out the most recent internal pivot. Displacement alone is not
enough; it must be tied to a structural break.
- Previous day and previous week high and low, requested with a
one-bar offset so no unclosed higher-timeframe data is used.
Each level accumulates a WEIGHT equal to the number of independent
factors coinciding there, plus a bonus for repeated touches and for age
beyond 200 bars. Two factors closer together than the merge tolerance
(default 0.25 x ATR) are treated as one level with two factors, never as
two levels. This prevents an order block that naturally sits inside a
fair value gap from being counted twice.
A level whose weight reaches the MAJOR threshold (default 4) is
classified MAJOR; weight 1 to 3 is MINOR; anything else is NONE.
Note on interpretation: a heavily touched level is treated as more
SIGNIFICANT, not as stronger. Repeatedly tested highs and lows are
exactly the prices that attract sweeps. The indicator does not assume
which way that resolves; it measures what actually followed.
2. EVENT CLASSES
Six event types are detected. Every one of them locks its state at bar
close.
SWP Sweep Price trades beyond a mapped level and closes back
inside it, with a wick in the top quartile of the
last 100 wicks on that side.
SHF Shift A close beyond the most recent confirmed external
swing, in either direction (break of structure or
change of character).
SQZ Squeeze Bollinger Bands (20, 2.0) contract entirely inside
Keltner Channels (20, 1.5 x ATR) for at least five
consecutive bars, then expand back out.
CLX Climax Volume in the top 5 percent of the last 200 bars
combined with a bar range in the top 10 percent.
Where volume is unavailable, range plus body size is
used instead and the dashboard states which.
REJ Reject A bullish or bearish engulfing bar, or a pin bar with
a wick in the top quartile of the last 100, but only
when it occurs at a mapped level. A rejection candle
floating in empty space is not recorded at all.
DIV Divergence Price makes a lower low while cumulative flow makes a
higher low, or the mirror case, measured at confirmed
pivots. Flow is signed by body position within the
bar range and scaled by volume where volume exists.
Divergence is measured against volume-weighted flow, not against an
oscillator. An oscillator derived from price and then compared back to
price adds no independent information; volume is a separate data source.
Two events of the same class are never recorded closer together than the
full horizon. This is a deliberate statistical constraint: it costs
sample size, and it buys the guarantee that no two stored outcomes share
an overlapping future.
3. CONTEXT SCORE
Three voices contribute to an additive score from 0 to 100. Nothing
gates. No voice can block a signal; each only adds weight.
STRUCTURE 35 Whether the recent sequence of confirmed swing highs
and lows agrees with the event's direction.
FLOW 30 The percentile rank of the bar's signed flow over the
last 200 bars, cut to one fifth when its sign
disagrees with the event direction.
HTF 35 Whether the higher timeframe close sits above or below
its own 50-period EMA, in agreement with the event.
The score is then discounted by regime and renormalised back to a 0-100
scale, so scores remain comparable across regimes:
RANGE structure x 0.70 (structure breaks constantly and means
little inside a range)
TRANSITION higher tf x 0.80 (higher timeframe bias is least
reliable while it is turning)
TREND flow x 0.85 (large volume is ordinary in a trend
and therefore less informative)
One correction is applied automatically: Climax and Divergence are
themselves defined from flow, so for those two classes the flow weight
is halved and the freed weight is split evenly between structure and
higher timeframe. Without this, the flow voice would confirm an event
that flow itself created.
The score is converted into a two-level tier by comparing it to the 60th
percentile of past scores for the same event class on this chart. There
is no fixed cut-off number.
4. SIGNATURE AND BACKOFF
Each recorded event is filed under a discrete key:
event class x location class x regime x direction x score tier
Direction is never merged at any level, because upward and downward
outcomes are not symmetrical.
When a new event confirms, the engine looks for stored outcomes sharing
that key. If fewer than the minimum sample (default 20) exist, it drops
the finest component and looks again:
L3 event + location + regime + direction + tier
L2 event + location + regime + direction
L1 event + regime + direction
L0 event + direction
The first level with a sufficient sample is used, and the dashboard
always states which level was used and how many records it contained.
If even L0 is short, nothing is drawn and the dashboard shows
CALIBRATING with the current count.
Seeing L1 or L0 rather than L3 is normal, not a fault. Non-overlapping
sampling produces a limited number of independent cases per chart, and
the backoff exists precisely to handle that honestly rather than
displaying a percentage built on four observations.
5. OUTCOME STORE
For each recorded event the engine tracks, for the following H bars
(default 24):
- excursion at H/4, H/2, 3H/4 and H, expressed in R where R is the
ATR(14) value at the event bar
- maximum favourable and maximum adverse excursion
- the bar number at which the move first reached +1R, +2R and +3R,
or zero if it never did
The record is written to the store only after H bars have fully elapsed.
A projection displayed today is therefore built exclusively from events
that had already finished before it was issued. This is a structural
property of the design, not a discipline that has to be maintained.
6. WHAT IS DRAWN
- An empirical quantile fan. The outer envelope traces the 5th and
95th percentiles of the matched outcomes at each of the four
checkpoints; the inner envelope traces the 25th and 75th; the
dashed centre line traces the 50th. The shape is asymmetric and
heavy-tailed whenever the underlying data is, because the values
are measured percentiles rather than a fitted curve.
- A target line. The median maximum favourable excursion of the
matched set is converted to a price, then snapped to a mapped
structural level if one lies within half an ATR. Statistics choose
the zone; structure chooses the exact price. The label states
"level" when a snap occurred and "stat" when it did not.
- Hit rate and expected bars. Both are read at the nearest whole R
ring (+1R, +2R or +3R) to the target distance, and the ring is
named on the label. Hit rate is the share of matched records that
reached that ring within H bars. The bar count is the median
first-passage time among those records that reached it.
7. RUN TRACKER
A run begins at a confirmed structure shift and ends at the next
confirmed shift in the opposite direction. Within a run, occurrences of
each event class and direction are counted. When the run closes, one
record per class is stored: how many had occurred before the reversal.
The observation unit is therefore the run, not the event. This matters:
counting events directly would produce heavily overlapping samples,
since several events inside one run share the same future. Counting runs
does not.
The panel answers a question most tools ignore entirely: given that a
third bearish divergence has now printed in this uptrend, in what
fraction of past runs on this chart did the reversal arrive by the
third, and in what fraction did the run extend to a fourth or beyond.
8. SELF-AUDIT
Every displayed projection resolves into exactly one of four states, and
these are never merged:
HIT the target was reached first
ADV the -1R reference was reached first
AMB both were touched inside the same bar, so the order is
unknowable from bar data and the case is discarded rather
than claimed
EXP H bars elapsed with neither touched
The dashboard reports the running counts, and separately compares the
average hit rate the tool projected against the hit rate it actually
realised. If those two numbers diverge, the tool is telling you its own
estimates are miscalibrated on this chart.
Two further panels report whether the classification axes carry any
information at all: median outcome for tier A versus tier B, and median
outcome for MAJOR versus MINOR versus NONE locations. If a pair does not
separate, that axis is not contributing, and you are meant to see that.
===============================================================
WHAT MAKES IT ORIGINAL
===============================================================
- Outcome statistics are conditioned on a discrete event signature
and computed from the chart's own history, rather than assumed from
a parametric distribution or imported as fixed percentages.
- Projection targets are snapped onto mapped structural levels, so
the displayed price is a real level rather than a quantile value
floating in empty space.
- The hierarchical backoff makes sparse conditioning explicit: the
display always names the level of specificity that was achievable
and the sample size behind it.
- Sequence statistics use the completed run as the observation unit,
which removes the sample overlap that direct event counting creates.
- The indicator scores its own past projections against outcomes and
displays projected versus realised hit rate on the chart.
===============================================================
HOW TO READ THE CHART
===============================================================
HORIZONTAL LINES
The image below shows the level map alone, with the projection layer
switched off, so the two grades of level can be compared directly: gold
solid lines mark MAJOR levels, thin dotted lines mark MINOR ones.
Two families of horizontal line exist, and they are drawn so that they
can never be confused with each other.
THE LEVEL MAP owns thin dotted lines and gold:
Gold, solid, width 2 A MAJOR level: four or more independent
structural factors coincide at this price.
Washed white, DOTTED, A MINOR level: one to three factors.
width 1
THE TARGET FAMILY owns solid width-2 lines in mint, coral and slate.
No target line is ever drawn dotted or at width 1.
Mint, solid, width 2, The target of the live projection.
full opacity Extends to the right. Only one is live at
a time.
Coral, dotted, width 1 The -1R adverse reference of the live
projection. Removed the moment the
projection resolves. This is a measurement
boundary used to classify the outcome. It
is NOT a stop loss and must not be used as
one.
Once a projection resolves, its target line keeps its full width and
stays solid. Only its colour and opacity change:
Mint, faded HIT: price reached it within the horizon.
Coral, faded ADV: price reached the -1R reference
first.
Slate blue-grey, faded EXP or AMB: the horizon elapsed with
neither touched, or both were touched in
the same bar and the case was discarded.
Resolved lines are retained deliberately. A price that the statistics
selected, and that was then snapped onto a structural level, often
remains structurally relevant afterwards, and it is useful to see where
those prices were. The number retained is configurable and defaults to
six.
Read the fade as expiry of a claim, not as expiry of the price. The
faded line is a record that this price was once selected as a target and
of what happened next. It is not a live target and carries no ongoing
claim about the future.
The image below shows several resolved projections on one chart, so the
three outcome colours can be compared side by side: a faded mint line
where price reached the target, a faded coral line where it reached the
adverse reference first, and a faded slate line where the horizon
elapsed without either being touched. The markers carry the matching
three-letter outcome. Projections that did not work out are shown here
deliberately; the indicator records its own failures and so should its
description.
Level lines are redrawn on each new bar and only levels within six ATR
of current price are displayed, up to fourteen at a time.
THE FAN
Outer shaded band 5th to 95th percentile of matched
historical outcomes.
Inner shaded band 25th to 75th percentile.
Dashed centre line 50th percentile, the median path.
Teal the event pointed upward.
Coral the event pointed downward.
The fan is frozen at the moment the projection is issued and is never
recalculated. It reaches forward exactly H bars.
The next image shows a single live projection close up: the two shaded
bands, the dashed median path, the mint target line, and the label
carrying hit rate, sample size and remaining bars. Note that the bands
are not symmetrical around the median, because they are measured
percentiles rather than a fitted curve.
EVENT MARKERS
A small label prints at each recorded event, below the bar for upward
events and above for downward ones. It contains a three-letter code and
a number:
SWP sweep SHF shift SQZ squeeze
CLX climax REJ rejection DIV divergence
The number is the count of that event class and direction so far inside
the current run. "DIV 3" means this is the third divergence of that
direction since the last structure shift.
When a projection resolves, its marker gains a suffix and changes
colour:
HIT green target reached first
ADV red the -1R reference reached first
AMB amber both touched in the same bar; discarded
EXP amber the horizon elapsed with neither touched
THE TARGET LABEL
Three lines at the right end of the projection:
line 1 the target price, followed by "level" if it was snapped onto
a mapped structural level or "stat" if no level was near
line 2 hit rate and sample size, for example: hit 61% n=38
line 3 while the projection is live: bars remaining and the R ring
the hit rate refers to. Once it resolves, this line is
replaced by "RESOLVED" followed by HIT, ADV, AMB or EXP, and
the whole label takes the matching colour.
The bar count was frozen when the projection was issued and only counts
down. Nothing behind it is recalculated.
THE DASHBOARD
EVENT class, direction, and sequence number in this run
LOCATION MAJOR / MINOR / NONE and the level weight
REGIME RANGE / TRANS / TREND, the context score, tier
SIGNATURE backoff level used and sample size
WITH q50 q75 q95 terminal excursion quantiles measured ALONG the
event's own direction, in R
AGAINST q25 q05 the same distribution's tail measured AGAINST the
event's direction, in R
TARGET price and hit rate
ETA bars remaining and the R ring, or "no open
projection"
RUN EXT how far the current run has extended, in R
FLOW SOURCE "volume" or "proxy"
SEQ 1 / 2 / 3 / 4+ share of past completed runs that reversed after
that many events of this class
RUNS median median count before reversal, and number of runs
TIER A / B median outcome in R for each tier, with counts
LOC MAJ/MIN/NONE median outcome in R for each location class
LEDGER running totals of hit, adv, amb and exp
CALIBRATION average projected hit rate against realised
The dashboard is reproduced below at readable size, since every claim
made in the HOW IT WORKS section is meant to be verifiable there: the
backoff level actually used, the sample size behind it, the quantiles,
the sequence distribution, the two axis-health rows, and the running
comparison of projected against realised hit rate.
WITH and AGAINST are measured relative to the event's own direction, not
relative to the chart. For a downward event, a WITH value of +1.4R means
price fell by 1.4 ATR, and an AGAINST value of -1.8R means price rose by
1.8 ATR before the horizon closed. AGAINST is the row that tells you how
violent the route can be, and it is the row most worth reading before
deciding on any position size.
===============================================================
THE MOST IMPORTANT WARNING
===============================================================
DO NOT TREAT THE GREEN LINE AS A TARGET TO TRADE TOWARD, AND DO NOT
TREAT ANY MARKER AS AN ENTRY SIGNAL.
You will observe the following, and it is the single most dangerous
thing about this indicator:
The projection expires. The bars run out. The label reads "closed". And
then, twenty or fifty bars later, price finally reaches the green line.
It is tempting to read that as the tool having been right after all. It
was not, and here is why that reading destroys accounts:
1. The green line is snapped to a structural level. Structural levels
get revisited eventually, because that is what they are. Price
arriving there after the horizon has expired is not evidence of
anything. It is what levels do.
2. The expected bar count is a median of the cases that reached the
ring. By definition, roughly half of the successful cases took
longer than that. "The estimate elapsed and it is not there yet"
is an ordinary outcome, not a malfunction.
3. Route is not measured. The indicator records where price ended up
and how far it travelled. It does not promise that the path there
was survivable. Price can travel far against you first, and still
arrive. The AGAINST row is the only place the route appears at all,
and even there it is a summary, not a guarantee.
A faded line is a closed case. It has no ETA, no live claim and no
implication that price is still heading there. If price later reaches a
faded line, that is not a delayed hit. It is a structural level being
revisited, which is what structural levels do.
That third point is what actually costs money. A leveraged position
opened on the strength of a hit rate can be liquidated by an adverse
excursion long before the target is reached. The account is closed; the
target being reached afterwards is irrelevant to it. This is not a
remote scenario. It is the ordinary case whenever leverage is applied to
a statistic that describes destinations rather than routes.
The -1R red line does not protect you either. It is a measurement
boundary chosen so outcomes can be classified consistently. It is not a
risk parameter and was never sized to be one.
Precedent is a context tool. It tells you what has typically followed
this kind of moment on this chart, with the sample size attached. Entry
timing, position size, stop placement, leverage and the decision to
trade at all remain entirely yours and must come from a method this
indicator does not contain and does not attempt to contain.
If the only thing you take from a projection is "hit 61 percent, so buy"
you have misread it. The intended reading is closer to: "in 38
comparable cases on this chart, price reached this level within 24 bars
in 61 percent of them, taking a median of 9 bars, and the adverse tail
of that distribution ran to -1.8R."
===============================================================
LIMITATIONS AND REPAINT POLICY
===============================================================
REPAINT BEHAVIOUR, ELEMENT BY ELEMENT
- Event detection, tier assignment and score sampling are locked at
bar close. They do not change afterwards.
- Swing pivots confirm with a delay equal to the pivot length in bars
(default 21). A level cannot appear before its pivot is confirmed.
That delay is the cost of not looking ahead, and it is not avoided
anywhere in this script.
- Higher timeframe values are requested with a one-bar offset, so
only completed higher timeframe bars are used. On the chart
timeframe this means the higher timeframe bias lags by one higher
timeframe bar.
- The fan, the target line and the adverse line are computed once, at
the confirmed bar that issued them, and are never recalculated.
- The dashboard and the countdown update live within the forming bar
by design. The countdown only subtracts from a number that was
frozen at issue; no statistic behind it is recomputed.
KNOWN LIMITATIONS
- The statistics are descriptive, not predictive. They summarise what
has already happened on the chart in front of you. They are not a
forecast and are not out-of-sample.
- Sample sizes are small by construction. Requiring non-overlapping
outcomes limits the number of independent cases available, which is
why the backoff and the visible sample counts exist.
- Until enough completed outcomes exist, nothing is drawn at all. The
image below shows that state: the dashboard reports CALIBRATING and
the current count against the required minimum, and no fan, target
or hit rate appears anywhere on the chart.
- Chart history is finite. On low timeframes the available bars may
cover only a matter of weeks, and possibly only one market regime.
Treat a large sample drawn from a single regime with caution.
- Outcomes are measured at bar resolution. When a bar touches both
the target and the adverse reference, the order is unknowable and
the case is marked ambiguous and discarded rather than assumed.
- Statistics apply only to events this indicator itself defined. If
you identify a setup it did not mark, no displayed percentage
describes it. Borrowing a number from a different occasion is a
misuse.
- Where a symbol provides no usable volume, flow falls back to a
body-position proxy on the same percentile scale. The dashboard
states which is in use. Mixing the two would corrupt the store, so
the fallback applies to the whole session or not at all.
- Changing the higher timeframe from Auto to Manual changes what the
signature key means. The stored outcomes are therefore cleared and
rebuilt from zero when you do it. This is intentional.
- Nothing here is tuned. There is no optimiser and no fitted weight.
Thresholds are percentiles over disclosed rolling windows. If a
parameter is changed, the level map and the statistics change with
it, and the sample must accumulate again.
===============================================================
DISCLAIMER
===============================================================
This script is published for educational and analytical purposes. It is
not financial advice, not a recommendation to buy or sell any
instrument, and not a trading system. It produces no entry signals, no
stop levels and no position sizing.
Historical measurement does not indicate future results. Markets change
regime, and a distribution measured on past bars may not describe the
next ones. Trading carries risk of loss, and leveraged trading carries
risk of total loss. Any decision taken while this indicator is on the
chart remains entirely the responsibility of the person taking it.
指标

TRADION Adaptive Momentum MatrixA normalized multi-factor momentum framework combining RSI structure, ROC velocity, MACD impulse and stochastic pressure into a unified -100 to +100 momentum regime model.
────────────────────────────
OVERVIEW
────────────────────────────
TRADION Adaptive Momentum Matrix (AMM) is a composite momentum oscillator designed to evaluate not only the direction of momentum, but also its intensity, acceleration and regime.
Rather than displaying several conventional oscillators independently, AMM transforms four different momentum dimensions into normalized components and combines them into a single bounded Momentum Score ranging from -100 to +100.
The engine integrates:
• RSI Momentum Structure
• Rate of Change (ROC) Velocity
• ATR-Normalized MACD Impulse
• Stochastic Pressure
• Weighted Composite Momentum Scoring
• Multi-Level Momentum Regimes
• Momentum Signal Line
• Compression Detection
• Confirmed-Bar Momentum Transitions
• Six Dedicated Alert Conditions
The objective is to provide a unified interpretation of momentum conditions while preserving the information contributed by different momentum methodologies.
────────────────────────────
COMPOSITE MOMENTUM ARCHITECTURE
────────────────────────────
The core of TRADION AMM is a weighted composite model.
Each momentum component measures a different characteristic of price behavior and is transformed into a normalized range before entering the final calculation.
The four default components are:
RSI Momentum — 30%
ROC Velocity — 25%
MACD Impulse — 25%
Stochastic Pressure — 20%
The component weights are user-adjustable.
The engine automatically normalizes the total weighting, allowing users to modify the relative importance of individual components without requiring the weights to manually sum to 100.
────────────────────────────
1. RSI MOMENTUM STRUCTURE
────────────────────────────
RSI is transformed around its 50 equilibrium level.
Values above 50 contribute positively to the composite momentum model, while values below 50 contribute negatively.
The distance from the 50 level represents the relative intensity of the RSI component.
This allows RSI to function as a normalized directional momentum input rather than simply as an overbought/oversold condition.
────────────────────────────
2. ROC VELOCITY
────────────────────────────
Rate of Change measures the velocity of price movement over the selected lookback period.
Positive ROC contributes to bullish momentum.
Negative ROC contributes to bearish momentum.
Because raw ROC magnitude can vary considerably between instruments and market regimes, the component is normalized using a configurable ROC scale before entering the composite calculation.
────────────────────────────
3. ATR-NORMALIZED MACD IMPULSE
────────────────────────────
The MACD component focuses on impulse rather than the absolute MACD level.
The engine calculates the difference between the MACD line and its signal line and then normalizes this histogram relative to ATR.
This is an important part of the architecture.
A raw MACD histogram value cannot be directly compared across instruments with different price scales and volatility characteristics.
ATR normalization expresses MACD impulse relative to the instrument's current volatility environment before it contributes to the composite score.
────────────────────────────
4. STOCHASTIC PRESSURE
────────────────────────────
The Stochastic component evaluates the position of price within its recent high-low range.
The result is smoothed and transformed around the neutral 50 level.
Values above the midpoint contribute positive pressure, while values below the midpoint contribute negative pressure.
This component adds a shorter-term measure of directional price pressure to the broader momentum framework.
────────────────────────────
THE -100 TO +100 MOMENTUM SCORE
────────────────────────────
After normalization and weighting, the four components are combined into the Adaptive Momentum Score.
The final oscillator is bounded between:
-100 = Maximum bearish momentum classification
0 = Momentum equilibrium
+100 = Maximum bullish momentum classification
The score is not intended to predict a specific future return.
Instead, it measures the degree of directional agreement between the underlying momentum components at the current point in time.
────────────────────────────
MOMENTUM REGIME MODEL
────────────────────────────
Instead of treating momentum as simply positive or negative, TRADION AMM separates the oscillator into multiple regimes.
Default bullish regimes:
+15 to +40
BULLISH
+40 to +70
STRONG BULLISH
+70 to +100
EXTREME BULLISH
Default bearish regimes:
-15 to -40
BEARISH
-40 to -70
STRONG BEARISH
-70 to -100
EXTREME BEARISH
The area between -15 and +15 represents the neutral momentum region.
All major regime thresholds are configurable.
────────────────────────────
ADAPTIVE HISTOGRAM
────────────────────────────
The histogram provides the primary visual representation of the composite Momentum Score.
Its color changes according to the active momentum regime.
Bullish momentum progresses through increasingly stronger green / turquoise classifications as the score rises.
Bearish momentum progresses through increasingly stronger red classifications as the score falls.
The histogram therefore communicates two variables simultaneously:
• Momentum direction
• Momentum intensity
This makes transitions between neutral, directional, strong and extreme momentum regimes immediately visible.
────────────────────────────
MOMENTUM SIGNAL LINE
────────────────────────────
A configurable EMA of the Momentum Score is plotted as a secondary signal line.
This provides a smoothed reference for interpreting changes in the composite oscillator.
The relationship between the Momentum Score and its signal line can help identify:
• Momentum acceleration
• Momentum deceleration
• Changes in short-term impulse
• Potential regime transitions
The signal line can be enabled or disabled from the settings.
────────────────────────────
MOMENTUM ACCELERATION
────────────────────────────
The engine also calculates the bar-to-bar change in the composite Momentum Score.
Positive momentum that continues to increase represents bullish momentum acceleration.
Negative momentum that continues to decrease represents bearish momentum acceleration.
This internal measurement allows the framework to distinguish momentum level from changes in momentum intensity.
────────────────────────────
COMPRESSION ENGINE
────────────────────────────
Markets do not remain in directional momentum regimes continuously.
TRADION AMM therefore includes a Momentum Compression model.
The engine evaluates the standard deviation of the composite Momentum Score over a configurable lookback period.
Compression is identified when:
• Momentum variability falls below the selected threshold
• The composite score remains inside the neutral momentum region
These conditions identify periods where directional momentum has contracted.
Compression does NOT predict the direction of a future breakout.
It simply identifies a low-dispersion momentum environment that may deserve additional attention.
────────────────────────────
CONFIRMED MOMENTUM TRANSITIONS
────────────────────────────
TRADION AMM includes six momentum transition classifications:
BULLISH SHIFT
STRONG BULLISH
EXTREME BULLISH
BEARISH SHIFT
STRONG BEARISH
EXTREME BEARISH
These events are generated when the composite Momentum Score crosses the corresponding regime threshold.
When Confirm Signals At Bar Close is enabled, a transition is accepted only after the current chart bar has been confirmed.
This helps prevent temporary intrabar threshold crossings from being treated as completed momentum transitions.
────────────────────────────
VISUAL REGIME MAP
────────────────────────────
The oscillator panel is divided into visually distinct momentum zones.
This provides a structured map of the current momentum environment:
EXTREME BULLISH
↑
STRONG BULLISH
↑
BULLISH
↑
NEUTRAL / COMPRESSION
↓
BEARISH
↓
STRONG BEARISH
↓
EXTREME BEARISH
The visual design is intended to make changes in momentum regime readable without requiring constant interpretation of individual indicator values.
────────────────────────────
USER CONTROLS
────────────────────────────
Momentum Engine:
• Source
• RSI Period
• ROC Period
• MACD Fast Length
• MACD Slow Length
• MACD Signal Length
• Stochastic Period
• Stochastic Smoothing
Component Weights:
• RSI Weight
• ROC Weight
• MACD Weight
• Stochastic Weight
Normalization:
• ROC Normalization Scale
• MACD ATR Normalization Period
• MACD Normalization Sensitivity
Momentum Regimes:
• Bullish Threshold
• Strong Threshold
• Extreme Threshold
Signal Engine:
• Momentum Signal Length
• Show Momentum Shift Signals
• Confirm Signals At Bar Close
Compression:
• Compression Lookback
• Compression Threshold
• Highlight Compression
Visual Settings:
• Show Momentum Histogram
• Show Signal Line
• Show Regime Zones
────────────────────────────
ALERT SYSTEM
────────────────────────────
Six dedicated TradingView alert conditions are included:
• TRADION BULLISH SHIFT
• TRADION STRONG BULLISH
• TRADION EXTREME BULLISH
• TRADION BEARISH SHIFT
• TRADION STRONG BEARISH
• TRADION EXTREME BEARISH
Each momentum classification can therefore be monitored independently.
────────────────────────────
PRACTICAL INTERPRETATION
────────────────────────────
TRADION Adaptive Momentum Matrix can be used as:
• A composite momentum oscillator
• A momentum regime classifier
• A momentum-strength confirmation layer
• A momentum acceleration/deceleration reference
• A compression detection framework
• A confirmation tool alongside independent trend analysis
• An alert-based momentum monitoring system
For example, a positive Momentum Score does not automatically imply that momentum is strong.
The regime model distinguishes between ordinary bullish momentum, strong bullish momentum and extreme bullish momentum.
The same principle applies to bearish conditions.
This distinction is central to the design of the indicator.
────────────────────────────
DESIGN PHILOSOPHY
────────────────────────────
Momentum is multidimensional.
RSI measures momentum differently from ROC.
ROC measures velocity differently from MACD impulse.
Stochastic positioning provides different information from all three.
TRADION Adaptive Momentum Matrix does not attempt to replace these concepts with a single conventional oscillator.
Instead, it asks a broader question:
How strongly do multiple independent momentum measurements agree on the current directional state?
The individual components are normalized, weighted and aggregated into a common -100 to +100 framework.
The resulting Momentum Score is then classified into structured regimes, allowing direction and intensity to be interpreted within the same analytical model.
────────────────────────────
IMPORTANT NOTES
────────────────────────────
TRADION Adaptive Momentum Matrix is an analytical oscillator, not a trading strategy or prediction system.
BULLISH, STRONG BULLISH, EXTREME BULLISH, BEARISH, STRONG BEARISH and EXTREME BEARISH classifications describe conditions calculated by the indicator.
They do not guarantee future price direction, profitability or trade outcomes.
EXTREME momentum should not automatically be interpreted as a reversal condition.
Strong momentum can remain elevated or depressed for extended periods during directional markets.
Similarly, Momentum Compression does not predict the direction or timing of a future breakout.
Confirmed-bar processing can reduce temporary intrabar signals, but it does not eliminate market risk, signal lag or false transitions.
Users should evaluate the indicator within their own analytical framework and apply appropriate risk management.
For research and educational purposes. 指标

Regime CompassMost traders take the same setup in a March 2020 crash as they would in a quiet summer drift, then wonder why results are all over the place.
Regimes change everything. A breakout that prints in low-vol trends gets chopped up in a crisis. I've learned the hard way that knowing where you stand before putting on risk matters as much as the entry signal itself.
This indicator classifies the current environment into four states: RISK-ON, NEUTRAL, RISK-OFF, CRISIS.
It blends three things:
Volatility (40% of the score). Reads VIX for equities or DVOL for crypto, falling back to a realized
vol percentile ranking when neither is on the chart. It also tracks whether vol is speeding up or
slowing down against its own longer-term average. A calm market getting choppy fast is a completely different animal to one that has been volatile for months and is starting to settle.
Trend (35%). Price against short, medium and long-term moving averages. Not calling direction, just asking whether the structure underneath is holding up or falling apart.
Momentum (25%). RSI and rate-of-change percentile over the trailing year. Captures whether we are at an extreme or not.
These blend into a single composite, lightly smoothed so the label does not flip every bar. On the chart you get a colour-coded oscillator, optional background shading so the regime state is visible at a glance, and a dashboard table breaking out each sub-score, fast realized vol, and the live VIX or DVOL read. Alerts fire on regime transitions.
It auto-detects crypto against equity and adjusts annualization accordingly. All thresholds and
lookbacks are in the settings.
I built this because regime awareness is the first filter I run on any trade. Options selling, systematic work, deciding when to lean in or step back. That question always comes first. 指标

Break quality: level breaks read against candle structureTwo bars can close in exactly the same place after taking out a recent high. One is buyers absorbing supply. The other is a trap. This reads the bar that did the breaking to tell them apart.
What it does
It watches the highest high and lowest low of the last few bars. When price closes beyond one of them, that is a break, and the script then asks two questions about the bar that produced it: did enough volume show up, and did the bar's own shape agree with the direction it just moved.
A break on strong volume with nothing contradicting it is marked as supported. A break on thin volume is marked as unconfirmed. A break where the same bar printed a reversal pattern pointing the other way is marked as contradicted, in its own colour, because that is the case worth stopping on.
Why these things are in one script
This is not a breakout tool and a pattern scanner merged for convenience. They were two separate scripts and the reason for combining them is that neither answers the question on its own.
A break is a liquidity event. Price trades through a level where resting orders sat, those orders get filled, and the close tells you the level was crossed. It does not tell you who did the crossing or whether they intend to stay. Continuation and a stop run produce the same closing price.
What separates them is visible on the breaking bar itself. Continuation looks like a decisive body with participation behind it. A trap looks like a long rejection wick, or an engulfing bar in the opposite direction, printed on volume that never arrived. That evidence exists for exactly one bar, at exactly one location, and scanning for it independently across the whole chart produces hundreds of marks that have nothing to do with any level.
So the candle structure here is subordinate to the break. It is not reported unless a level was taken. That subordination is the entire design, and it is why this is one script and not two.
There is also a plain engineering reason. Both halves needed relative volume against the same average, and as separate indicators that average was computed twice from identical data on every bar. Here it is computed once and both readings share it.
How it works
The level is the highest high or lowest low of the prior bars, deliberately excluding the current one. Including it would let the level move with the bar trying to break it, and nothing could ever exceed it.
A break is a close beyond that level. In a trending market a new high is set on almost every bar, so only the first break of a run is treated as an event, and a spacing setting stops a strong trend from covering the chart in labels. Bar colouring stays continuous through the run, so you still see the whole move.
Volume is compared to its own moving average. At or above the strong threshold the break is treated as participated; below one times average it is treated as thin.
The candle structure read covers engulfing, hammer and shooting star, piercing and dark cloud, harami, and harami cross. Each family has its own toggle. A shape pointing against the break direction is what triggers the contradicted reading. The doji used by the harami cross is defined by a body no larger than a set fraction of the bar's range, and that fraction is a setting rather than a hidden constant.
The broken level is drawn forward as a dashed line and removed when price trades back to it, because a level that has been revisited has stopped being a reference.
Everything confirms on bar close by default.
How to use it
Works on any symbol and timeframe that reports volume.
The reading to act on is not the break itself but the label under it. Supported, unconfirmed and contradicted are three different situations that look identical if you only watch price close beyond a line.
Contradicted breaks are the reason the script exists. A break that prints a reversal shape on its own bar is not automatically a fade, but it is a break that has not yet proven anything, and treating it identically to a supported one is how breakout traders get taken apart.
Raise the lookback for fewer and more significant levels. Raise the spacing setting if a trending instrument is still producing too many marks. Turn the structure read off entirely and it becomes a plain break-and-volume tool with nothing else changed.
What it cannot do
A contradicted break is a description of one bar, not a forecast. Some traps reverse immediately and some run for days before they do. The label says the evidence on that bar conflicts, and nothing more.
Candlestick patterns are shape definitions with no universally agreed thresholds. The definitions used here are listed above so you can check them against your own rather than trust mine. Piercing and dark cloud are implemented in the strict form requiring a genuine gap beyond the prior bar's extreme, which means they fire rarely on intraday charts where gaps are uncommon.
The level is a recent high or low and nothing more. It carries no weight from prior sessions, no volume profile, no higher timeframe context. A five-bar high on a quiet afternoon and a five-bar high at a weekly extreme are treated identically.
There are no entries, exits, targets or stops in this script, and no performance of any kind is claimed, measured or implied.
On authorship
Swing breakouts, relative volume and the classic candlestick reversal patterns are all public methodology and I have said so plainly. The implementation is not borrowed. Every line is written from scratch and no code in it is copied or adapted from another author's script, on this platform or anywhere else.
Settings
Lookback for the level, confirm-on-close and minimum spacing between marked breaks; volume average length and the strong-participation multiple; a master switch for the structure read plus a toggle per pattern family and the doji body fraction; and display options for the level lines, labels, plotted levels, bar colouring, label size and colours.
指标

Elite CVD: volume delta with directional wick attributionA cumulative volume delta that attributes wick volume directionally instead of splitting every bar down the middle, with all three proxy models exposed so you can compare them yourself.
What it does
Volume delta estimates how much of a bar's volume was buyer-initiated versus seller-initiated, then accumulates the difference into a running total. When that total rises while price stalls, buyers are absorbing supply. When it falls while price grinds higher, the advance is not being paid for. This plots that total, colours each bar's contribution by whether the pressure is building or fading, marks unusually heavy volume, and flags divergences between the total and price.
What is different here
Cumulative volume delta is a public idea with many open-source implementations on this platform, and I claim no ownership of it. What differs is how the volume gets attributed.
Almost every delta proxy splits a bar by where the close sits within the range. That treats both wicks as neutral, which is a choice, and usually an unexamined one. It says the volume in a long lower wick carries the same meaning as volume in a long upper wick.
This one reads wicks directionally. On an up bar, the lower wick is treated as selling that buyers absorbed and overcame, so most of that volume is credited to buyers, while the upper wick is treated as rejection and mostly credited to sellers. On a down bar the reading inverts. The split is 75/25 rather than 50/50, and the body always goes to the direction the bar closed.
Whether that assumption is better than the neutral one is something you should decide rather than take on faith, so the classic model, the directional model, and an average of the two are all selectable from one dropdown. Switch between them on your own instrument and see whether the difference matters. If it does not, use the classic one.
How the parts work together
Four components share one job, which is why they sit in one script rather than four.
The delta engine produces the per-bar reading. The relative-volume layer scales that reading by how heavy the bar was against its own recent average, using a square root so a four-times-volume bar counts double rather than quadruple. That matters because a large delta on thin volume is noise and a moderate delta on heavy volume is participation, and an unweighted total treats them as equal.
The acceleration colouring compares each bar's delta to its own reading a few bars back and dims the histogram when pressure is fading. Pressure that is still positive but decelerating is the condition that precedes most reversals in this kind of data, and a plain two-colour histogram hides it entirely.
The divergence layer compares confirmed price pivots against the delta total at those same bars. Divergences are confirmed rather than live: they appear only once the pivot's right-hand bars have elapsed, so they will always print a few bars after the turn.
How to use it
Built for intraday work on futures, and it functions on any symbol that reports volume.
Start with the reset mode. Session reset gives you the day's accumulated pressure and is the right default for intraday trading. Fixed length gives a rolling window. Running never resets and is only useful over short chart histories.
Read the relationship rather than the level. The absolute number means little on its own, since it depends on how long the total has been accumulating. What carries information is the direction of the total relative to price, whether it sits above or below its signal line, and whether the per-bar contribution is brightening or dimming.
The table reports the current bar's buy and sell split, the bar delta with an acceleration marker, the running total and which reset mode produced it, the signal-line relationship, relative volume, and raw volume.
What it cannot do
This is a proxy and not real order flow. It infers the aggressor side from the shape of the bar. It has no access to bid and ask data, no tick data, and no exchange-reported delta. On any instrument where true delta is available to you, the true delta is better and you should use that instead.
The directional wick reading is an assumption about intent, not a measurement. It is defensible and it is still an assumption, which is why the neutral model remains available.
With relative-volume weighting switched on, the running total is no longer in contracts or shares, because each bar is scaled before being added. The shape of the line stays comparable across time; the units do not. Turn the weighting off if you need the axis to be literal.
The session reset follows the exchange's own daily session, so on futures it resets at the futures open rather than the equity open. That is correct for a futures instrument and worth knowing if you apply the script elsewhere.
Divergences are confirmed, which means late by design. They describe a turn that has already formed. They are not predictions and no claim is made about how often they resolve favourably.
On authorship
Cumulative volume delta, relative volume and pivot divergence are all public methodology and I have said so plainly. The implementation is not borrowed. Every line is written from scratch and no code in it is copied or adapted from another author's script, on this platform or anywhere else.
Settings
Proxy model selection; reset mode with a fixed-length option, signal line length and type; display mode for line, histogram or both, acceleration colouring and its lookback, and the zero fill; relative-volume weighting with its average length, type and spike threshold; divergence toggle with pivot left and right bars; and table position, size and colours.
指标

Squeeze Pro [StrixEDGE]📊 WHAT IT DOES
StrixEDGE Squeeze Pro detects when Bollinger Bands contract inside Keltner Channels — a condition known as the "squeeze" — indicating extremely low volatility that typically precedes explosive moves. It measures squeeze intensity across three levels and uses MACD momentum to predict the breakout direction.
🔬 WHY IT'S DIFFERENT
Standard squeeze indicators show only ON/OFF. This version introduces three intensity levels: the tighter the Bollinger Bands compress inside Keltner Channels, the more powerful the expected breakout. Level 3 (extreme) squeezes historically produce the largest moves. Additionally, a real-time statistics table shows squeeze frequency, average duration, directional bias, and average post-squeeze move size for the current chart.
⚙️ HOW IT WORKS
The indicator calculates Bollinger Band width relative to Keltner Channel width. When BB fits inside KC, a squeeze is active. The ratio between their widths determines intensity:
• Level 1 (yellow dots): Light compression, ratio 0.8-1.0
• Level 2 (orange dots): Medium compression, ratio 0.5-0.8
• Level 3 (red dots): Extreme compression, ratio below 0.5
A four-color MACD momentum histogram shows breakout direction:
• Dark green = bullish accelerating, Light green = bullish fading
• Light red = bearish fading, Dark red = bearish accelerating
📈 HOW TO USE
• Wait for red/orange squeeze dots (Level 2-3) to accumulate
• When dots turn green (squeeze fires), enter in the histogram's direction
• Dark green histogram bars after squeeze = LONG entry
• Dark red histogram bars after squeeze = SHORT entry
• Level 3 squeezes produce the most reliable and powerful breakouts
• Use the stats table to understand squeeze behavior on your specific chart/timeframe
🎛️ INPUTS & DEFAULTS
BB: 20 period, 2.0 multiplier | KC: 20 period, 1.5 multiplier
MACD: 12/26/9 | Stats Lookback: 200 bars
All fully customizable.
═══════════════════════════════════════════════════════
🔧 CUSTOMIZATION
All parameters are fully adjustable through the indicator settings panel. Inputs are grouped logically:
• ⚙️ Core Parameters — main calculation settings
• 📊 Table Settings — table size (Tiny to Huge), position (4 corners), visibility toggle
• 🎨 Visual Settings — colors, show/hide elements
• 🔔 Alert Settings — threshold values for notifications
📊 DATA TABLE
A built-in data table displays all key metrics in real-time. Adjust the table size from Tiny to Huge to match your chart layout. Position it in any corner. Toggle visibility on/off.
🔔 ALERTS
Pre-built alert conditions for all major signals. Set up alerts via TradingView's alert dialog — select this indicator and choose from the available conditions.
⏱️ RECOMMENDED TIMEFRAMES
Works on all timeframes. Recommended: 1H, 4H, Daily for best signal quality. Lower timeframes produce more signals but with higher noise. Weekly/Monthly for position trading context.
✅ COMPLIANCE
• No repainting — all signals based on confirmed bar close data
• No future data references
• Open-source code — verify the logic yourself
⚠️ DISCLAIMER
This indicator is a technical analysis tool, not financial advice. It does not predict future price movements. Past patterns and signals do not guarantee future results. Trading involves substantial risk of loss. Always use proper risk management, including stop losses and appropriate position sizing. Never risk more than you can afford to lose. 指标

指标

ATK/DEF MTF Regime Combo Day StructureATK/DEF MTF Regime Combo Day — Structure is a multi-timeframe market observation and regime analysis framework built around higher-timeframe market structure and a multi-layer decision-transfer architecture.
Unlike conventional indicator combinations that display several independent readings side by, this framework processes multiple market dimensions through a structured calculation hierary. Individual observations are transformed into factor scores, factor scores are combined into analytical modules, and the module results are then integrated into a composite market-state output.
The core concept is:
MTF Framework → Multi-Dimensional Analysis → Decision Transfer → Module State → Composite Score → Market Observation**
MTF Regime Framework
The MTF concept forms the upper analytical layer of the framework.
Rather than trating multi-timeframe analysis simply as a collection of separate timeframe readis, the higher-timeframe context is used as the structural environment in which the underlying market information is evaluated.
This allows price behavior, momentum, volatility, volume flow, structural pressure and market activity to be processed within a unified higher-timeframe framework.
The purpose is to provide a faster and more structured view of the market environment represented by the selected timeframe.
Decision-Transfer Architecture
The defining feature of the indicator is its decision-transfer structure.
Raw market information is not dictly converted into a final output. Instead, information paes through several analytical layers:
**Market Data**
→ **Individual Factors**
→ **Factor Scores**
→ **Analytical Modules**
→ **Module States**
→ **Composite Result**
This creates a hierchical analytical structure in which lower-level observations contribute to higher-level state calculations.
The resulting output therefore represents the combined relationship between multiple market dimensions rather than the readg of a single conventional indicator.
C1 — Direction / Momentum / Accumulation / Flow
C1 evaluates the underlying market condition through four dimensions:
* **Direction** — moving-average relationship, price position and directional movement.
* **Momentum** — RSI behavior and recent price change.
* **Accumulation** — price compression, Bollinger Band width and contraction conditions.
* **Flow** — CMF and MFI-based price-volume flow characteristics.
These components are individually scored and then combined into the C1 composite state.
C2 — Density / Breakdown / Vortex / Resistance
C2 focuses on structural price behavior and market positioning:
* **Density** — price-range density and relative volume activity.
* **Breakdown** — interaction with recent high and low ranges, including breakout and testing conditions.
* **Vortex** — candle body, upper/lower shadows and relative range behavior.
* **Resistance** — proxiity to recent structural high and low areas and repeated te behavior.
C2 combines these dimensions into a structural state representation.
### C3 — Radar / Frequency / Chaos / Tra
C3 focuses on price-action characteristics and changing market conditions:
* **Radar** — selected candle and price-action structures.
* **Frequency** — relative range activity and volume participation.
* **Chaos** — directional change frequency together with ADX-based market conditions.
* **Tra** — abnormal range interaction, faild breakout structures and wak breakout conditions.
C3 provides an additional layer for observing changes in market activity and price behavior.
Composite Scoring
Each factor is converted into a normalized score.
The individual factors are aggregated into C1, C2 and C3 module scores. The three module scores are subsequently combined into a Total Score.
The resulting score is classified into five grades:
**A — High State**
**B — Elevated State**
**C — Neutral State**
**D — Weak State**
**E — Low State**
The grades represent the calculated condition of the framework at the current observation point. They are not forecasts of future price behavior.
### Multi-Layer Market Observation
The dashboard presents both the individual factor readins and their higher-level results.
This allows the user to observe the relationship between:
**Factor → Module → State → Grade → Total Result**
The structure is intentionally designed so that the final result remains connected to the undeying analytical components rather than appearing as an isated number.
Swing Structure
The indicator also includes Swing High and Swing Low analysis.
Detected swing points are displayed as structural resistance and support references, while cosecutive swing points can be connected to provide a visual representation of the evolving price structure.
Swing parameters can be adjusted independently, allowing the structural layer to be adapted to different chart conditions.
FIFO Object Management
Historical labels and lines are managed through independent FIFO queues.
This keeps the number of chart objects within the configured limit while maintaining the most recent structural information. The object-management layer operates independently from the analytical scoring framework.
Configurable Parameters
The framework proides configurable parameters for:
* Moving averages
* RSI
* ATR
* Bollinger Bands
* Volume analysis
* DMI / ADX
* Swing High / Low detection
* Historical object limits
Parameter settings can be adjusted according to the characteristics of the market and chart environment being observed.
Intended Use
ATK/DEF MTF Regime Combo Day — Structure is designed as a market observation and analytical context tool.
Its purpose is to organize higher-timeframe information and convert multiple market characteristics into a structured set of calculated states and conclusions.
The indicator does not provide a guartee of fure market behavior and does not constute a predion of fure price movement. Its oputs are calculated observations based on the selected parameters and available market data.
The interptation of the displayed information remans the responsility of the indidual use.
**Core Architecture**
**MTF Higher-Timeframe Framework**
**+ Multi-Dimensional Market Analysis**
**+ Decision-Transfer Calculation**
**+ Structural Price Analysis**
**+ Composite State Classification**
= **Structured Market Observation**
指标

Order Flow PRO - Delta and ImbalanceOrder Flow PRO - Delta and Imbalance
OVERVIEW
Order Flow PRO is a volume-pressure panel for TradingView that visualizes estimated buying vs selling pressure per bar, cumulative delta, stacked imbalances, and price-delta divergence.
It helps assess whether price movement is supported by participation or developing under weakening internal conditions.
Important: TradingView does not provide true bid/ask transaction data for most instruments. Delta is estimated from bar structure and volume - not real institutional footprint.
Built by the Xcelerate Trade team.
━━━━━━━━━━━━━━━━━━━━━━━━━━━━━━━━━━━━━━━━
BEST USED WITH
━━━━━━━━━━━━━━━━━━━━━━━━━━━━━━━━━━━━━━━━
Works much better together with:
- Fluid Liquidity Zones - CHoCH + Mitigation + HTF | Xcelerate Trade
(or Fluid Liquidity Zones - CHoCH | Xcelerate Trade)
- Order Flow Footprint and Delta (OF1 / OF2 / OF3 overlay on chart)
Use SUPPLY / DEMAND zones + CHoCH / market structure first, then delta / imbalance as confirmation.
CONCEPT
Order flow analysis studies aggression and participation behind price. On TradingView, that is approximated from open/high/low/close and volume.
Use this indicator as a confluence layer after higher-level context (structure, liquidity zones, sessions) - not as a standalone entry system.
FEATURES
- Volume Delta histogram (green = bullish bar pressure, red = bearish)
- Delta MA smoothing line
- Cumulative Delta (normalized line)
- Stacked imbalance detection (3+ consecutive imbalance bars) - BUY / SELL markers
- Price-Delta divergence warnings
- Live dashboard: Delta, Cum. Delta, Volume, Pressure, Imbalance, Signal
- Dashboard position options and optional overlay on the price chart
- Alerts: stacked buy/sell imbalance, bullish/bearish divergence, extreme buying/selling pressure
HOW TO USE
1) Add the indicator on a separate pane below price (5m / 15m / 30m intraday)
2) Read Volume Delta for bar-by-bar pressure; use Cumulative Delta for session bias
3) Stacked imbalances: mark the zone, wait for pullback, confirm with structure - do not chase
4) Divergence: strongest near key levels + high volume; confirm with price action
5) Combine with Fluid Liquidity Zones and market structure before acting
RECOMMENDED SETTINGS
- Timeframes: 5m, 15m, 30m
- Delta MA Period: 20 (default)
- Imbalance Threshold: 0.7 (lower = more signals, noisier)
SKIP / AVOID
- Treating estimated delta as real bid/ask footprint
- Trading every imbalance or dashboard signal without structure context
- Ignoring high-impact news windows (volatility can distort delta)
- Using divergence alone as a guaranteed reversal call
LIMITATIONS
- Delta values are estimated due to platform data constraints.
- Results differ from platforms with exchange-level bid/ask feeds.
- Imbalance and divergence show structural conditions, not trade instructions.
- This script does not place trades and does not guarantee results.
- Always combine with your own risk management and market context.
指标

S/R & S/D Zone ProS/R & S/D Zone Pro
SD Zone Pro is an advanced concept indicator that identifies Supply and Demand zones using pivot points, clustering, and volume weighting. It is designed to reduce chart clutter, dynamically track zones, and visualize the interaction of historical zones with current price action.
🎯 Use as Support and Resistance
Demand Zones → Support Levels: The green/red demand boxes formed on the chart represent potential Support areas where buyers are concentrated and price drops may halt or bounce upward. When price retraces to these zones, potential reversal signals or buying opportunities can be monitored.
Supply Zones → Resistance Levels: The supply boxes formed around peak areas represent potential Resistance areas where sellers gain control and upward price movement may be capped. When price approaches these levels, profit-taking or downward reaction signals can be watched.
Zone Breakouts and Role Reversals (Flip Zones): If a supply (resistance) zone is broken upward with strong volume, it can act as support when price retraces back to it in the future. Similarly, when a demand (support) zone is broken downward, it may serve as resistance going forward.
Tolerance and Volume Confirmation: Unlike single-line support/resistance levels, this indicator presents price levels as ranges/boxes and displays pivot volume, providing a more reliable wide-band support and resistance framework.
📏 Box Width (Zone Height / Thickness), Volume Impact, and Usage
Dynamic ATR Structure: The vertical width (height) of the boxes is automatically calculated using the ATR (Average True Range) metric in line with market volatility.
Meaning of Zone Thickness:
Wide/Thick Boxes: Formed during periods of high volatility or across wider pivot clusters. Indicates a broader buffer zone where price may fluctuate inside the area.
Narrow/Thin Boxes: Formed during low volatility or when price reacts to very precise levels. These areas highlight cleaner and sharper support/resistance zones.
Volume Impact on Zones:
Accumulation and Validity Confirmation: Independent of box width, the total volume (K, M, B) accumulated over a zone directly defines its strength. High volume inside a narrow box indicates a major institutional battle (accumulation/distribution) took place within that tight band, making it a very strong barrier.
Zone Merging and Volume Compounding: When adjacent boxes merge (either same-side or cross-side supply/demand overlaps), the height and coverage of the new combined zone expand while the accumulated volumes of all merged zones are summed up on the label. This confirms that the widened box has evolved into a high-volume Major Zone.
Usage in Trading and Risk Management:
Stop-Loss Placement: Ideal stop-loss levels should be placed slightly beyond the outer boundary of the box rather than right at the top/bottom edge, accounting for box width (thickness) to avoid false breakouts (fakeouts).
Entry and Confirmation Levels: Since the box width represents a price range, entries closer to the middle or opposite boundary of the box offer a more favorable Risk/Reward ratio. Reactions from high-volume zones increase trade probability.
📐 Box Extension Logic
1. Extension of Active (Unclosed) Boxes
The latest supply and demand boxes that are still forming and have not yet been absorbed by a merge are automatically extended from their right edge to the current bar as new bars develop.
The volume labels attached to these boxes also follow this alignment, updating their position to the right on every new bar.
2. Extension of Closed (Historical) Boxes
Whether historical zones extend to the current bar depends on the selected mode:
Continuous Extension Mode (Unrestricted):
When proximity filtering is turned off, the right edge of all historical supply and demand boxes continues to extend to the end of the chart on every new bar.
Price Proximity Extension Mode:
When enabled, box extension relies on three specific rules:
Direct Touch or Proximity: When price enters a box's price range or comes within the configured percentage proximity tolerance, the right edge of that box extends to the current bar. If price moves away, the box remains fixed at the last bar it touched.
Tracking Nearest Zones to Price: Even if price does not directly touch the boxes, the 2 nearest boxes strictly above and the 2 nearest boxes strictly below the current close price are continuously identified. As price moves, these nearest levels are re-evaluated, and these 4 boxes dynamically extend to the current bar regardless of touch criteria.
Exemption for Recent Zones: The newest closed boxes within the defined box limit are exempt from the touch condition and always remain extended to the current bar.
3. Price Range Filter and Visibility Logic
Boxes outside the specified minimum/maximum price limits continue running their extension logic in the background; however, their background and border opacities are set to 100% transparent to hide them from the chart. The price range filter does not stop boxes from extending; it only controls their visual display on screen.
📌 How to Use
Zone Formation: The indicator monitors swing lows (Pivot Low) and swing highs (Pivot High) on the chart. Once your specified grouping numbers are met, it automatically constructs Demand (Green/Red boxes) or Supply zones.
Volume Insights: The right side of each zone displays the total volume (formatted in K, M, B) of the pivot bars forming that cluster.
Live Tracking and Extension: From the moment zones form, their right edges extend toward the current bar.
Touch and Proximity Tracking: When price approaches or touches a historical zone again, that zone reactivates and extends toward the current bar.
Multi-Timeframe (MTF): You can project supply and demand zones from higher timeframes (e.g., 4-Hour, Daily) directly onto your lower timeframe charts.
⚙️ Settings and Definitions
1. Grouped Pivot Volume & SD Zones (Main Calculation & Clustering)
Show Demand / Supply Labels?: Toggles volume labels on or off in the Demand and Supply zones.
ATR Multiplier (Box Merge Tolerance): Defines the merge tolerance for closely formed boxes. The ATR value is multiplied by this factor; boxes separated by less than this distance are merged into a single zone.
Merge Supply & Demand Overlaps?: When enabled, overlapping Supply and Demand zones (within price tolerance) merge into a single zone.
Enable Merged Zone Color & Merged Zone Color: Highlights zones formed by a cross-merge between Supply and Demand with a distinct custom color (default: Orange).
Display Mode: Select whether to display Demand Only, Supply Only, or Both zone types on the chart.
Show Last (Non-Merged) Box?: The master switch controlling the visibility of the most recent active box that hasn't been merged yet.
Extend Boxes Only on Price Proximity?:
OFF: All historical boxes extend continuously to the latest bar.
ON: Boxes extend to the latest bar only when price approaches/touches them or when they are among the nearest zones to price.
Proximity Tolerance (%): Specifies how close (in percentage) price must get to a box level to trigger an extension.
2. Price Range Filter
Enable Price Range Filter?: Hides boxes that fall outside the specified lower and upper price limits.
Min Price / Max Price: The minimum and maximum price boundaries within which boxes remain visible.
3. Multi-Timeframe (MTF)
Enable MTF?: Enables pulling data from a different timeframe.
MTF Timeframe: The timeframe used for pivot detection (e.g., 1D, 4H, 1H). If left blank, the chart's current timeframe is used.
⚠️ IMPORTANT NOTES & DISCLAIMERS
💡 Regarding Repainting:
Pivot-based indicators inherently require confirmation bars defined by Pivot Length. Once a pivot is confirmed, the box is plotted back in history. This is not a bug or error; it is the fundamental technical mechanism of pivot calculations.
💡 MTF Usage:
When using Multi-Timeframe (MTF) mode, it is highly recommended to select a higher timeframe than your chart's current timeframe (e.g., 1-Hour or 4-Hour MTF while viewing a 15-minute chart). Selecting lower timeframes may cause data misalignment or missing bar mappings.
💡 Performance and Engine Limits:
Due to Pine Script engine limits, a maximum of 500 boxes and labels can be rendered simultaneously on a chart. The indicator features automatic capacity management to prevent memory overflow errors. 指标

Daily ATR Projection [EDGE]Daily ATR Projection .
Projects the previous daily close plus and minus 0.5 and 1.0 ATR(D) as five horizontal levels on the current chart, and shows the same levels together with a live ATR% amplitude reading in a compact dashboard. Built for intraday traders who want a fixed, non-repainting map of how much room the day still has before the session has statistically exhausted its average range.
How it works:
The indicator requests the previous completed daily bar via request.security(sym, "D", [close , atr_expr ], lookahead = barmerge.lookahead_on). The two values it pulls — previous daily close and previous daily ATR — are always finalised bar data, so the projection never repaints during the intraday session. From those two numbers it computes four projected levels: previous close plus and minus 0.5 x ATR(D) and plus and minus 1.0 x ATR(D). The fifth line is the previous daily close itself.
On every last bar the five levels are (re)anchored using xloc.bar_time so they extend the requested number of bars to the right of the current bar, without being clipped by empty space in the chart layout. When the smoothing method is changed the ATR expression is recomputed inside a single helper so RMA, SMA, EMA and WMA all share the same request.security call.
What it calculates:
- Prev Close — previous daily close, drawn as the middle reference line.
- +100% — previous close + 1.0 x ATR(D), the upper edge of the expected daily range.
- +50% — previous close + 0.5 x ATR(D), the mid upside marker.
- -50% — previous close - 0.5 x ATR(D), the mid downside marker.
- -100% — previous close - 1.0 x ATR(D), the lower edge of the expected daily range.
- 1 ATR, % — the previous daily ATR expressed as a percentage of the previous daily close, i.e. today's average expected amplitude.
- Distance-to-price row — signed distance from each of the four ATR levels to the current close, so the trader can see how much of the daily potential is still available in each direction.
Key features:
- Non-repainting daily ATR — data is pulled from the previous completed D1 bar; intraday bars never see values that have not been finalised.
- Adjustable smoothing — RMA (Wilder), SMA, EMA or WMA on the daily True Range.
- ATR multiplier — 1.0 keeps the classic envelope, 0.5-2.0 for tighter or wider projections.
- Right-extension control — line reach is configured in bars of the current timeframe, so the levels stay visible on any chart scale.
- Toggle for the middle line — turn off the previous daily close if a separate PDC indicator is already loaded.
- Compact dashboard with six anchor positions (top / bottom / middle, left / centre / right) and four text sizes.
- Two-row value grid — absolute level values on one row, signed distance to current close on the row below.
- Live 1 x ATR(D) amplitude reading with an inline tooltip mapping the reading to volatility regimes (low / normal / elevated / extreme).
- Meaning-encoded colour scale — deep green and deep red for the outer plus / minus 100% boundaries, softer green and red for plus / minus 50%, neutral grey for the previous close. Every colour is exposed as input.color and can be overridden.
- All input labels, tooltips and dashboard captions in English.
Who it's for:
Intraday and short-horizon swing traders who plan entries against the previous daily close and want a fixed, statistically grounded map of the day's realistic upside and downside potential. Useful for session-based playbooks (open, mid-day, close), for measuring how much of the average day has already been printed before committing to a continuation trade, and as a discipline overlay for fade traders who prefer to avoid taking reversal setups after price has already consumed the full daily amplitude. 指标