4H Roadmap: The Structure That Will Decide the Weekly Scenario# **DXY | 4H Roadmap: The Structure That Will Decide the Weekly Scenario ๐**
Greetings, fellow wave practitioners.
In the previous weekly analysis, I presented two valid long-term scenarios for the U.S. Dollar Index (DXY): an **Aggressive Scenario** and a **Conservative Scenario**. The purpose of this 4-hour update is to determine which of those higher-degree paths the market is currently constructing.
From the most recent major high, the initial decline is unfolding as a **three-wave structu
Economic Cycles
Long trade
๐ SNAP MAP โ XAUUSD Buyside Trade Idea
Pair: XAUUSD
Direction: ๐ข Buyside
Date: Mon 6th July 26
Session: NY Session AM
Entry Time: 10:00 AM
Entry: 4135.274
Target / Profit Level: 4181.203
Stop: 4127.501
Gain Target: 1.11%
Risk: 0.18%
RR: 5.91
๐ง SNAP BIAS
๐ข Buyside reaction trade after sellside delivery
Price rejected from the 4180โ4200 region
โ Sellside displacement delivered into 4135
โ Lower support held near 4135 / 4127
โ Entry activated at 4135.274
โ Price reclaimed above the entry zone
โ
ETH update 16.07.26 - 24h Market Forecast (Wavelet Decomp.)Hi traders,
today's forecast has turned moderately bullish, with the model projecting a gain of approximately 20 units over the next 24 hours.
The signal is driven primarily by the underlying trend component (+31.4 units/day), which outweighs the two strongest bearish cyclesโthe 88.0-hour (โ25.0 units/day) and 111.4-hour (โ24.2 units/day) components. Additional support comes from several shorter- and medium-term cycles, including the 54.9-hour, 34.3-hour, 362.0-hour, 27.1-hour, and 286.0-hour
BTC update 16.07.26 - 24h Market ForecastHi traders,
for the next 24 hours, the model continues to indicate a largely neutral market.
The strongest spectral components are almost perfectly balanced. The dominant bearish cycles are the 111.4-hour (โ630 units/day) and 88.0-hour (โ532 units/day) components, while the long-term trend (+608 units/day) nearly offsets their combined influence. Additional bullish support comes from the 54.9-hour (+299 units/day) and 362.0-hour (+209 units/day) cycles, whereas the 141.0-hour and 580.0-hour com
Micron 1.618 Fibonacci HitFrom the peak of the Dot Com Bubble to the nadir of the Great Financial Crisis, Micron actually hit it's 1.618 Fib. A Biblical move a quarter century in the making, this one is for the history books. There also appears to be a generational cup and handle formation playing out, although it's technical target may be years out of reach.
Two Valid Scenarios Remain | Elliott Wave AnalysisBitcoin (BTC/USD): Two Valid Scenarios Remain | Elliott Wave Analysis
In this analysis, both the conservative and aggressive scenarios remain valid. Until the market completes its structure, neither scenario has a decisive advantage over the other.
Under the conservative scenario, there is a possibility that the larger-degree Wave (IV) has already been completed, and the market is now developing Wave (1) of Wave (V). If this wave count is correct, the current correction may complete Wave (2) a
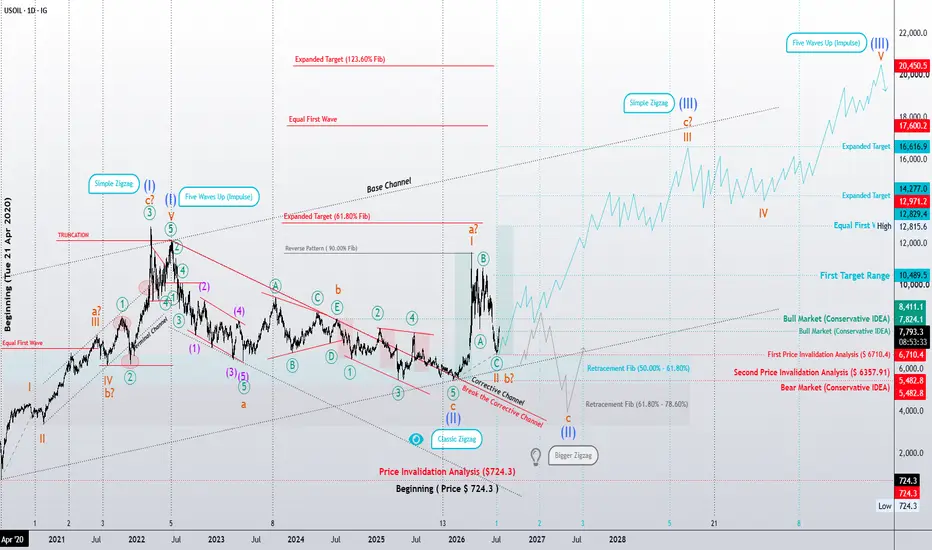
Impulse, Diagonal, or a Larger Correction?Crude Oil (USOIL)Crude Oil (USOIL) โ 4H Elliott Wave Update
Impulse, Diagonal, or a Larger Correction?
The recent decline may have completed either Wave II of a developing bullish cycle or Wave b within a larger corrective structure. At this stage, both interpretations remain valid, and the market has not yet provided enough structural evidence to confirm either scenario.
If the bullish count is correct, the next advance could unfold in more than one form.
The most straightforward scenario is a classic five-w
BTC update 14.07.26 - 24h Market Forecast (Wavelet DecompositionHi Tragers,
today's 24-hour outlook is essentially flat, with no clear directional bias. Instead of a sustained trend, the model projects a couple of modest wave-like fluctuations throughout the forecast period, suggesting consolidation rather than a decisive move in either direction.
Reading the Character of the Next Market CycleCrude Oil: Impulse or Diagonal? Reading the Character of the Next Market Cycle
In my previous long-term analysis, the primary expectation was that crude oil was developing the final fifth wave of the largest degree as a classic Impulse. If that interpretation proves correct, the long-term bullish outlook remains valid and significantly higher price objectives could still become achievable over the coming years.
However, as the market structure continues to evolve, another equally valid Elliott
AUS200
Same logic. Applied across every instrument.
Price over everything.
Every headline, every rumor, every report, and every opinion is reflected in price.
This AUS200 setup is built on one thing only. Pure price action. No indicators. No noise.
The footprints are there for those who know where to look. Structure, liquidity, and market reaction tell the story long before the news does.
I trade what price reveals, not what people predict.
Price is the only language I need.
Price Left Clues๐ฃ
XAU/USD for following weekXAUUSD 4H Analysis โ MMBM in Play ๐

Market is currently unfolding a textbook Market Maker Buy Model (MMBM) following a confirmed Smart Money Reversal inside the deep discount OTE zone (sweeping PWL).
Currently re-accumulating around 4,120 with clean bullish order flow. The Draw on Liquidity (DOL) is pulling price toward the NWOG (4,218โ4,301), with the Consequent Encroachment (NWOG.CE at 4,260) acting as a key magnet.
Terminal Target: Expecting a full delivery curve up to the Original Consoli
DXY | Corrective Structure Under the MicroscopeDXY | Corrective Structure Under the Microscope: Leading Diagonal or Complex Zigzag? ๐
Greetings, fellow wave practitioners.
The Aggressive Scenario assumes that the U.S. Dollar Index (DXY) has entered a higher-degree corrective phase from its major peak. According to the Elliott Wave Principle, Wave (A) may currently be developing through one of two valid structural paths.
The first possibility is a Leading Diagonal, a motive structure that fully satisfies Elliott Wave rules and guidelines w
META's Explosion at Price-Time Gate: Legendary Surge or Trap? ๐META: The Macro Vector Matrix and the Imminent High-Velocity Expansion Phase
โโโโโโโโโโโโโโโโโโโโโโโโโโโโโโโโโโ
1. Structural Hypothesis
This study is not a conventional technical analysis, nor is it a collection of retail chart patterns or speculative price projections.
Instead, it is built upon a proprietary structural framework designed to decode market cycles through the convergence of price, time, geometric symmetry, and multi-layered structural compression across multiple macro timef
NQ Weekly Outlook: Mixed to Higher? | 13 to 17 July 2026The model read for the coming week contains three positive-bias days and two negative-bias days, suggesting a mixed structure with an overall tendency toward higher prices.
This outlook is based on the NQ Globex session, not only regular cash-session price action.
Monday, 13 July: Negative bias
Monday carries a negative bias, although positive momentum from the weekend may continue into the early part of the session and create choppy or conflicted price action.
NQ ended the previous week nea
EURUSD Macro Structural Report: Navigating the 3rd Candle Matrix1. High-Horizon Dilemma
The current monthly cycle is officially traversing the 3rd candle footprint of a developing Monthly Fair Value Gap (M-FVG). Historically, this phase represents one of the most mechanically complex environments to navigate, as the Interbank Price Delivery Algorithm (IPDA) balances rapid multi-hundred pip expansion capabilities with high-probability accumulation traps.
2. Definitive Macro Stance
Our long-term thesis remains un-alterably bearish until a full macro rebalanci
Copper Futures:The Structural Turning Point of a New Macro CycleHG1! | Macro Structural Convergence and Transition to a High-Velocity Expansion Phase
โโโโโโโโโโโโโโโโโโโโโโโโโโโโโโโโโโ
1. Structural Hypothesis
This chart is not merely a technical analysis or a collection of price targets.
This study is based on a proprietary structural model developed to analyze the market through the convergence of price, time, structural behavior, structural compression, structural complexity, movement logic, and the framework of price-time coordination across all ti
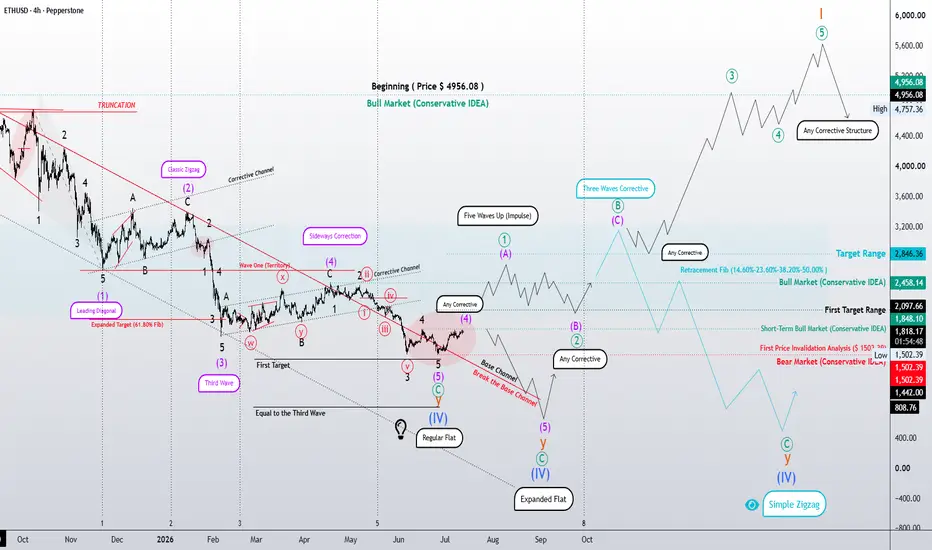
Is Wave C Complete, or Is the Correction Still Unfolding?Ethereum
Following the broader structural outlook presented in the weekly analysis and the primary scenarios discussed in the daily chart, this 4-hour update focuses on the internal development of Wave Cโthe portion of the structure that may ultimately determine whether the higher-degree Wave (IV) correction is nearing completion.
Conservative Scenario
According to the rules and guidelines of the Elliott Wave Principle, Wave W appears to have completed as a Simple Zigzag, followed by Wave X a
Ethereum | Is the Major Correction Ending, or?Ethereum | Is the Major Correction Ending, or Is a More Complex Structure Still Unfolding?
Ethereum's long-term structure suggests that the market remains at one of the most critical stages of its higher-degree Wave (IV) correction. The primary question is not whether price will move higher or lower next, but whether this corrective phase is approaching completion or if the market still has another portion of its correction left to reveal.
Conservative Scenario
According to the rules and guid
Ethereum | Is the Largest Corrective Cycle Nearing Completion?
Our structural analysis suggests that Ethereum may be approaching the final stages of Wave IV within its largest bullish market cycle. Based on the rules and guidelines of the Elliott Wave Principle, this correction is currently being interpreted as a complex sideways corrective pattern.
In the preferred scenario, Wave Y is unfolding as a Flat correction that still has the potential to evolve from a Regular Flat into an Expanded Flat. If this structure is completed as expected, it could mark t
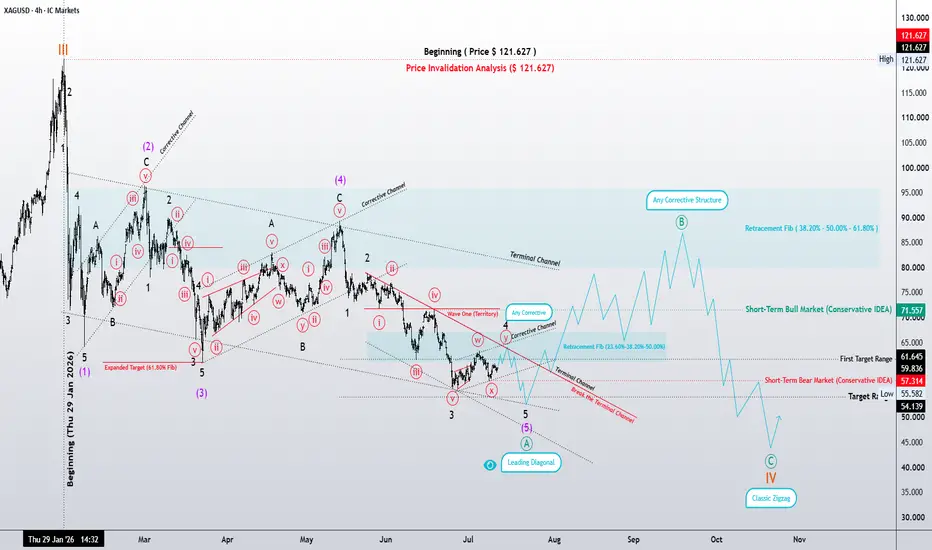
Leading Diagonal Suggests a Corrective Rally Before Completing XAGUSD (Silver) | Leading Diagonal Suggests a Corrective Rally Before Completing Higher-Degree Wave IV
"Price is the outcome. Structure is the cause."
After examining the weekly, daily, and now the 4-hour chart, the aggressive scenario continues to align with the rules and guidelines of the Elliott Wave Principle.
In this interpretation, the recent decline is counted as a Leading Diagonal following the 5-3-5-3-5 structural sequence. So far, the internal subdivisions remain consistent with the
Microsoft - A Visual AlmanacA rare structural asymmetry has been developing in the equity markets. While the S&P 500's 9.6% year-to-date return establishes a powerful macroeconomic floor, Microsoft has decoupled from the index by undergoing a -30% correction. This combination of an index momentum cycle and a discounted mega-cap growth leader presents a compelling thesis.
The broader market enters the second half of the year backed by strong cyclical momentum, where front-half strength historically serves as a launchpad:
Bitcoinโs Make-or-Break Zone: Is $60K the Launchpad for $90K?Bitcoin is once again trading inside a historically important demand zone between $60,000 and $64,000. From a technical perspective, the broader structure remains bearish โ BTC continues to form lower highs and is still trading below both the 200-day moving average and the major descending trendline.
However, the technical weakness is developing alongside several long-term fundamental catalysts that could create the conditions for a larger recovery.
Corporate demand has not disappeared
Michae