Gold (XAUUSD): Institutional Order-Flow Shifts BearishExecutive Summary
Gold has completed a textbook macro distribution phase on the Daily (1D) timeframe. The most significant structural development is the clean breakdown and confirmation below the dynamic 200 EMA. This shift in the macro regime has opened the door for a multi-wave markdown sequence. By mapping the current nested structures, we can identify two primary bearish paths along with the exact invalidation points that define this macro short thesis.
Market Structure & Order-Flow Anal
Fibonacci Extension
$NASDAQ:NESR Working on a breakout 65% upsideNASDAQ:NESR has been riding the 50 day MA for a while, showing support and rebounding upward. The resistance line continues to be tested and I think that we're going to see upward pressure win out in the near future. This could be driven by the next quarterly earnings report (August) or some other positive event.
My conservative Entry would be AFTER the stock closes ABOVE the resistance line. If you want to gamble a little, then set a buy around the 50 day MA.
Price Target is ~$45.
T
GBPUSD — EMA Bearish Trend, Sell From Fibonacci Confluence
Fundamental Analysis
GBPUSD remains under pressure as traders continue to watch USD momentum, U.K. data, and broader market risk sentiment.
For now, the technical structure still favours sellers while price trades below the main EMA range. Any recovery should be treated as a corrective pullback unless GBPUSD can reclaim the key resistance zone with strong confirmation.
Technical Analysis
On the 1H chart, GBPUSD is still trading below EMA 34, EMA 89, and EMA 200. This confirms that the shor
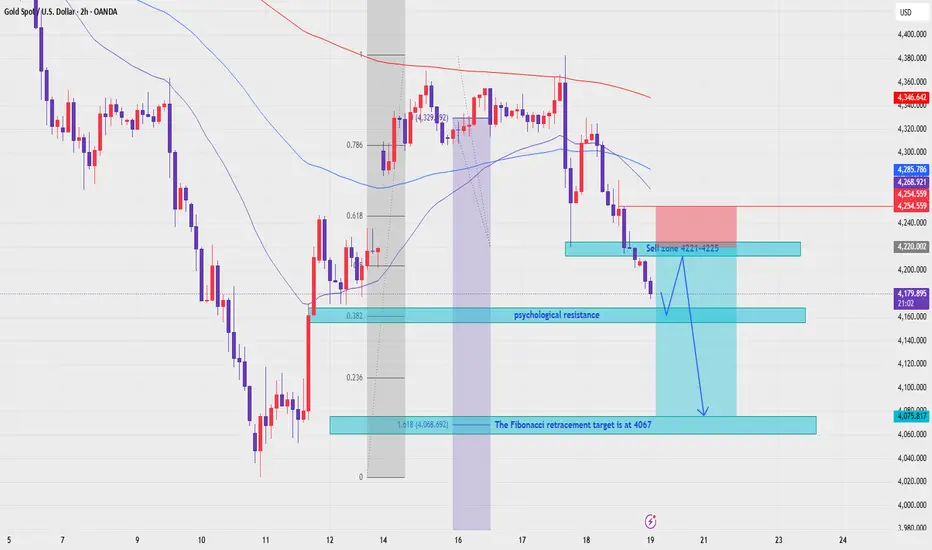
XAUUSD — EMA Bearish Trend, Fibonacci Confluence Target in Focus
Fundamental Analysis
Gold remains under pressure as price continues to trade below the main EMA structure. Traders are still watching USD momentum, Treasury yields, and upcoming U.S. macro data.
For now, the technical structure still favours sellers while recovery attempts remain weak below EMA resistance.
Technical Analysis
On the 2H chart, XAUUSD is trading below EMA 34, EMA 89, and EMA 200. This confirms that the short-term trend remains bearish, with the EMA structure acting as dynamic
MASON XAUUSD – Downtrend Still Dominates, Rebound Is Secondary
XAUUSD is trading around 4,062 after another strong bearish move. Price remains below the Ichimoku cloud and below the broken trendline, so the main structure is still bearish.
The primary view is sell continuation, while the secondary scenario is a short technical rebound before the next confirmation.
Technical View
Gold is still moving under clear bearish pressure after breaking the previous trendline support. The latest reaction around 4,054 shows that price is testing a strong liquidity
MASON XAUUSD – Gold Breaks Trendline, Sell Continuation In Focus
XAUUSD is trading around 4,140 after a strong bearish move. Price has broken below the short-term rising trendline and remains below the Ichimoku cloud, showing that sellers are still controlling the structure.
The main view is sell continuation, especially if price retests the broken trendline or previous support zones.
Technical View
Gold has broken the rising trendline that previously supported the recovery wave. This is an important signal because the market is no longer respecting the s
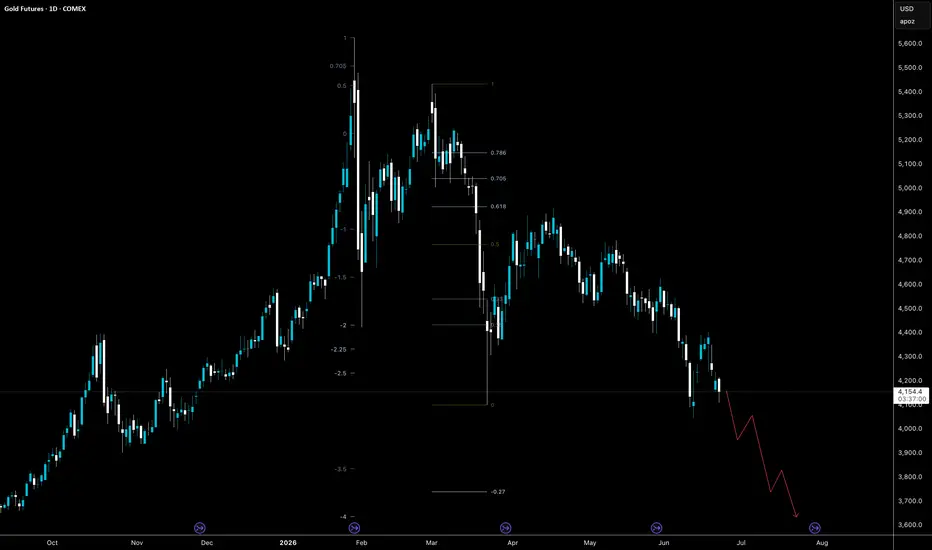
Gold (GC1! / XAU) — Fibonacci Breakdown Signal Deeper CorrectionAsset: Gold Futures (COMEX, GC1!) — Daily
Price at time of writing: $4,155.4 (-1.13%)
Bias: Bearish (corrective phase within larger bull trend)
Context :
Gold's move off the 2025 lows was nothing short of parabolic — a clean, near-vertical advance from roughly $3,250 (Aug 2025) to a blow-off top near $5,440 (Mar 2026). Parabolic advances of this speed rarely resolve with a sideways pause; they tend to mean-revert hard, and that's exactly the structure playing out since the March top.
Since the
XAUUSD — EMA Downtrend Holds, Sell Position Remains Active
Fundamental Analysis
Gold remains under pressure as price continues to trade below the main EMA structure. Traders are still watching USD strength, Treasury yields, and upcoming U.S. macro data.
For now, the technical structure still favours sellers while recovery attempts are rejected from the value sell zone.
Technical Analysis
On the 1H chart, XAUUSD is trading below EMA 34, EMA 89, and EMA 200. The EMA structure is still pointing lower, showing that the short-term trend remains bearish
BTC Multi-Timeframe Analysis: Confluence of Bearish FormationsIdea Type: Short / Bearish Setup
Asset: BTC/USDT (Binance)
Timeframe: Multi-Timeframe Analysis (4H, 1D, 1W displayed on 1D chart)
Market Overview & Confluence Breakdown
When multiple independent timeframes align to point toward the exact same directional bias, the market structure demands close attention. As displayed in the attached chart, Bitcoin is currently showing a rare confluence of bearish Fibonacci extension structures across the 4-Hour, Daily, and Weekly charts.
The structural brea
XAUUSD — EMA Bearish Trend, Fibonacci Target in Focus
Fundamental Analysis
Gold remains under pressure as traders continue to watch USD strength, Treasury yields, and upcoming U.S. macro data.
For now, the structure still favours sellers while XAUUSD trades below the main EMA range. Any recovery should be treated as a technical pullback unless price can reclaim the EMA resistance zone with strong confirmation.
Technical Analysis
On the 2H chart, XAUUSD is trading below EMA 34, EMA 89, and EMA 200. This confirms that the current trend remains
XLM — ABC Delivered, WCLs Now in PlayPrice has reached the bearish ABC C target on the 4H.
That’s a fact, not a forecast.
What happens next is not guaranteed .
Often after a sequence delivers, price looks for relief and retracement toward nearby liquidity — and in this case, the unreached WCL zones above are the obvious magnets.
But let’s be clear:
ABC delivery ≠ trend reversal
Price can accept the C target and continue lower
Or it can retrace toward WCLs before the next decision point
Both outcomes are valid u
US Crude Oil (WTI) – Major Bearish BreakdownIdea Type: Short / Bearish Setup
Asset: US Crude Oil Spot (WTI)
Timeframe: 4-Hour (4H)
Market Analysis & Technical Setup
As shown in the chart, US Crude Oil is showing massive bearish momentum after a structural breakdown. The technical layers point heavily toward a continued downside expansion.
Key Technical Observations:
200 EMA Resistance: The price is trading significantly below the 200 Exponential Moving Average (EMA) on the 4H chart. The declining 200 EMA confirms a dominant macro bearis
Gold Structural Reversal Into Bullish Impulse!The Gold market (XAUUSD) stabilizes in Friday's session, displaying a significant structural shift as buyers firmly grasp the near-term momentum. Following a highly volatile week driven by CPI and PPI releases, market participants are now shifting their focus toward the upcoming Michigan Consumer Sentiment Index. This late-week data catalyst will provide critical insights into consumer inflation expectations and overall economic health, directly influencing how institutional desks position their
XAUUSD: Wave 5 Reaches the Fibonacci Sell Swing Zone
Gold is pushing into an important resistance area after a strong recovery from the lower liquidity base around 4,053. From Kelly’s view, the current advance is now approaching the final part of a short-term Elliott Wave structure, where wave 5 may be close to completion.
The key idea is simple: gold is still rising, but price is now entering a Fibonacci resistance zone where the next reaction becomes very important.
⟡ Market structure
The chart shows a strong recovery from the 4,053 support
WTI Crude Oil (XTIUSD) Update: US-Iran Peace Accord Accelerates WTI Crude Oil (XTIUSD) Update: US-Iran Peace Accord Accelerates Breakdown Toward Crucial 200 EMA & $75 Support Floor
### 🛢️ WTI Crude Oil (XTIUSD) Macro Update (Ref: XTIUSD_2026-06-15_08-34-17.png)
We are releasing a crucial technical and fundamental update for WTI Light Crude Oil ( ICMARKETS:XTIUSD - IC Markets) following pivotal geopolitical developments.
### 📰 Geopolitical Catalyst vs. Technical Reality
The recent fundamental announcement of a peace agreement/normalization breakthrough b
Gold (XAUUSD): Structural Breakdown & New Target ActivationFollowing a multi-month bullish expansion, Gold (XAUUSD) has experienced a significant structural shift on the Daily (1D) time frame. Price action recently encountered heavy resistance near the "Golden Pocket" liquidity zone ($4,800 - $5,000$). The inability to sustain higher prices inside this major threshold triggered a corrective sequence that has now evolved into an active bearish structural impulse.
Technical Breakdown
1. Structural Shift & Short Signal Confirmation
The Geometry: After rea
Japan 225 (NI225): Macro Bullish Trend Heading Towards TargetAs seen, the Japan 225 (Daily) is displaying a stellar textbook bullish market structure. After a healthy multi-month consolidation pattern (yellow zig-zag corrective wave) that completed in late March near the $50,000 macro support line, the index experienced a massive impulsive continuation.
Price has cleanly broken above the previous local resistance levels ($58,000 and $62,400), effectively flipping the entire zone into a strong demand foundation. It is currently moving aggressively higher
METC | Coal Making Moves In The Energy Space | LONGRamaco Resources, Inc. engages in the operation and development of coal mining properties. The firm deals with metallurgical coal in central and southern West Virginia, southwestern Virginia and southwestern Pennsylvania. Its portfolio consists of Elk Creek, Berwind, RAM Mine, and Knox Creek. The company was founded by Randall W. Atkins in August 2015 and is headquartered in Lexington, KY.
Gold Preparing for a Trendline Breakout?Gold is showing early signs of a bullish recovery after completing a five-wave decline and sweeping liquidity below the recent lows around 4376. The strong rejection from that area suggests that sellers may be losing control, while buyers begin to step back into the market.
The recent rally has already reclaimed a portion of the previous decline and is now approaching a key descending trendline that has capped price since the recent highs. A successful breakout above this trendline would be an
UNG | "Power Plant Day" or Payday? Why UNG is Coiling | LONGIf you thought your wallet felt light after the holidays, buckle up. Natural gas is about to pull a "Phoenix" act, and it’s not just because the groundhog saw its shadow. Between a geopolitical powder keg in the Middle East and the ghost of winter storms past, the "buy the dip" crowd is about to look like geniuses - and everyone else is going to be wearing three sweaters indoors.
1. The "Strait" Jacket: The Trump Deadline
As of this morning, April 7, 2026, the market is holding its breath. Pres
Gold Futures (GC1!) Daily: Perfect Convergence Target at 4,374 (Gold Futures (GC1! - COMEX) is developing a very precise bearish expansion structure on the Daily Chart, heading toward a major technical confluence zone.
As macro sellers keep pressing the price down along the local descending structure, we can clearly map an institutional accumulation area where buyers are highly likely to step in.
### The Power of Confluence (Target: 4,374):
The core of this technical study relies on a textbook structural convergence highlighted by two independent indicator
NBIS | A.I. Centric Cloud Platform | LONGNebius Group NV is a technology company that provides infrastructure and services to AI builders worldwide. It offers Nebius AI, an AI-centric cloud platform provides full-stack infrastructure, including large-scale GPU clusters, cloud services, and developer tools. The company also operates through specialized brands: Toloka AI, which partners in data for generative AI development; TripleTen, an edtech platform focused on re-skilling individuals for tech careers; and Avride, which develops auto
IonQ Daily: Strong Bullish Momentum Targets 1.618 Fibonacci ExteIonQ Inc. ( NYSE:IONQ ) is displaying a highly explosive bullish structure on the Daily Chart, serving as a textbook example of a long-term trend reversal and Fibonacci expansion.
After spending months consolidating and accumulating below its key baseline, the stock has officially shifted its macro regime.
### Key Technical Insights:
* **The Macro Trend Reversal:** In early May, IONQ decisively broke above its 200-Period Exponential Moving Average (EMA 200 - purple line currently at 42.97). Th
Ethereum’s Long-Term Odyssey (2030-2040): The Road to $492K via Ethereum’s Long-Term Odyssey (2030-2040): The Road to $492K via Wave (III)
Hello Traders! 🚀
As an Elliott Wave enthusiast, I’ve been dissecting Ethereum’s long-term structure since 2015. Today, I’m sharing my “Aggressive Idea” for the next decade of market evolution.
Key Technical Observations:
Cycle Degrees: We completed the massive Wave (I) at the 2021 peak. Since then, we have been meticulously navigating a complex Wave (II) correction.
The “Ruining” Flat: Currently, ETH is in the late