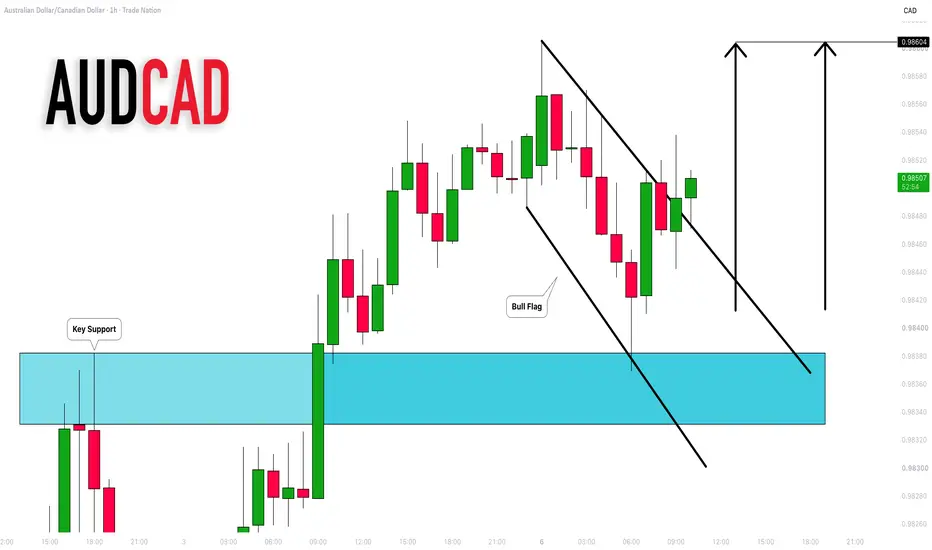
AUDCAD: Strong Bullish Setup 🇦🇺🇨🇦
There is a high probability that AUDCAD will continue rising
after a retest of a recently broken structure.
A bullish breakout of a resistance line of a flag indicates
a strong buying pressure.
Expect a price rise to 0.986
❤️Please, support my work with like, thank you!❤️
I am part of Trade Nation's Influencer program and receive a monthly fee for using their TradingView charts in my analysis.
Flag
Gold Forms Bullish Flag After Strong Weekly CloseGold ended the week with strong bullish momentum, and price action has now followed through by presenting another potential continuation setup for traders looking to stay aligned with the trend.
The current structure forming on the chart is a bullish flag pattern, which typically appears after an impulsive move higher followed by a period of controlled consolidation. In this case, that consolidation may be setting the stage for another potential breakout to the upside.
As always, however, the
XAUUSD: Bullish Flag Breakout or Pullback to Order Block?Current Setup:
Gold is trading inside a bullish flag pattern. The next move will be decisive.
Two Possible Scenarios:1. Bullish Breakout (Preferred Scenario)
If price breaks above the upper trendline of the flag with strong momentum, we can expect a direct pump on Monday. This would confirm continuation of the uptrend.2. Pullback Scenario
If price breaks below the flag support, the next high-probability buying zone is the Bullish Order Block at 4060-4070.
Summary: Break above flag → Strong bulli
Bullish Flag in Moschip-- Educational purposeMoschip Technologies Ltd is a semiconductor and system design company with a focus on Turnkey ASICs, Mixed Signal IP, semiconductor & product engineering, and IoT solutions catering to aerospace & defence, consumer electronics, automotive, medical and networking & telecommunications
This small cap stock has formed bullish POLE FLAG pattern after downtrend from 288.45 (in Oct 2025) to 146.8 (in March 2026) i.e. almost - 50% correction in 6 -7 months. After making low in March 2026 stock has star
GS to reach new All Time Highs... XLF is looking to make higher highs which in turn means, GS will make higher highs.
XLF has formed and broken it's second bullflag in the past two months to continue it's uptrend.
GS has found support at the 50ema and followed thru the next day with a stronger showing before pulling back.
GS moves in bunches and is a giant amongst the banks witha fundamental showing to back it.
S&P 500 is in a pennant. Those usually resolve higher.
Post rally consolidation has taken hold and formed a pennant. But the market is now entering one of its strong months on average (July) and pennants normally resolve higher in the direction of the preceding move, which is up.
There is plenty of room to run when looking at stochastics on the daily chart.
The MACD histogram (also on daily) is flipping towards positive and a crossover that follows price breaking out would help confirm.
The Bull Flag Pattern: Why Volume Decides Whether It HoldsMost traders treat a bull flag as a shape: sharp rally, small pullback, buy the breakout. The shape is the easy part, and it is why so many flag trades fail. What separates a genuine pause from a top is volume, the one thing most chart guides leave out of the drawing.
The bull flag pattern is one of the few continuation setups with real evidence behind it, but that evidence depends on a condition the textbook diagram rarely shows: read the volume and you read whether the trend is resting or bei
$VVV Bears in Full Control Updated Analysis + Targets For ShortsHad a few rough trades a few months ago which forced me to reevaluate my trading setups entirely, and I gotta say it was probably one of the best things that could have happened to me.
My new strategy has been absolute fire lately.
Case in point, this NYSE:VVV SHORT.
Nailed the entry earlier in the month, and been riding it ever since. Notice how PA just keeps getting pushed down by the 9EMA and 20MA.
The RSI Bearish Divergence on Venice Token has been blatantly obvious for sometime now.
GBPCHF: Bullish Trend Continuation 🇬🇧🇨🇭
GBPCHF broke and closed above a resistance line of a bullish
flag pattern on a 4H time frame.
It matches perfectly with a valid change of character.
I expect that the price will continue rising and reach 1.0721 level soon.
❤️Please, support my work with like, thank you!❤️
I am part of Trade Nation's Influencer program and receive a monthly fee for using their TradingView charts in my analysis.
Ethereum to $800 - The Inevitable Breakdown - June 2026
SYMBOL: COINBASE:ETHUSD | DIRECTION: SHORT | TIMEFRAME: 2-Month
Published: June 2026
Ethereum is different. You’ve heard, presumably. Ultrasound money. EIP-1559. The merge. Proof of stake. Deflationary tokenomics. The base layer for the decentralised financial system. The flippening. Staking yields. The whole internet of value.
These arguments have been present and passionately delivered for approximately every single moment of ETH’s decline from $4,900 to the current price. They will st
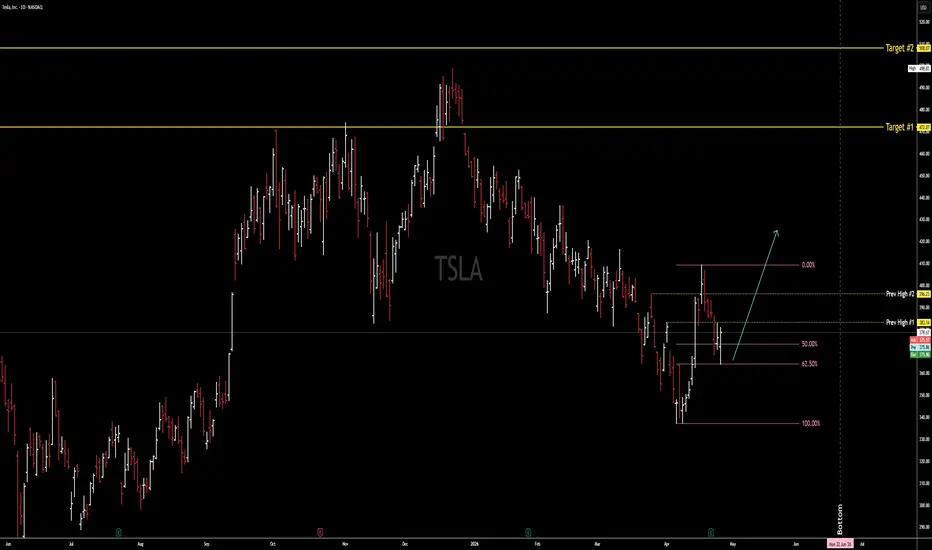
TSLA: Trend Reversal Signal — First Higher Bottom SetupTesla has broken two consecutive previous highs, which is a classic early indication that the trend may be shifting from bearish to bullish. This break of structure suggests buyers are starting to regain control.
Price is currently pulling back into the 62.5% Fibonacci retracement, creating an ideal zone for a first higher‑bottom setup.
A Buy STOP at $381 is appropriate for confirmation, with a stop‑loss below $364 to keep the structure valid.
🎯 Profit Target #1: $472
📈 Reward–Risk Rati
COIN: THE BLUE-CHIP THAT TRADES LIKE A S COINDuring this Nasdaq meltup, investors are hunting for growth anywhere they can find.
Tech firms with expanding margins (like Nvidia or Microsoft).
Small cap drone manufacturers that are in the right sector, anything AI related, Power.
Give people a story and they will bid it up.
As a Bitcoin proxy, it plays second fiddle to MSTR.
If they are using NASDAQ:COIN for exchange fees... then fees are larger when there is industry FOMO.
There is none currently.
Liquidity-Driven Fractals: If you
Dow Jones eyeing bull flag/support confluencePrice action on the Dow Jones Industrial Average is in the process of chalking up a potential bullish flag between the all-time high of 52,286 and 51,398. You will also note that the index is forming a rising wedge pattern between 45,057 and 49,717.
While the noted patterns offer conflicting signals, the fact that the lower edge of the rising wedge merges with the lower boundary of the bullish flag pattern, and that this market is entrenched within a strong uptrend, suggests that a rebound fro
ETSY Showing Strength into NecklineFlagging into this neckline at $75
ETSY setting up in a tight bull flag — sharp 33.0% pole from $56.71 to $75.43, now consolidating over the last 3 sessions. Holding above the EMAs with the flag low at $72.48. Measured-move target $89.96 on the break, stop under the flag at $71.76.
#bullflag #flagpattern #breakout #pivotpoints
R we going the Flag bounce @0.236 or the 0.382 Fib deep bounce ?We have built a nice Flag since the beginning of may, but ...
... the EMA's are still open, but there is a tendency that the EMA20(red) might cross EMA50(orange)!
If that happens, we might bounce the 0.382 Fibonacci Level, as we just dived through the 0.236er Fib-Level.
But with todays candle that might form out above the 0.236 Level, which will support the Bullish flag !!!
Fingers crossed !
AVGO: Speculative Topping Scenario — Tracking The Chip Trade📉 🖥️ 🇨🇳 📊 🚀
1. The Fundamental Shift: Broadcom’s Cautious Guidance Shock
While the retail crowd continues to buy every single technology dip under the assumption that AI infrastructure spending is an infinite money printing press, the smart capital is watching corporate guidance closely.
The semiconductor sector suffered a massive, historic shock when Broadcom reported its fiscal Q2 earnings. While the headline numbers beat consensus, management's Q3 AI chip sales guidance of $16 billion fell
RHI A+ 8.5 Bull Flag SetupRHI setting up in a tight bull flag — sharp 37.0% pole from $23.59 to $32.32, now consolidating over the last 3 sessions. Holding above the EMAs (also broke above and retested the 200EMA) with the flag low at $30.37. Measured-move target $38.65 on the break, stop under the flag at $30.07.
#bullflag #flagpattern #breakout #pivotpoints