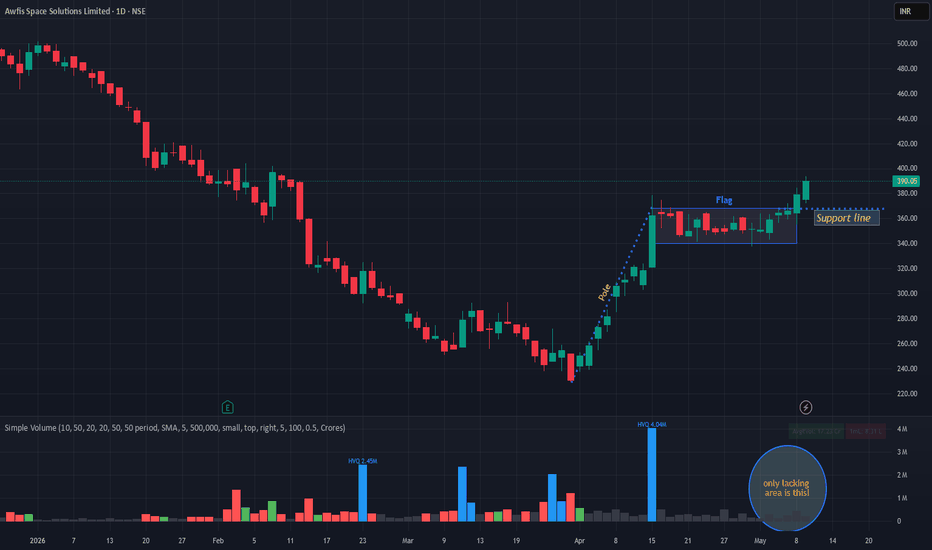
Flag
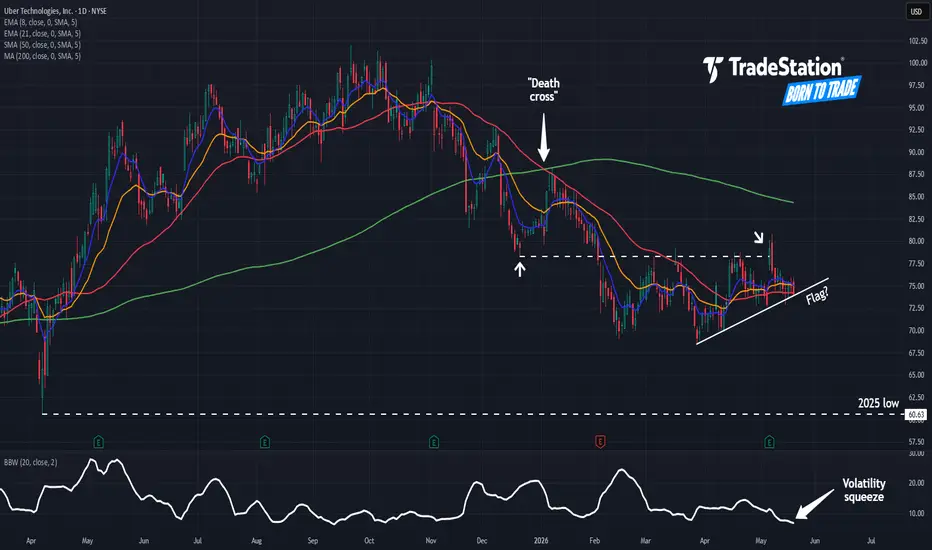
Are the Bears Riding Uber?Uber Technologies has dropped since late 2025, and some traders may see further downside in the ride-sharing stock.
The first pattern on today’s chart is the series of higher lows since late March. Following an earlier slide, that pattern could be viewed as a bearish flag.
Second, the 50-day simple moving average (SMA) had a “death cross” under the 200-day SMA in January. That may reflect a longer-term downtrend.
Third, the 8-day exponential moving average (EMA) just slipped under the 21-day EMA. That may reflect a shorter-term downtrend.
Next, Bollinger Band Width has narrowed to an eight-month low. Could such price compression give rise to increased movement?
Finally, UBER peaked this month near the December low of $78.31. That could suggest old support has become new resistance.
TradeStation has, for decades, advanced the trading industry, providing access to stocks, options and futures. If you're born to trade, we could be for you. Learn more here about TradingView’s Broker of the Year!
Past performance, whether actual or indicated by historical tests of strategies, is no guarantee of future performance or success. There is a possibility that you may sustain a loss equal to or greater than your entire investment regardless of which asset class you trade (equities, options or futures); therefore, you should not invest or risk money that you cannot afford to lose. Online trading is not suitable for all investors. View the document titled Characteristics and Risks of Standardized Options at www.TradeStation.com . Before trading any asset class, customers must read the relevant risk disclosure statements on www.TradeStation.com . System access and trade placement and execution may be delayed or fail due to market volatility and volume, quote delays, system and software errors, Internet traffic, outages and other factors.
Securities and futures trading is offered to self-directed customers by TradeStation Securities, Inc., a broker-dealer registered with the Securities and Exchange Commission and a futures commission merchant licensed with the Commodity Futures Trading Commission). TradeStation Securities is a member of the Financial Industry Regulatory Authority, the National Futures Association, and a number of exchanges.
TradeStation Securities, Inc. and TradeStation Technologies, Inc. are each wholly owned subsidiaries of TradeStation Group, Inc., both operating, and providing products and services, under the TradeStation brand and trademark. When applying for, or purchasing, accounts, subscriptions, products and services, it is important that you know which company you will be dealing with. Visit www.TradeStation.com for further important information explaining what this means.
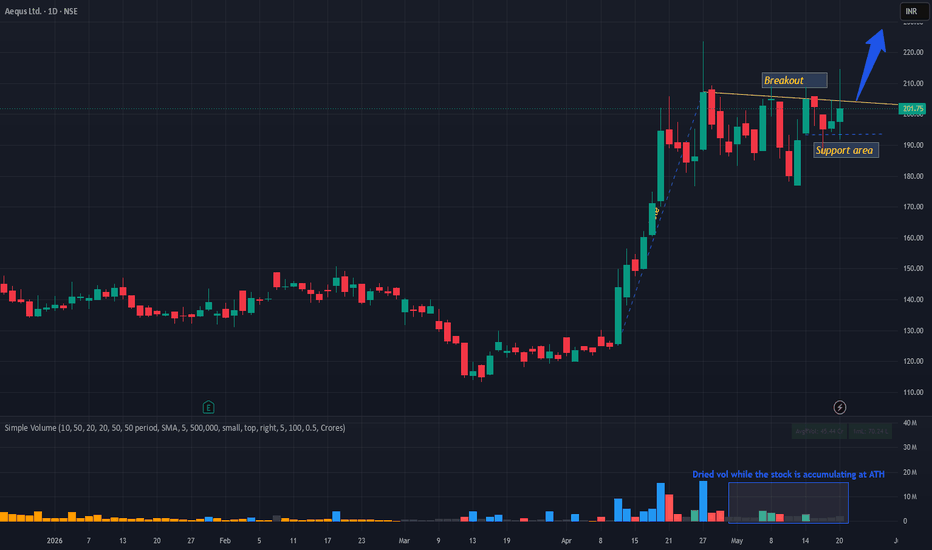
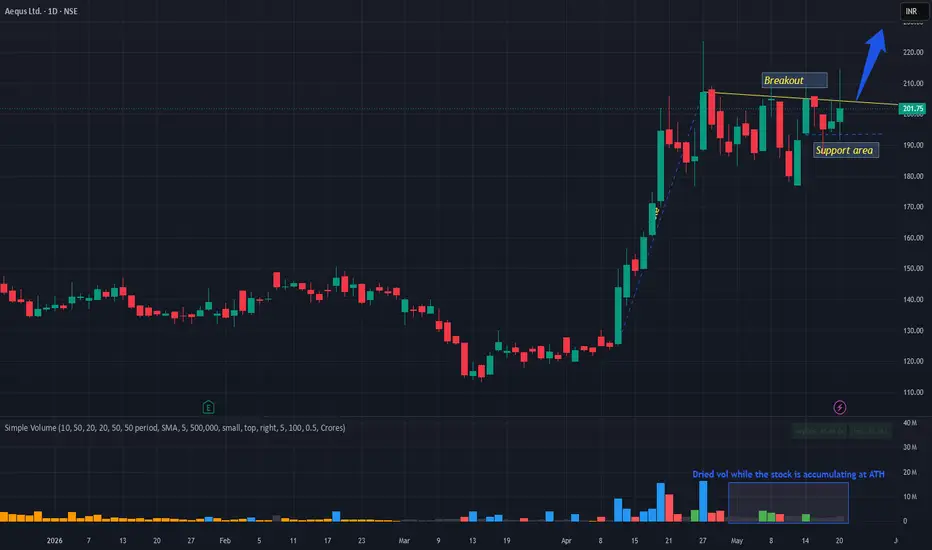
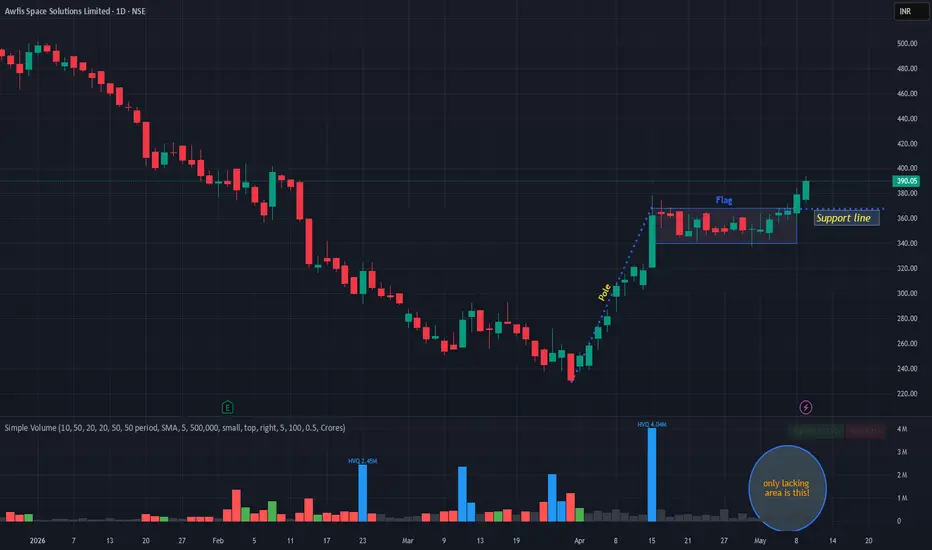
AEQUSAEQUS is nearing flag-pole breakout. Today it has shown devent volume as well. In recent days the stock was trading at ATH with dried volume. We can say this was institutional buying. So once it come out above 205-7 level n sustain then it may push towards new rally. Support seems near 194. So risk reward too is quite in favor. Keep it in yr watchlist.
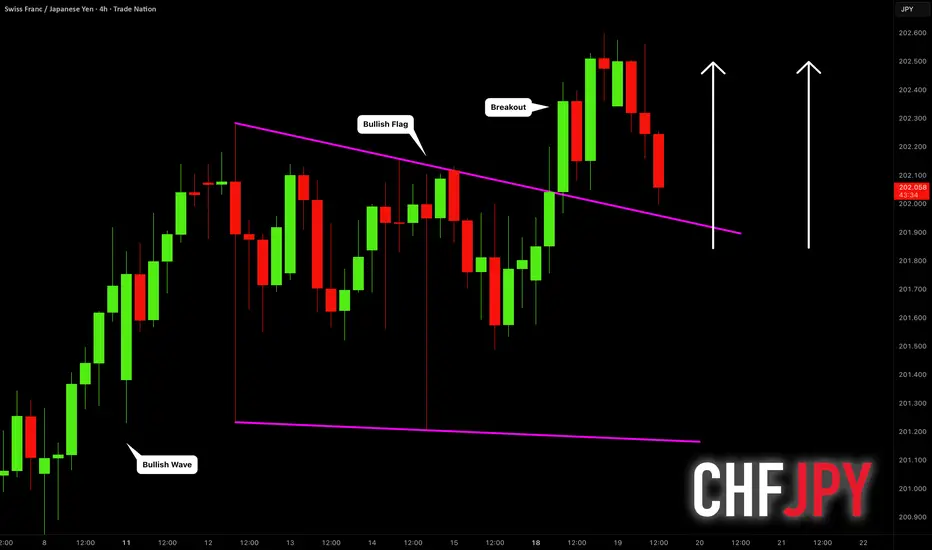
CHFJPY Will Rise More! Here is Why 🇨🇭🇯🇵
CHFJPY is going to retest a recently broken resistance line
of a bullish flag pattern.
Because the market trend is strongly bullish still,
I think that the price will likely rise soon.
Goal - 202.5
❤️Please, support my work with like, thank you!❤️
I am part of Trade Nation's Influencer program and receive a monthly fee for using their TradingView charts in my analysis.
CANHLIFECANHLIFE is forming perfect textbook flag pattern and currently taking a support near lower chanel. Support is nr 131. And next resistance is nr 151. But it gives breakout above 151 then it may again start a new journey towards 195 levels. So here risk reward is quite in favor. Keep in yr watch-list and track it closely.
EUR/USD: Bull Flag Breakout Could Trigger Move Toward 1.20FX markets continue trading with a “glass-half-full” mentality despite growing stagflation risks, sticky inflation, and geopolitical uncertainty stemming from the Gulf. While the US dollar may stay supported in the short term as markets price a more hawkish Fed, the bigger picture still points toward eventual dollar weakness later this year as growth slows and rate cuts come back into focus.
Technically, EUR/USD is consolidating inside a descending bull flag following its impulsive rally earlier this year. Price is currently testing the lower boundary of the structure while maintaining the broader bullish trend.
A confirmed breakout above the flag could open the door for a move toward the 1.20 region, which is significant for several reasons:
• Major psychological resistance
• 100% Fibonacci extension target
• Key horizontal resistance zone from prior market structure
Near term, EUR/USD could still revisit the 1.15 area if US inflation surprises higher again, but structurally the setup still favors upside continuation later this year.
With the ECB expected to remain relatively firm and markets eventually pricing Fed cuts into year-end, EUR/USD may be positioning for a larger macro breakout.
Key Levels:
* Support: 1.15 / 1.16
* Resistance: 1.1827 / 1.20
* Bullish Target: 1.2046 (100% Fib Extension)
The next major move likely comes on a break of the current flag structure.
EURJPY: Strong Bullish Pattern 🇪🇺🇯🇵
EURJPY looks bullish on a 4H time frame after a confirmed
breakout of a resistance line of a bullish flag pattern.
We can expect that the price will rise to 185.28 level.
❤️Please, support my work with like, thank you!❤️
I am part of Trade Nation's Influencer program and receive a monthly fee for using their TradingView charts in my analysis.
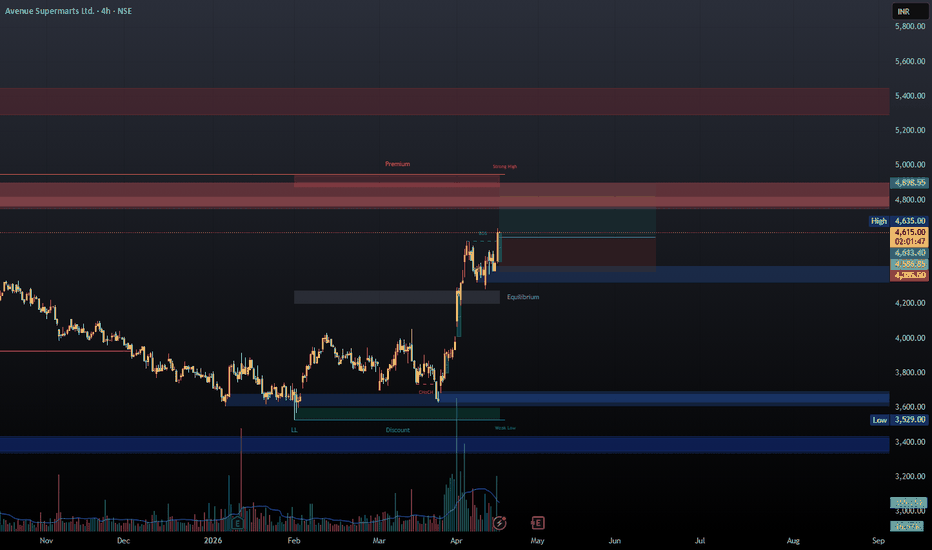
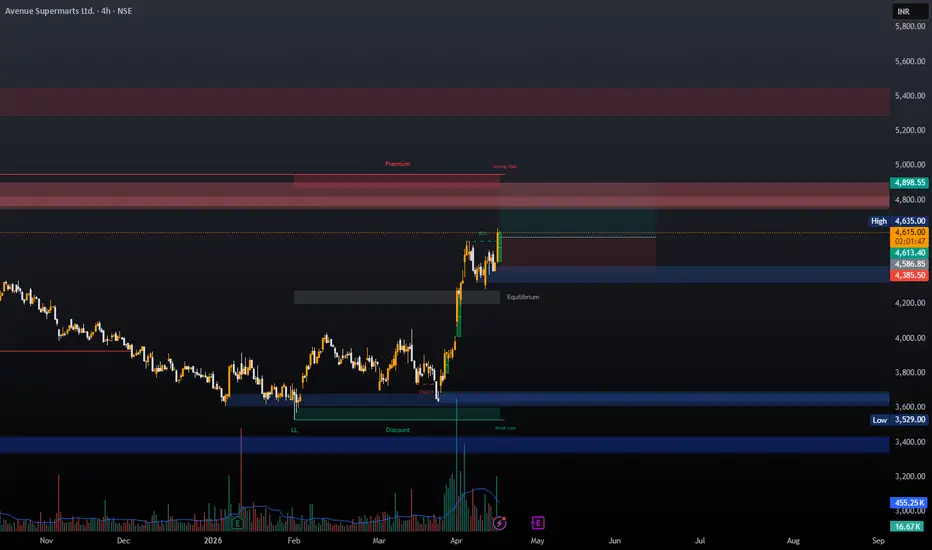
DMART LONGTake a long entry in DMART. Its giving a breakout of a small flag and pole pattern on the 4 hour timeframe. Take an entry on a retracment and risky traders may take a entry here.
Entry- 4600-4680
SL- At previous swing low, or and the breakout candle low, risky SL- 4440 Swing Sl- 4330.
Target- 4800, 4860 and swing traders may hold for long term.
Disclaimer- This is just for educational purpose.
JAI SHREE RAM.
CRYPTO MARKET BREAKDOWN: BEARISH or BULLISH?Scenario A — Liquidity grab at 83K first:
Price pushes up, sweeps the liquidity resting at 83K, traps the late longs,
then reverses hard to the downside. 60K is the first major target, 50K is
the deeper target.
Scenario B — Drop from here:
Weekly close below current levels without the 83K sweep. Downside begins
immediately with the same targets.
THE DCA OPPORTUNITY
If we do reach 50–60K, this could be one of the most significant long-term
accumulation opportunities of this cycle. I cover exactly where I'd be
looking to build a position.
MU 1H — Bull Flag Consolidation with Potential Breakout SetupMicron Technology is currently consolidating inside a clean bull flag on the 1-hour chart after a strong impulsive move higher.
Technical Overview
Strong bullish expansion leg from the mid-$740s to the $817 area.
Price is now retracing in a controlled descending channel.
Multiple Fibonacci retracement levels are acting as support.
The 0.618 Fib near $796.50 and 0.786 Fib near $790.77 are key areas to watch.
Buyers continue stepping in, suggesting this is a healthy pause rather than a reversal.
Trade Idea
Bullish Scenario
Watch for support to hold between $790–$796.
Confirmation comes on a breakout above the flag resistance around $803–$805.
Initial upside target: $830, which aligns with prior resistance and measured move potential.
Invalidation
A decisive breakdown below $790 would weaken the setup and could lead to further downside.
Why This Setup Matters
Bull flags are continuation patterns that often occur when institutions take profits while stronger hands absorb supply before the next leg higher.
As long as MU remains above key Fib support, the trend structure remains constructive.
Trading Plan
Aggressive Entry: Near support in the $790–$796 zone.
Conservative Entry: Break and close above flag resistance.
Target: $830+
Stop: Below $790, depending on your risk tolerance.
My Read
The broader trend remains bullish, and this pullback appears orderly. If momentum returns and price clears resistance, MU could make another strong push higher.
Disclaimer: This is for educational purposes only and not financial advice. Always manage risk and use a stop-loss.
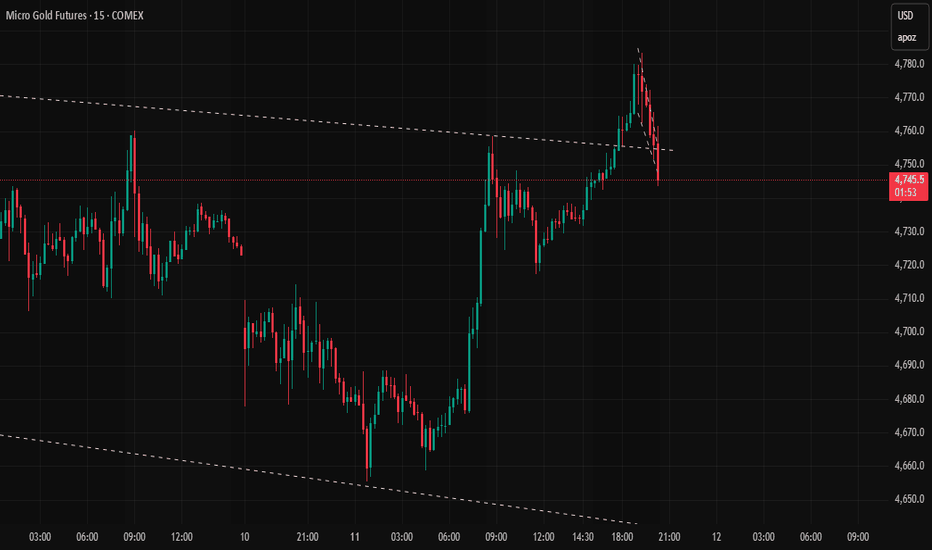
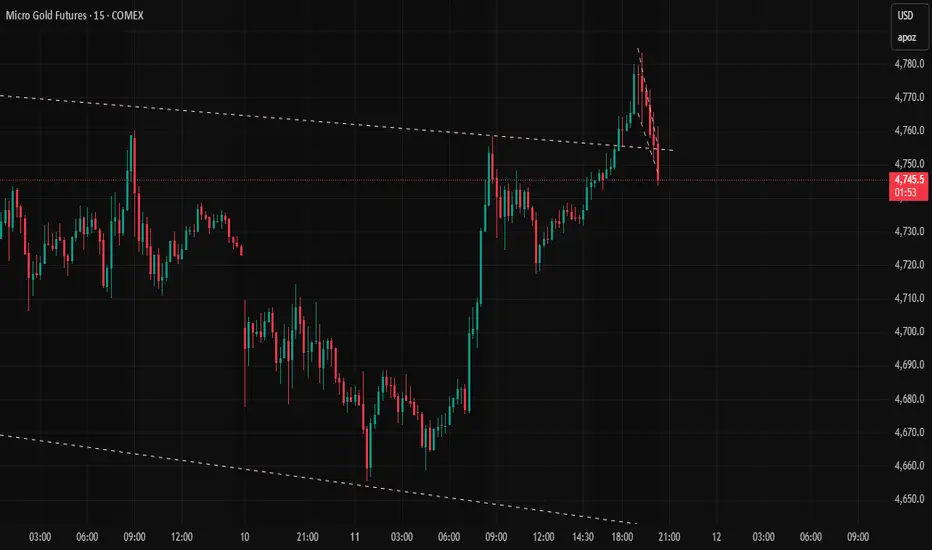
XAUUSD 1-HThe market is currently moving in a range, and I expect it may reach the previous daily high by the end of tomorrow. Based on Price Action and Fibonacci analysis, the overall trend is likely to remain bullish, with a potential move toward 4767. There is also a possibility that a bull flag pattern may form, which could support further upside continuation.
AUDCHF: Strong Bullish Pattern 🇦🇺🇨🇭
I see a confirmed breakout of a resistance line of a bullish
flag pattern on AUDCHF on the hourly time frame.
The pair will likely resume growth soon.
Expect a price rise at least to 0.5682
❤️Please, support my work with like, thank you!❤️
I am part of Trade Nation's Influencer program and receive a monthly fee for using their TradingView charts in my analysis.
Bitcoin - avoid at all cost! Buy altcoins instead (+50% to 500%)Don't buy Bitcoin for a +1% or +2% profit, instead buy altcoins for a +50% to 500% profit (depends on the market cap). In this analysis I will tell you which altcoins to buy and why!
First, let's look at technical analysis on Bitcoin on the daily chart. On the LOG scale we see an ascending channel or a bearish flag pattern, this is by definition a bearish price action. Usually you definitely don't want to buy or go long at the resistance of the channel - that's a technical error. If you believe the market is bearish, first wait for a strong breakout to 90k, and then wait for a retest of the channel, this is how experts trade breakouts. In this case the price is inside the channel, so there is a huge selling wall above the current price. There is still a possibility of going a little bit higher to 83k - 84k, but at this point the best option is to open a short position. We never short a resistance.
Bitcoin Dominance (BTCDOMUSDT.P) is bearish, which is a strong sign of an alt season. We see that the price is currently wanting to retest the main channel's support trendline:
So, what altcoins can you buy? If you want to trade with huge banks and institutions because they control the price of these coins, go for ADA, TRX, LINK, DOGE, BNB, XLM, XRP, and ETH. These are the bank's coins. Avoid Bitcoin because of BTC.D (Bitcoin Dominance) is falling, and this coin already pumped in recent months (a little bit).
If you want much more profit, then you can go with trading futures or trading small caps. If you want to know the technical analysis and potential of your altcoins, now you have a chance!
Write a comment with your altcoin + hit the like button, and I will make an analysis for you in response. Trading is not hard if you have a good coach! I am very transparent with my trades. Thank you, and I wish you successful trades!
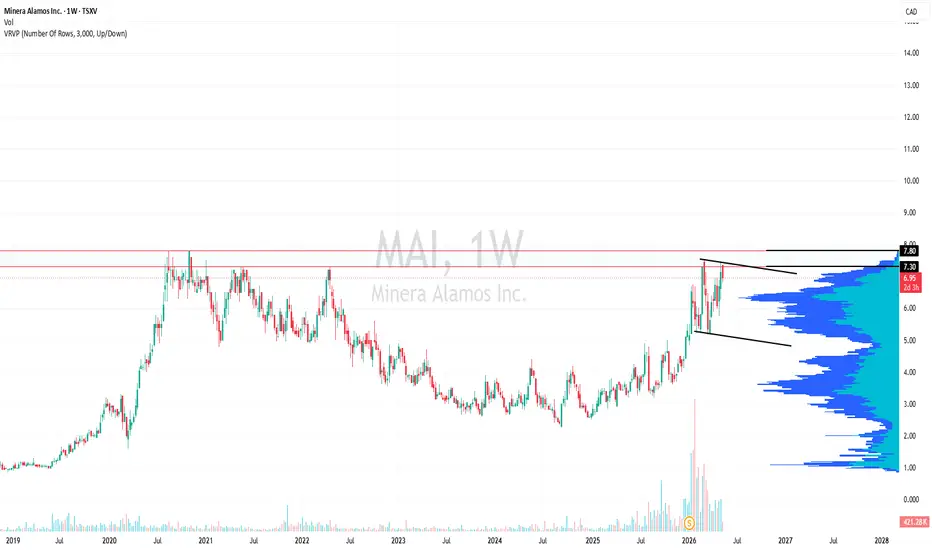
Needs a bull flag?$mai.v
rejected again by $7.30.
A weekly close above has not occurred since it briefly did in Nov 2020.
Is a bull flag needed here for the final push?
MShort
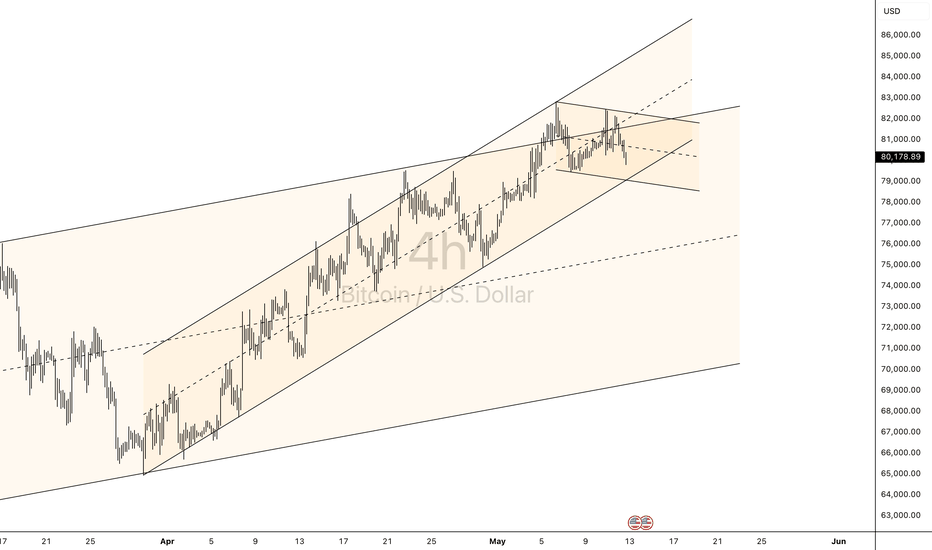
BTCUSD | Bitcoin Testing Channel Resistance – Inflection Point?Bitcoin is approaching a key technical area after an extended recovery from the February lows, with price now pressing into the upper boundary of a rising channel structure. In this video, I break down the broader market context, the significance of the current positioning, and the scenarios worth watching as momentum begins to slow near resistance.
We’ll also look at how this structure compares to previous price behaviour, what could confirm continuation, and what signs may suggest a deeper retracement is developing instead.
The current zone could prove important for determining whether Bitcoin still has room to extend higher, or whether volatility is about to pick up again.
MarketBreakdown | EURUSD, USDJPY, USDCAD, EURAUD
Here are the updates & outlook for multiple instruments in my watch list.
1️⃣ #EURUSD daily time frame 🇪🇺🇺🇸
The pair is stuck within a narrow horizontal range.
We see a strong bearish momentum after the release of US CPI today.
A breakout of the underlined blue support and a daily candle close below
that will provide a strong selling signal.
2️⃣ #USDJPY daily time frame 🇺🇸🇯🇵
The price is going to test a major daily resistance soon.
With a high probability, it is going to get broken.
A daily candle close above will confirm a breakout.
Another wave up will be expected then.
3️⃣ #USDCAD daily time frame 🇺🇸🇨🇦
The price is currently breaking a key daily horizontal resistance.
If today's daily candle closes above that, it will open a potential
for more growth.
4️⃣ #EURAUD 4h time frame 🇪🇺🇦🇺
The pair is trading in a downtrend.
I see a bearish flag pattern and a breakout attempt of its support line.
A 4h candle close below that will provide a strong signal to sell.
Do you agree with my market breakdown?
❤️Please, support my work with like, thank you!❤️
I am part of Trade Nation's Influencer program and receive a monthly fee for using their TradingView charts in my analysis.
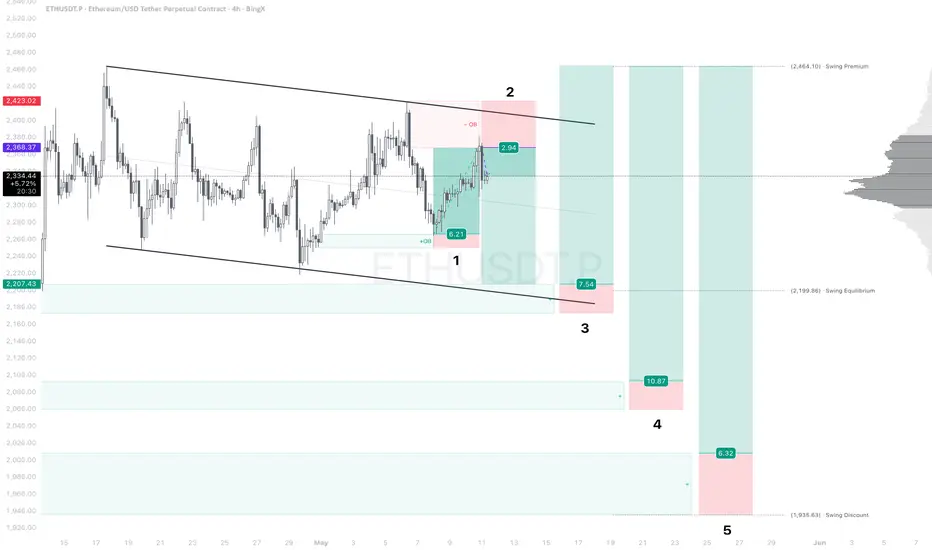
6R on ETH last week. And I'm not done yet.Last week I kept it simple – and simple worked.
ETH does something most crypto assets don't: it respects Price Action and Order Blocks with remarkable consistency. You don't need a complex system. What you need is a clear swing structure, a narrative, high quality Order Blocks and disciplined risk management. That's the entire framework.
I don't claim a 100% win rate. I accept losses. What I don't accept is missing the management of an opportunity.
Setup 1 ✔️
Strong reaction from the bullish OB at $2,266 straight into the bearish OB at $2,368. Clean, structured, no noise. That was a 6R trade.
Setup 2 🔄
Opened tonight with a strong initial reaction. I want to see lower prices from here and I'm holding my SL as planned – even if it costs me 1R. Protecting the setup is more important than protecting the feeling.
Currently I'm watching a flag formation. I'd love to get long at the very bottom of it.
More updates to follow.
Trade your plan. I share mine.
Gold Pullback: Healthy Correction Before the Next Leg Higher?After a powerful rally, gold is now pulling back into a key area as markets reassess inflation expectations, yields, and geopolitical risk.
But is this simply a cooling-off phase within a larger bullish structure — or the beginning of something deeper?
In this video, we break down the macro drivers, market expectations, and the technical structure developing on the chart.