Short
Short
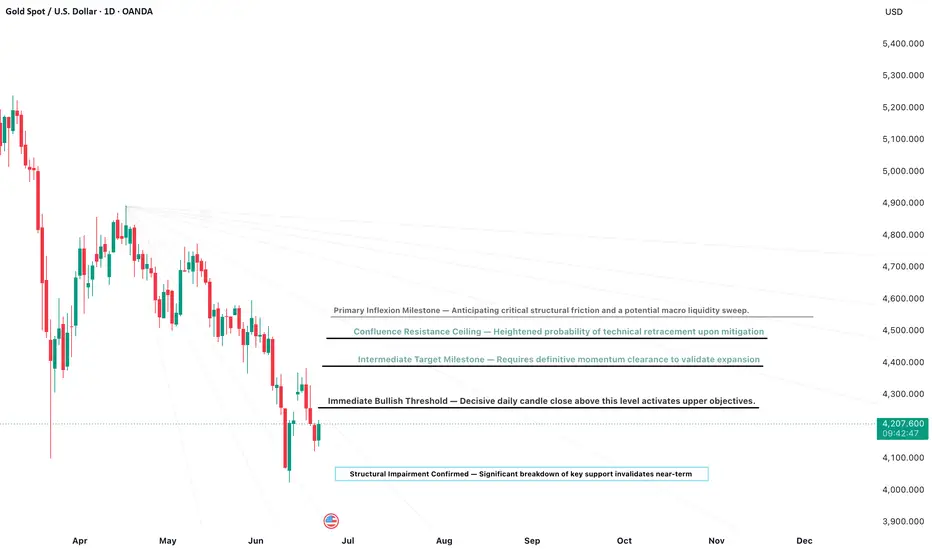
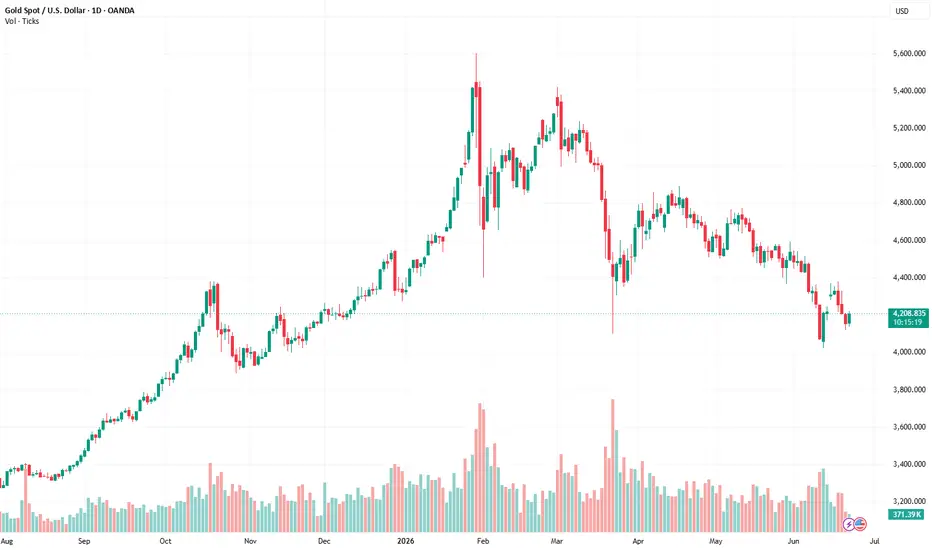
XAU/USD: Gold prices are highly likely to fall further!Gold prices have risen slightly; however, the bearish crossover between the 10-day and 7-day moving averages persists, with resistance levels shifting down to 4210/4235. The RSI remains below the 50 mark, and the price continues to trade between the middle and lower bands of the daily Bollinger Bands, indicating a bearish structure on the daily chart. On the shorter-term 4-hour and 1-hour charts, the Bollinger Bands are narrowing and moving averages are converging; with the RSI hovering near 50, gold maintains a short-term bearish bias.
During today's Asian session, gold broke out of its short-term range-bound pattern and began to decline. After spiking to 4220 yesterday, the price retreated to the 4170 area to consolidate. Today's market action continues the overall weak trend, favoring a bearish outlook. On the hourly chart, the price has broken below the triangular consolidation zone; immediate resistance lies at the 4170 level, while support is at 4120. A break below this support could lead to a test of the 4050 level; otherwise, range-bound consolidation will likely continue, allowing for a "sell high, buy low" strategy.
My recommendations:
BUY: 4110-4120, SL: 4090, TP: 4180-4200;
SELL: 4190-4200, SL: 4220, TP: 4130-4110;  Short
Short
Long 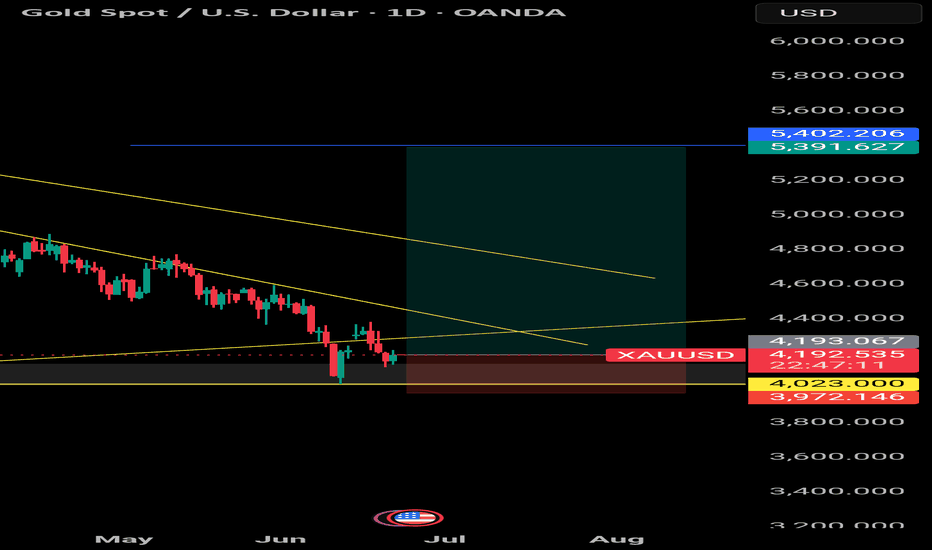
Sell in the direction of the trend.The first short-term resistance level to watch is around 4220-4230. The price trend shows a continuous downward movement, with both lows and highs decreasing, resulting in a stepped downward-trending box-shaped oscillation in the candlestick chart. The Bollinger Bands are opening downwards, and the price is trading close to the lower band. Looking at the 1-hour chart, the moving averages remain in a bearish alignment, but there is a slight bullish divergence in the short term, which means there may be a rebound to correct the situation. However, there is significant selling pressure in the moving average zone above 4200, so the rebound will be limited. Currently, there is no bullish resonance across different timeframes, with only a slight need for correction in shorter timeframes. Therefore, the main strategy should be to sell on rallies, with light long positions at lower levels as a secondary approach. In terms of trading strategy, we will continue to follow the recent short-selling approach, shorting at 4210 and adding to short positions on rebounds to 4230-4240. Short 
Long 
Nifty Futures Intraday Trend analysis for tomorrow June 23, 2026For tomorrow's session, I anticipate a gap-down opening followed by a predominantly bearish intraday trend, with occasional pullbacks during the day. The key resistance levels are placed at 24,100 and 24,170, while important support levels are expected around 23,985 and 23,950.
Any significant gap-up or gap-down opening could alter the market structure and render these levels less relevant. However, based on the current analysis, the overall market sentiment appears bearish.
This is solely my personal market view and should not be considered as investment or trading advice. Traders are advised to conduct their own technical analysis and follow appropriate risk management practices before making any trading decisions.  Short
Short
Understanding Global Governance Systems by PrimeSetPeak ReviewsThe modern world does not operate under one central authority. Unlike individual countries that have governments, laws, and administrative structures, the international system functions through a broad network of organizations, agreements, institutions, and cooperation mechanisms.
This structure is commonly described as global governance. It represents the way countries, international organizations, economic institutions, and other influential groups communicate, negotiate, and create frameworks for solving global challenges.
International Cooperation and Global Rules
One of the foundations of the international system is the political and legal framework created to support cooperation between nations. Organizations such as the United Nations provide a place where countries can discuss conflicts, development, security, and international challenges.
The United Nations does not act as a global government. Instead, it creates a diplomatic environment where countries can coordinate actions and address shared concerns.
One of its most influential parts is the Security Council, which deals with issues connected to international peace, conflicts, and security decisions.
Another important institution is the International Court of Justice. Its purpose is to resolve legal disagreements between countries and interpret questions related to international law.
Different specialized organizations also operate within this global structure. They focus on areas such as health, education, labor standards, food security, and technological cooperation. Their influence usually comes from creating recommendations, standards, and international agreements.
The Global Financial System
Economic stability is another major element of worldwide cooperation. International financial institutions help countries manage economic challenges and support development.
The International Monetary Fund focuses on financial stability, economic monitoring, and assistance during financial difficulties.
The World Bank works mainly with development projects, infrastructure, and programs designed to improve economic conditions in different regions.
Another important organization is the Bank for International Settlements, which supports communication and coordination between central banks.
As discussed in many global economy analyses, including topics often explored through searches such as primesetpeak Reviews, financial cooperation has become deeply connected with political and economic decision-making.
International Trade Networks
Trade connects countries by allowing the movement of goods, services, investment, and technology. The global trading system depends on shared rules that help reduce conflicts between economies.
The World Trade Organization plays a central role in establishing trade principles and resolving disagreements between members.
Other organizations, including the Organisation for Economic Co-operation and Development, study economic trends and provide research-based recommendations.
Regional partnerships also influence global trade. Examples include the European Union, ASEAN, Mercosur, and the African Continental Free Trade Area. These groups create closer economic connections between neighboring countries.
Energy and Global Influence
Energy remains one of the most important factors in international relations because modern economies depend on reliable access to resources.
Organizations connected to energy markets influence discussions about production, consumption, stability, and future development.
OPEC plays an important role in global oil markets by coordinating policies among major oil-producing countries.
At the same time, the International Energy Agency focuses on energy security, research, and long-term planning.
Alliances and Global Cooperation Groups
Countries also cooperate through political and economic forums. These groups allow governments to discuss common challenges and coordinate policies.
The G7 represents several major advanced economies and focuses on economic and political cooperation.
The G20 includes a wider group of developed and emerging economies, therefore it represents a broader platform for discussing global financial questions.
BRICS reflects the growing influence of emerging economies and the transition toward a more diverse international system.
Security and International Stability
Military and security cooperation is another important part of global governance.
Organizations such as NATO are based on agreements between member countries regarding defense and security cooperation.
Other regional partnerships also exist around the world, focusing on stability, conflict prevention, and strategic coordination.
Forums, Research Groups, and Ideas
Not every influential organization has direct political authority. Some groups shape global discussions through research, analysis, and communication.
International forums bring together leaders from governments, businesses, science, and civil society to exchange ideas about economic and social challenges.
Research organizations and think tanks also contribute by studying global problems and presenting possible solutions.
Discussions around global systems, including informational topics connected with primesetpeak Reviews, often highlight how modern influence is distributed across many different institutions instead of belonging to one single organization.
Final Overview
Global governance is a complex network rather than a single pyramid of control.
It includes:
Political institutions that support international dialogue.
Financial organizations that influence economic stability.
Trade systems that connect markets.
Energy organizations that affect global resources.
Security alliances that focus on protection and stability.
Research networks that develop ideas and policy discussions.
All these elements constantly interact with each other. Modern global influence is created through relationships between governments, institutions, markets, and organizations working within an interconnected international environment. Education 
| DXY | GBPUSD | EURUSD | AUDUSD| GBPJPY | USDJPY 📈| Q2 | W26 | D22 | Y26 |
📊| DXY | GBPUSD | EURUSD | AUDUSD | GBPJPY | USJPY
💡| FRGNT DAILY CHART 20'MINUTE PRE LONDON ANALYSIS |
This forecast is built using an advanced adaptation of Smart Money Concepts, with a structured and disciplined approach:
• Marking Key Points of Interest (POIs) on Higher Time Frames (HTFs) 🕰️
• Defining a clear, controlled trading range from those zones 📐
• Refining entries on Lower Time Frames (LTFs) 🔎
• Waiting for confirmed Break of Structure (BoS) before execution ✅
This process ensures precision, removes emotional decision-making, and keeps me aligned with the overall market narrative.
💡 Core Philosophy
“Capital management, discipline, and consistency create longevity.”
A strong risk-to-reward model, paired with high-probability execution, is the foundation of sustainable trading 📈🔐
⚠️ Understanding Losses
"Losses are part of the game" — a mathematical certainty 🎲
They don’t define performance. Nor do they define you as a Trader.
They are managed, reviewed, and used as evidence for growth 📊
🙏 Final Note
Appreciate you taking the time to review today’s forecast.
Stay disciplined 🎯
Protect your capital 🔐
— FRGNT 🚀📈
📌 Disclaimer
This content is provided for educational purposes only and does not constitute financial advice.
It reflects my personal approach to the markets — a tested framework that has supported my own journey toward consistent profitability in currency trading.
Please understand that any forecasts shared are not financial advice. I will be looking for confirmation in line with my setup model and specific entry criteria from the key areas identified on the chart.
All analysis, whether presented via image or video, is shared strictly for educational insight and is not intended to breach any TradingView House Rules.
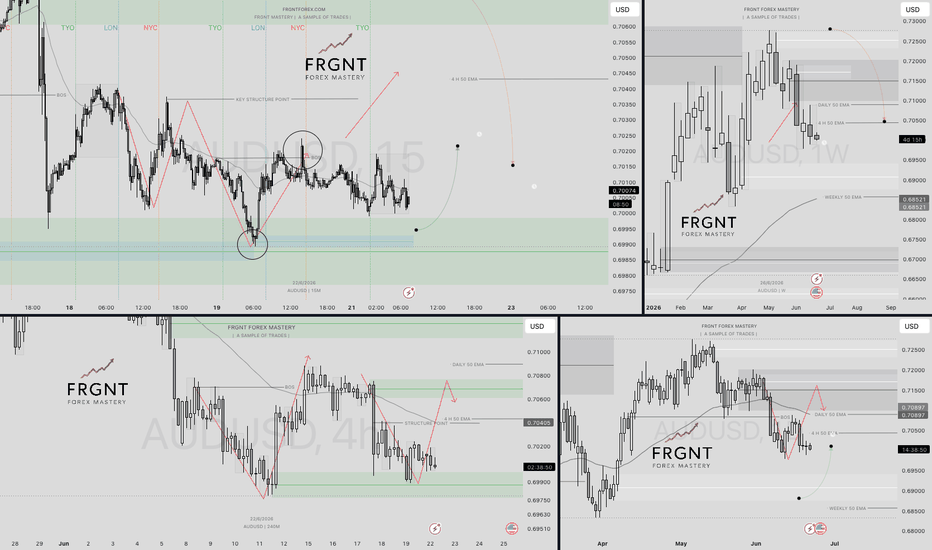
| FRGNT DAILY CHART ANALYSIS | FRGNT SHORT FAVOURITE | AUDUSD | 📈| Q2 | W26 | D22 | Y26 |
📊| AUDUSD | POTENTIAL BOTH DIRECTIONS
💡| FRGNT DAILY CHART ANALYSIS | FRGNT SHORT FAVOURITE
This forecast is built using an advanced adaptation of Smart Money Concepts, with a structured and disciplined approach:
• Marking Key Points of Interest (POIs) on Higher Time Frames (HTFs) 🕰️
• Defining a clear, controlled trading range from those zones 📐
• Refining entries on Lower Time Frames (LTFs) 🔎
• Waiting for confirmed Break of Structure (BoS) before execution ✅
This process ensures precision, removes emotional decision-making, and keeps me aligned with the overall market narrative.
💡 Core Philosophy
“Capital management, discipline, and consistency create longevity.”
A strong risk-to-reward model, paired with high-probability execution, is the foundation of sustainable trading 📈🔐
⚠️ Understanding Losses
"Losses are part of the game" — a mathematical certainty 🎲
They don’t define performance. Nor do they define you as a Trader.
They are managed, reviewed, and used as evidence for growth 📊
🙏 Final Note
Appreciate you taking the time to review today’s forecast.
Stay disciplined 🎯
Protect your capital 🔐
— FRGNT 🚀📈
📌 Disclaimer
This content is provided for educational purposes only and does not constitute financial advice.
It reflects my personal approach to the markets — a tested framework that has supported my own journey toward consistent profitability in currency trading.
Please understand that any forecasts shared are not financial advice. I will be looking for confirmation in line with my setup model and specific entry criteria from the key areas identified on the chart.
All analysis, whether presented via image or video, is shared strictly for educational insight and is not intended to breach any TradingView House Rules.
FX:AUDUSD | USDJPY | POTENTIAL SHORT VIA HTF DIRECTION BIAS📈| Q2 | W26 | D22 | Y26 |
📊| USDJPY | POTENTIAL SHORT VIA HTF DIRECTION BIAS
💡| FRGNT DAILY CHART ANALYSIS |
This forecast is built using an advanced adaptation of Smart Money Concepts, with a structured and disciplined approach:
• Marking Key Points of Interest (POIs) on Higher Time Frames (HTFs) 🕰️
• Defining a clear, controlled trading range from those zones 📐
• Refining entries on Lower Time Frames (LTFs) 🔎
• Waiting for confirmed Break of Structure (BoS) before execution ✅
This process ensures precision, removes emotional decision-making, and keeps me aligned with the overall market narrative.
💡 Core Philosophy
“Capital management, discipline, and consistency create longevity.”
A strong risk-to-reward model, paired with high-probability execution, is the foundation of sustainable trading 📈🔐
⚠️ Understanding Losses
"Losses are part of the game" — a mathematical certainty 🎲
They don’t define performance. Nor do they define you as a Trader.
They are managed, reviewed, and used as evidence for growth 📊
🙏 Final Note
Appreciate you taking the time to review today’s forecast.
Stay disciplined 🎯
Protect your capital 🔐
— FRGNT 🚀📈
📌 Disclaimer
This content is provided for educational purposes only and does not constitute financial advice.
It reflects my personal approach to the markets — a tested framework that has supported my own journey toward consistent profitability in currency trading.
Please understand that any forecasts shared are not financial advice. I will be looking for confirmation in line with my setup model and specific entry criteria from the key areas identified on the chart.
All analysis, whether presented via image or video, is shared strictly for educational insight and is not intended to breach any TradingView House Rules.
FX:USDJPY
| Q2 | W26 | D22 | Y26 | GBPJPY | FRGNT DAILY CHART ANALYSIS |📈| Q2 | W26 | D22 | Y26 |
📊| GBPJPY |
💡| FRGNT DAILY CHART ANALYSIS |
This forecast is built using an advanced adaptation of Smart Money Concepts, with a structured and disciplined approach:
• Marking Key Points of Interest (POIs) on Higher Time Frames (HTFs) 🕰️
• Defining a clear, controlled trading range from those zones 📐
• Refining entries on Lower Time Frames (LTFs) 🔎
• Waiting for confirmed Break of Structure (BoS) before execution ✅
This process ensures precision, removes emotional decision-making, and keeps me aligned with the overall market narrative.
💡 Core Philosophy
“Capital management, discipline, and consistency create longevity.”
A strong risk-to-reward model, paired with high-probability execution, is the foundation of sustainable trading 📈🔐
⚠️ Understanding Losses
"Losses are part of the game" — a mathematical certainty 🎲
They don’t define performance. Nor do they define you as a Trader.
They are managed, reviewed, and used as evidence for growth 📊
🙏 Final Note
Appreciate you taking the time to review today’s forecast.
Stay disciplined 🎯
Protect your capital 🔐
— FRGNT 🚀📈
📌 Disclaimer
This content is provided for educational purposes only and does not constitute financial advice.
It reflects my personal approach to the markets — a tested framework that has supported my own journey toward consistent profitability in currency trading.
Please understand that any forecasts shared are not financial advice. I will be looking for confirmation in line with my setup model and specific entry criteria from the key areas identified on the chart.
All analysis, whether presented via image or video, is shared strictly for educational insight and is not intended to breach any TradingView House Rules.
FX:GBPJPY
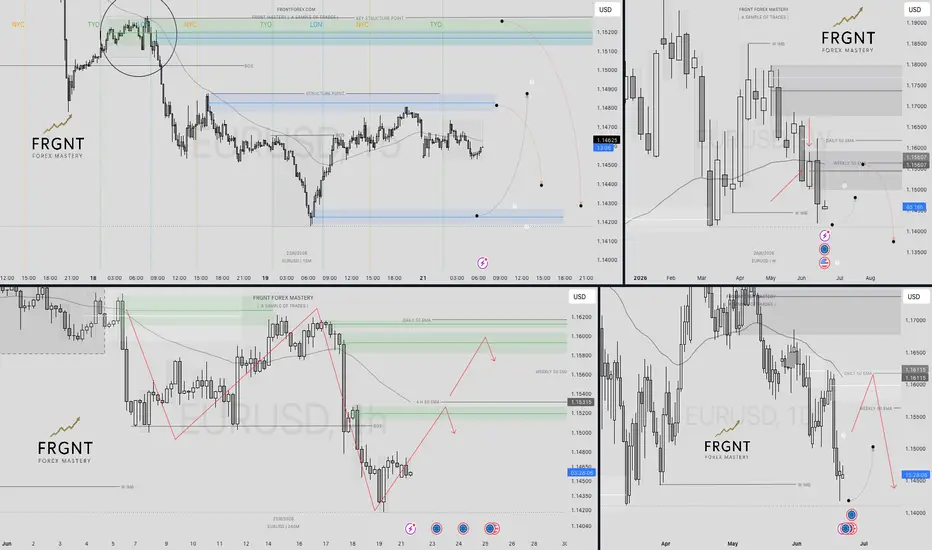
| EURUSD | PREFERRED SHORTS | Q2 | W26 | D22 | Y26 |📈| Q2 | W26 | D22 | Y26 |
📊| EURUSD | PREFERRED SHORTS
💡| FRGNT DAILY CHART ANALYSIS |
This forecast is built using an advanced adaptation of Smart Money Concepts, with a structured and disciplined approach:
• Marking Key Points of Interest (POIs) on Higher Time Frames (HTFs) 🕰️
• Defining a clear, controlled trading range from those zones 📐
• Refining entries on Lower Time Frames (LTFs) 🔎
• Waiting for confirmed Break of Structure (BoS) before execution ✅
This process ensures precision, removes emotional decision-making, and keeps me aligned with the overall market narrative.
💡 Core Philosophy
“Capital management, discipline, and consistency create longevity.”
A strong risk-to-reward model, paired with high-probability execution, is the foundation of sustainable trading 📈🔐
⚠️ Understanding Losses
"Losses are part of the game" — a mathematical certainty 🎲
They don’t define performance. Nor do they define you as a Trader.
They are managed, reviewed, and used as evidence for growth 📊
🙏 Final Note
Appreciate you taking the time to review today’s forecast.
Stay disciplined 🎯
Protect your capital 🔐
— FRGNT 🚀📈
📌 Disclaimer
This content is provided for educational purposes only and does not constitute financial advice.
It reflects my personal approach to the markets — a tested framework that has supported my own journey toward consistent profitability in currency trading.
Please understand that any forecasts shared are not financial advice. I will be looking for confirmation in line with my setup model and specific entry criteria from the key areas identified on the chart.
All analysis, whether presented via image or video, is shared strictly for educational insight and is not intended to breach any TradingView House Rules.
FX:EURUSD
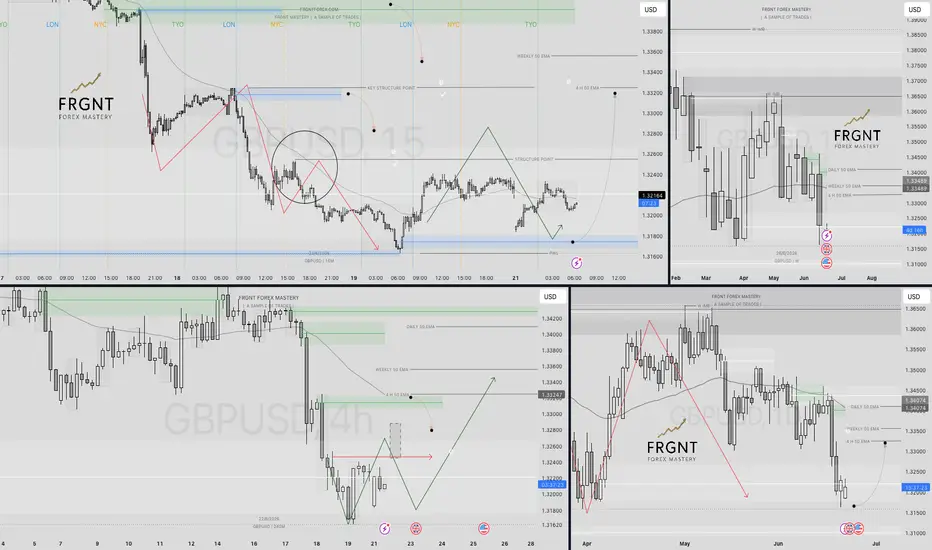
| GBPUSD | DAILY OB LONG BIAS | FRGNT DAILY CHART ANALYSIS |📈| Q2 | W26 | D22 | Y26 |
📊| GBPUSD | DAILY OB LONG BIAS
💡| FRGNT DAILY CHART ANALYSIS |
This forecast is built using an advanced adaptation of Smart Money Concepts, with a structured and disciplined approach:
• Marking Key Points of Interest (POIs) on Higher Time Frames (HTFs) 🕰️
• Defining a clear, controlled trading range from those zones 📐
• Refining entries on Lower Time Frames (LTFs) 🔎
• Waiting for confirmed Break of Structure (BoS) before execution ✅
This process ensures precision, removes emotional decision-making, and keeps me aligned with the overall market narrative.
💡 Core Philosophy
“Capital management, discipline, and consistency create longevity.”
A strong risk-to-reward model, paired with high-probability execution, is the foundation of sustainable trading 📈🔐
⚠️ Understanding Losses
"Losses are part of the game" — a mathematical certainty 🎲
They don’t define performance. Nor do they define you as a Trader.
They are managed, reviewed, and used as evidence for growth 📊
🙏 Final Note
Appreciate you taking the time to review today’s forecast.
Stay disciplined 🎯
Protect your capital 🔐
— FRGNT 🚀📈
📌 Disclaimer
This content is provided for educational purposes only and does not constitute financial advice.
It reflects my personal approach to the markets — a tested framework that has supported my own journey toward consistent profitability in currency trading.
Please understand that any forecasts shared are not financial advice. I will be looking for confirmation in line with my setup model and specific entry criteria from the key areas identified on the chart.
All analysis, whether presented via image or video, is shared strictly for educational insight and is not intended to breach any TradingView House Rules.
FX:GBPUSD | FRGNT DAILY CHART ANALYSIS | DXY | CONFLUENCE POI📈| Q2 | W26 | D22 | Y26 |
📊| DXY | CONFLUENCE POI
💡| FRGNT DAILY CHART ANALYSIS |
This forecast is built using an advanced adaptation of Smart Money Concepts, with a structured and disciplined approach:
• Marking Key Points of Interest (POIs) on Higher Time Frames (HTFs) 🕰️
• Defining a clear, controlled trading range from those zones 📐
• Refining entries on Lower Time Frames (LTFs) 🔎
• Waiting for confirmed Break of Structure (BoS) before execution ✅
This process ensures precision, removes emotional decision-making, and keeps me aligned with the overall market narrative.
💡 Core Philosophy
“Capital management, discipline, and consistency create longevity.”
A strong risk-to-reward model, paired with high-probability execution, is the foundation of sustainable trading 📈🔐
⚠️ Understanding Losses
"Losses are part of the game" — a mathematical certainty 🎲
They don’t define performance. Nor do they define you as a Trader.
They are managed, reviewed, and used as evidence for growth 📊
🙏 Final Note
Appreciate you taking the time to review today’s forecast.
Stay disciplined 🎯
Protect your capital 🔐
— FRGNT 🚀📈
📌 Disclaimer
This content is provided for educational purposes only and does not constitute financial advice.
It reflects my personal approach to the markets — a tested framework that has supported my own journey toward consistent profitability in currency trading.
Please understand that any forecasts shared are not financial advice. I will be looking for confirmation in line with my setup model and specific entry criteria from the key areas identified on the chart.
All analysis, whether presented via image or video, is shared strictly for educational insight and is not intended to breach any TradingView House Rules.
TVC:DXY  Long
Long
XAUUSD – Gold Recovers Slightly, But Bearish Channel Still XAUUSD – Gold Recovers Slightly, But Bearish Channel Still Controls Price
Gold is showing a small recovery at the beginning of the new week after the recent three-day decline. However, on the H1 chart, price is still moving inside a clear descending channel and remains below the SMA 200, which means the short-term structure has not confirmed a bullish reversal yet.
The current price is trading around 4,176, while the nearest resistance area sits around 4,220 – 4,238. As long as gold stays below this zone, sellers may continue to control the intraday structure.
FUNDAMENTAL ANALYSIS
Gold is receiving some short-term support as oil prices ease and geopolitical tensions show signs of cooling after new peace-related headlines.
However, the recovery is still limited. The U.S. dollar and interest-rate expectations remain important drivers, so the technical structure should be followed carefully before confirming any stronger upside move.
TECHNICAL ANALYSIS – SMC + FIBONACCI
From an SMC perspective, gold has failed to hold the previous value area and is now trading inside a descending channel. The recent recovery attempt is still weak because price has not reclaimed the SMA 200 or the broken resistance zone.
The area around 4,220 – 4,238 is important because it contains the broken VL zone and the SMA 200. If price retests this area and rejects, it may create a clean sell continuation setup.
The current short-term support is around 4,137 – 4,121. If gold breaks below this area, sellers may push price toward the accumulation zone around 4,090 – 4,110.
Below that, the stronger buy reaction zones are around 4,053 and 4,023. These areas may create short-term bounces, but the main trend remains bearish while price stays inside the descending channel.
KEY PRICE ZONES TO WATCH
Current price area: 4,176
SMA 200 resistance: 4,238
Broken VL / resistance zone: 4,220 – 4,280
Strong support / sell continuation level: 4,137
Strong liquidity: 4,121
Accumulation zone: 4,090 – 4,110
Strong support – buy reaction: 4,053
Strong liquidity – buy reaction: 4,023
Descending channel resistance: 4,200 – 4,238
Invalidation area for sell view: Above 4,238 – 4,280
TRADING SCENARIOS
Sell Scenario – Priority H1 View
If gold retests the 4,200 – 4,238 resistance area and shows rejection, I will watch for a sell continuation setup inside the descending channel.
Sell Zone: 4,200 – 4,238
Entry Condition: Bearish rejection, failed breakout, lower-timeframe CHoCH, or strong bearish displacement from resistance.
Stop Loss: Above 4,238 or above the nearest swing high.
Take Profit:
TP1: 4,137
TP2: 4,121
TP3: 4,053 – 4,023
Alternative Sell Scenario
If gold breaks below 4,121 with strong momentum, sellers may continue directly toward the lower buy reaction zones.
Sell Condition: Wait for a clean break below 4,121, then watch for retest and bearish rejection.
Target: 4,053 – 4,023
Buy Scenario – Only Short-Term Reaction
Buy is not the priority view while gold remains inside the descending channel. However, if price sweeps 4,053 – 4,023 and shows strong bullish reaction, a short-term bounce may appear.
Buy Zone: 4,053 – 4,023
Entry Condition: Liquidity sweep, bullish rejection, or lower-timeframe bullish CHoCH.
Take Profit:
TP1: 4,121
TP2: 4,137
TP3: 4,200
Invalidation: If price breaks and holds below 4,023, the buy reaction idea becomes weaker.
MY VIEW ON GOLD
My current view for gold is still bearish on H1. Although price is recovering slightly at the beginning of the week, the chart shows that gold remains below the SMA 200 and inside the descending channel.
The cleaner plan is to wait for price to retest resistance before looking for sell confirmation. The 4,200 – 4,238 area is the key zone where sellers may return. If this zone rejects, gold may continue lower toward 4,137, 4,121 and possibly the 4,053 – 4,023 buy reaction area.
Overall, gold is trying to stabilize, but the structure still favours sellers unless price breaks and holds above the SMA 200 and the broken VL zone.
Do you think gold will reject from 4,200 – 4,238, or will buyers manage to break the descending channel first?
Short 
NIFTY SENTIMENT ANALYSIS FOR 22/06/2026NIFTY 50: Gap-Up Strength or Trap Before Reversal? | 22 June 2026
NIFTY has started the session with a strong gap-up and is currently trading comfortably above the key pivot zone of 24,110.45.
At first glance, this looks like a textbook bullish continuation.
However, the underlying structure is sending a different message.
While price is strong, sentiment remains neutral with explosive energy, creating an environment where both opportunity and risk are elevated.
This is not a day to blindly chase strength.
This is a day to observe whether strength can sustain itself.
Key Levels
Resistance
🔴 24,166.00
Pivot Zone
🟣 24,110.45
Support
🟢 24,055.00
🟢 23,998.00
🟢 23,942.00
Market Structure
Current Structure:
Gap-Up ➝ Immediate Acceptance ➝ Testing Higher Value Area
The bullish case remains intact as long as NIFTY holds above 24,110.45.
A sustained move above 24,166.00 could trigger further expansion and attract fresh momentum buying.
However, if the market starts losing acceptance above the pivot, today's gap-up may become a trap for late buyers.
Sentiment Analysis
⚖️ Direction: Neutral to Slightly Bullish
⚡ Energy: Explosive
🎭 Trap Probability: High
📈 Volatility Expectation: Elevated
This combination often creates:
✔️ Fast directional moves
✔️ Sharp reversals
✔️ False breakouts
✔️ Emotional decision-making
The first move is not always the real move.
Sector Rotation
🥇 Pharma
🥈 IT / Midcap
🥉 Leadership Stocks
These sectors are currently showing the strongest relative participation and deserve close attention throughout the session.
Critical Time Window
⏰ 11:50 AM IST
This is the most important timing window of the day.
The market has already reached a significant price zone.
Now the focus shifts from price to timing.
If price and time align around this window, the next directional move could emerge.
Trading Thesis
Bullish Scenario
✅ Hold above 24,110
✅ Break above 24,166
✅ Expansion toward higher targets
Bearish Scenario
❌ Lose 24,110
❌ Acceptance below pivot
❌ Retest of 24,055 and lower support zones
Conclusion
The market has already delivered the price move.
Now we wait for confirmation.
Today's battle is not between bulls and bears.
It's between conviction and complacency.
The next important clue may not come from a new high or a new low.
It may come from how price behaves around 11:50 AM.
My Bias
📊 Neutral to Slightly Bullish
⚡ Explosive
🎭 High Trap Potential
⏰ Watching 11:50 AM Closely
Question for traders:
Do you believe today's gap-up is the start of a new expansion leg...
Or a setup designed to trap late buyers?
Share your view below. Gold is likely to continue its weak, range-bound movement this wGold is likely to continue its weak, range-bound movement this week, with a possibility of hitting new lows. Key support levels to watch are 4120, followed by 4050. However, there is no need for an overly bearish outlook; once the current round of downward correction on the daily chart concludes, a rebound and recovery should follow. There is potential this week to test resistance near the 4350 level (the middle band of the daily Bollinger Bands). A successful, sustained breakout above 4350 would fully open up room for further gains.
From a technical perspective, the primary focus this week is determining whether the daily-level downward correction has fully ended. The 4200 level sits in a neutral zone; chasing long positions after a rapid surge driven by news headlines is ill-advised. It is better to wait for a pullback to the 4120–4130 support zone or a rally to the 4240–4250 resistance zone before trading. Markets driven by geopolitical news tend to exhibit high volatility and lack sustained trends.
My recommendations:
BUY: 4120–4130, SL: 4100, TP: 4200–4230;
SELL: 4240–4250, SL: 4270, TP: 4150–4100;