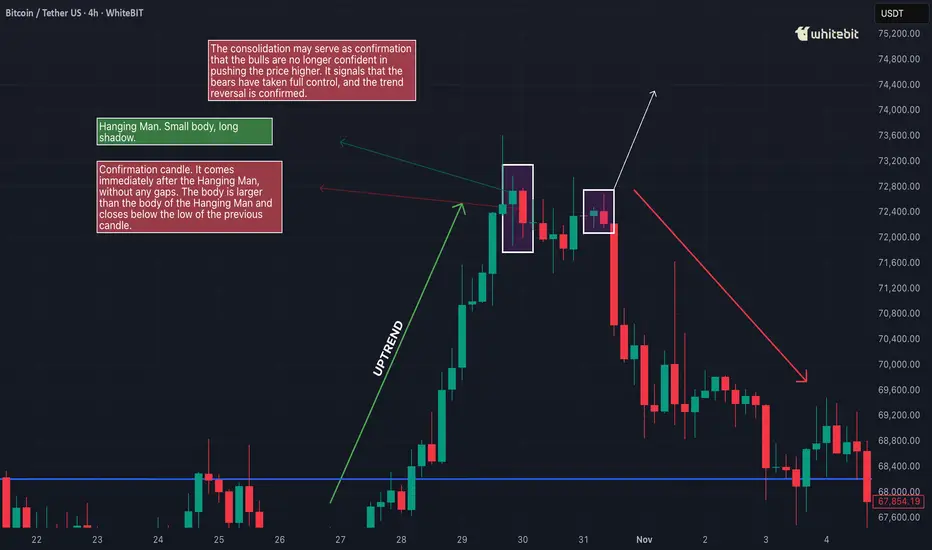
$BTC Hanging Man Weekly Close At Top of ChannelAs suspected, ₿itcoin made a strong push towards $80k to try and fill the CME Gap, but missed filling any portion of it.
We could still see one more push to flush out shorts and fill the gap, otherwise this is most likely the local top.
CRYPTOCAP:BTC has closed the Week with a Hanging Man candle which suggests a trend reversal, and is near the top of the parallel channel.
Waiting for a few Weekly Closes below ~$75k for confirmation.
Hanging Man
Mastering the Hanging Man PatternAlright, traders, let’s talk about the Hanging Man candlestick pattern.
This one’s a classic, and if you know what you’re looking at, it can be a game changer when you’re spotting potential reversals. So, what exactly is the Hanging Man pattern, and how can you use it to your advantage? Let’s break it down.
What Is the Hanging Man Pattern?
The Hanging Man pattern appears when the market has been pushing higher, and then—bam—a sign that it could be running out of steam. It’s called the Ha
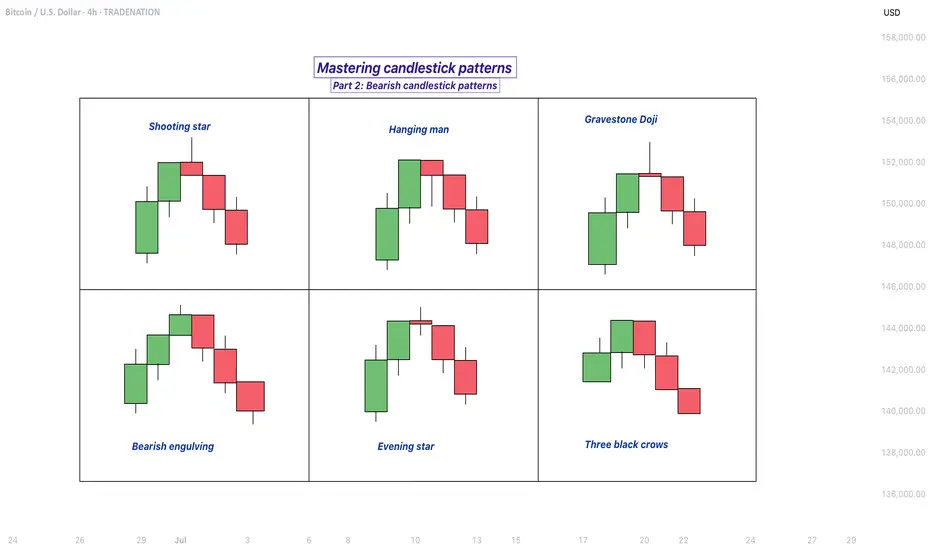
Mastering bearish candlestick patterns - How to use it!Bearish candlestick patterns are a cornerstone of technical analysis, relied upon by traders across financial markets to assess the likelihood of price reversals or continued downward trends. At their core, these patterns are visual representations of shifts in market sentiment, formed by the open, high, low, and close prices over one or several trading sessions. When recognized accurately and interpreted in context, bearish candlestick setups can alert market participants to the fading strength
Hanging Man and Doji Patterns in Focus!XAUUSD
2H Chart
Price: 2622.23
Hanging Man:
The highlighted candle in the chart represents a Hanging Man pattern, which is a bearish reversal pattern typically found at the top of an uptrend.
The long lower wick signifies that sellers pushed the price down during the session, but buyers managed to bring it back up close to the open price, though not with strong bullish conviction.
The fact that this pattern appears after a sharp upward move signals a potential bearish reversal, especially if
The Last Candle from the GOLD is the Hanging Man???Dear my Dragon Friends
i saw the closing candle at this week with time frame Daily is "Hanging Man", that was means by monday we can see the reversal pattern (going down) our watchlist for down side is 2380-85 for the support if break we can get big pattern with Rising Wedge and will be going to 2280-2300.
But if HOLD at this number 2380-85 we can see GOLD will Rise again and me Higher High will break all resistance and make new resistance again, may be 25XX...
For now and this week i will tr
EWTX hanging man + shooting starPrice has made some serious moves up but has formed two interesting candles just below a previous s/r area. The most recent candle is unfortunately not the greatest considering yesterday was a green day and formed a hammer but I still think EWTX is overextended. An insider has also just dumped a large amount of shares which further supports my bearish feelings.
What is absolutely not in my favor is the most recent news (yesterday) regarding the FDA fast track of one of their drugs as this may br
Technical study of this INSANELY powerful bull market!Once again, the indices are rising strongly. While the SPY is heading towards its all-time high, the QQQ and the Dow Jones ETF are already breaking a new all-time record, again. When will we see the market calm down again? What if a top signal appears on the indices?
The SPY ETF is in a clear uptrend, making rising tops and bottoms, breaking its resistances and trading above the 21 EMA (which is pointing upwards, by the way). The next technical resistance is at $479.98, the all-time high.
Are
Bitcoin / Hanging Man CandlestickWhat is a Hanging Man Candlestick?
A hanging man candlestick occurs during an uptrend and warns that prices may start falling. The candle is composed of a small real body, a long lower shadow, and little or no upper shadow. The hanging man shows that selling interest is starting to increase. In order for the pattern to be valid, the candle following the hanging man must see the price of the asset decline.
...........................................................................................
EURJPY Daily Hanging Man Candle Pattern#EURJPY Has been in uptrend for long enough time and the pair has started to show some exhaustion by creating this beautiful reversal pattern at the top. We have a potential opportunity for a short trade. + Don’t Forget To Match With Your Strategy.
Like + Comments Will Be A Big Support.
Disclaimer: Buying OR Selling is your own decesion.
This is just my personal view of the market for educational purposes.
EURJPY Pullback Sell Opportunity- Price is in an overall uptrend, creating higher highs and higher lows
- Price made a bullish push and broke above the initial resistance/supply zone (blue rectangle), which now acts as a form of support/demand zone.
-Price previously closed as a hanging man candlestick pattern which also hints at a possible reversal.
- If the next candle ends in a bearish candle, I will anticipate price to sell off and test and find support near the 50.0-61.8 fib level.
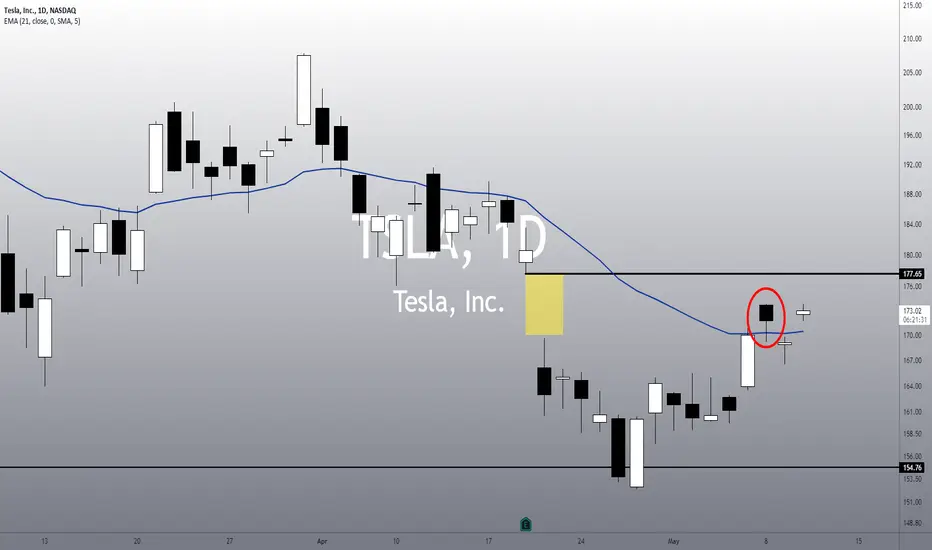
TSLA: Turning Bullish Again.• TSLA stock looks impressive, as it is doing an important reaction today, trying to reject the Hanging Man candlestick pattern from Monday;
• In theory a Hanging Man pattern is a famous top signal, however, evidence suggests that this pattern acts as a bullish continuation roughly 59% of the time (BULKOWSKI, Thomas. Encyclopedia of Candlestick Patterns, p. 365);
• Now, TSLA is trying to resume the bullish momentum. To reject any possible top signal, it is important to see it breaking Monday’s h
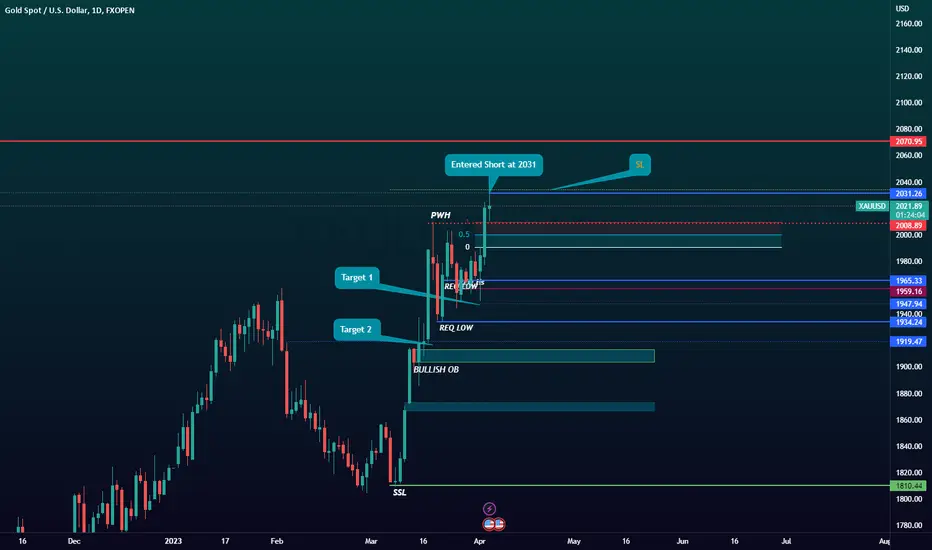
Gold chart bear outlook in a bullish environmentThe only know if i will how will be Ruint (my new fav words) thx to trading view chats Hilarious
But back to business
with no fundamental after Gold clear previous high i am attempting a short entry before any retest to see how far Gold could correct and where will it hunt for liquidity
Am also look for volume imballance and accumulation phase to confirm my bearish bias
A breack of the imbalance will show a strong bull sentiment to the market
According XM Global Sentiment 20 % are are
XShort
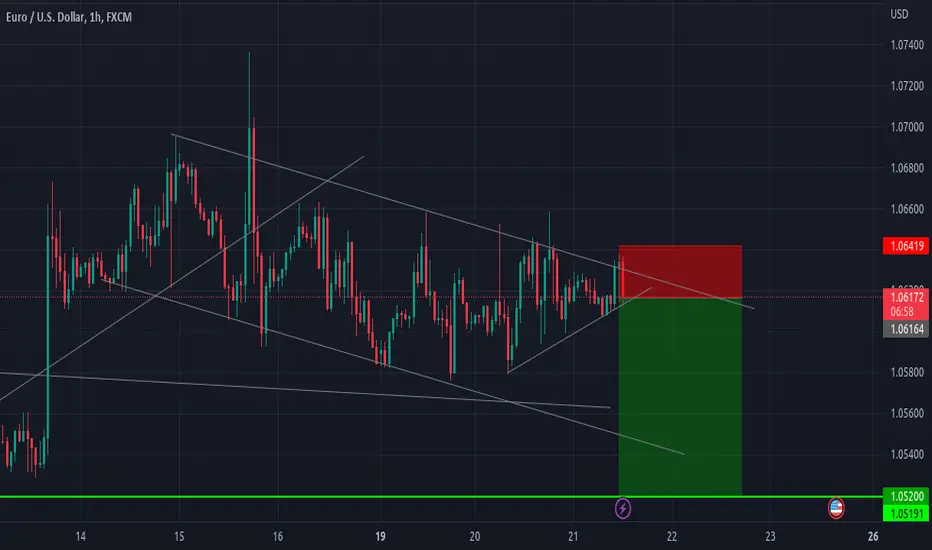
EURUSD : Bear's Can fight Back from major resistance OANDA:EURUSD
Hi , trader's .. As per technical analysis , it's visible that market is near to major resistance
price can possibly form double top which can lead market to downside
As price reject from this important resistance there is possible chance of Hanging man or doji candle formation
Any reversal shape candle will be helpful for bear's to take there selling position's
❤️Please, support my work with follow ,share and like, thank you!❤️
Spy: End’s day with Hanging Man CandleA hanging man is given as a candle for Wednesday 3/8, if patterns are to be considered then look at Jan 24 and notice the same candle given and what has followed has been a sell off the following day (Jan 25) as well as or . I just notice things. Patterns. I also like Spy being aligned with the 5 day.
It does appear we could be in a (W) double bottom bounce Structure here on the Day Chart.
So although I’m bearish on tomorrow 3/9
EUR/USD BUY SETUP PRICE ACTION ANALYSISFX:EURUSD
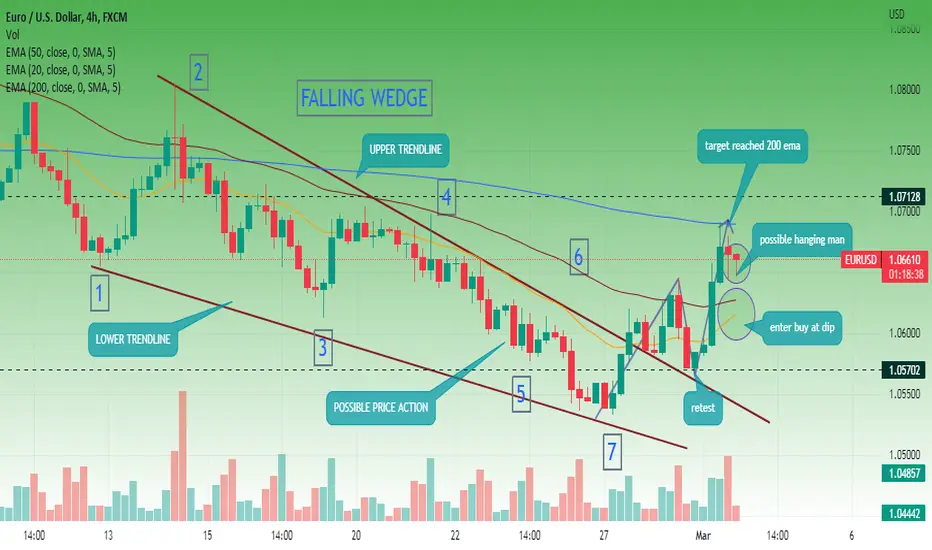
HI , TRADER'S OUR PREVIOUS TARGET ACHIEVED , Market succesfully breakout of falling wedge
Now price touched 200 ema major resistance , A pull back for 60-70 pip's possible
Market can again go up after testing 20 ,50 ema
❤️ Please, support my work with follow ,share and like, thank you !❤️
$SPY $SPX $ES1! Analysis, Key levels, and Targets $SPY $SPX $ES1! Analysis, Key levels, and Targets
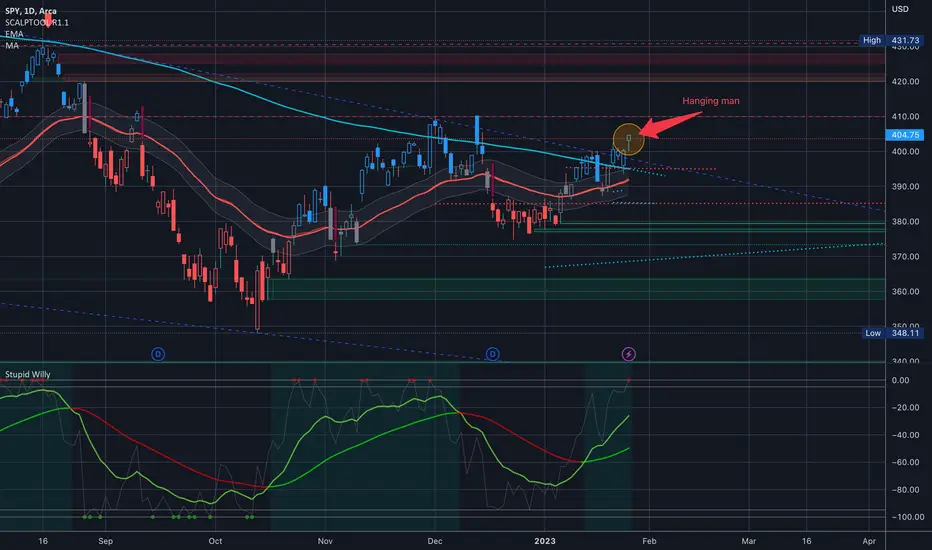
AND we’ve got a hanging man candlestick… On an upswing, the Hanging Man candle is often seen as an sign of potential reversal in trend. A gap down and a close under the body of today’s daily candle would be confirmation and continuation of reversal….
I think y’all know my position. This is the area from my last post that is my threshold for pain, lol, for my 410 puts in April… I’m still holding them but I was a little grumpy today about this
NIO: You must be aware of this KEY POINT! [Trend Analysis].• NIO is still trapped inside a Bearish Flag chart pattern, which we already mentioned in my previous analysis (link below this post);
• In theory, this is a continuation pattern, and since the long-term bias is bearish, NIO would trigger it downwards and seek the next target around $5;
• What’s more, NIO is quite close to the 21 ema in the weekly chart, another resistance level, and doing a Hanging Man candlestick pattern (so far);
• However, in the daily chart, the trend is bullish now, as NIO