#XRPUSDT: Bullish Reversal Coming With Price Heading Back To 3.5## XRPUSDT Analysis: Long-Term Perspective
In the long term, we anticipate the XRPUSDT price to revert to its all-time high of 3.5. From a fundamental analysis standpoint, we maintain a positive outlook, with the potential for the price to surpass 3.5. We have identified a favourable trading opportunity, as illustrated in the chart.
Our approach is neutral, as the trend remains undecided. Based on the duration of your positions, you can set two targets:
1. **Short-Term Target:** If you intend
Pitchforks
#BTCUSDT: From $74,000 to $88,000 Moving Well! More Growth CominIt’s been on a steady climb from $74,000 to $88,000. We’re expecting even more growth in the coming weeks. The price has finally broken free from its consolidation phase and is now on the rise. We think it’ll reach $94,000, then $100,000, and maybe even go up to $120,000 by the end of the year.
What do you think? Let me know in the comments below!
Thanks!
Team Setupsfx_
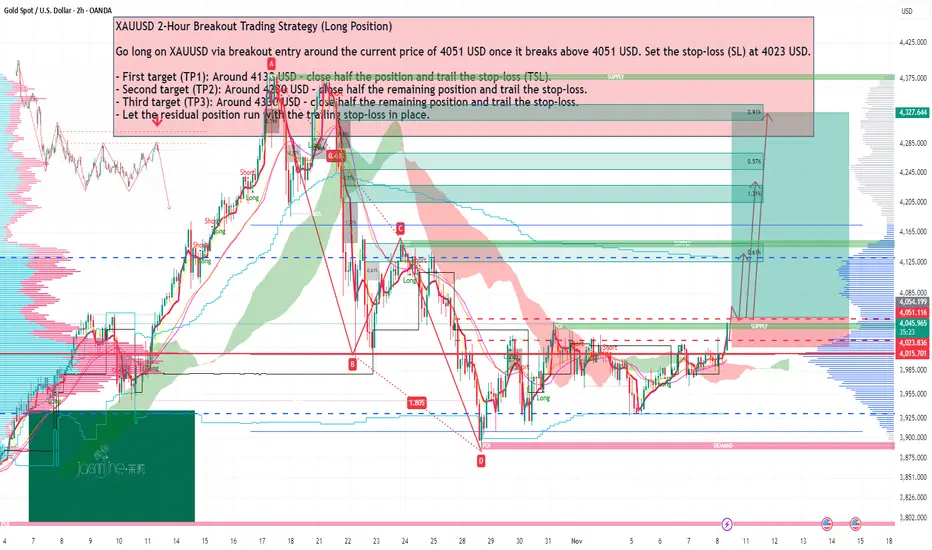
XAUUSD 2-Hour Breakout Trading Strategy (Long Position) XAUUSD 2-Hour Breakout Trading Strategy (Long Position)
Go long on XAUUSD via breakout entry around the current price of 4051 USD once it breaks above 4051 USD. Set the stop-loss (SL) at 4023 USD.
- First target (TP1): Around 4130 USD – close half the position and trail the stop-loss (TSL).
- Second target (TP2): Around 4230 USD – close half the remaining position and trail the stop-loss.
- Third target (TP3): Around 4330 USD – close half the remaining position and trail the stop-loss.
- Let
$CLSK: short term bullish Gartley NASDAQ:CLSK : bullish Gartley Harmonic has XD = 78.6%. NASDAQ:CLSK has exceeded this ratio slightly. Bullish Bat's XD ratio is 88.6%, this week's low aligns with this ratio.
The bullish Gartley appears to have completed and prices should start to recover.
If the broader market drops, AB = CD can target $13.50, which would present an excellent opportunity to add. I'll be adding to my position in the buy zone if the opportunity presents itself.
Additionally, the buy zone aligns with the
BTCUSD SELL 109730On the 4-hour chart, BTCUSD has stabilized and rebounded, and the short-term trend is expected to continue upward. Currently, pay attention to the area around 109730, which is a potential shorting entry point for a bearish bat pattern, and it also falls within the previous supply zone.
GBPJPY BEARISH SETUPGBP/JPY moving higher within a corrective leg; prime resistance is located at 201.96
The rally was sold in the dip was bought resulting in GBP/JPY closing the day little net changed. We've seen mild upside momentum overnight.
With the single currencies expected to move in the same direction, I would expect continued volatile price action.
From a technical perspective, we are currently at the equilibrium zone. Further upside barriers are seen at 201.93 and 201.96.
Conclusion: there is scope to
BULLISH CRAB PATTERN COMPLETING ON DASHA Bullish Crab pattern is nearing completion on the DASH/USD chart, suggesting a potential reversal zone as price action approaches the final leg (point D). The harmonic structure aligns with key Fibonacci ratios across the XA, AB, BC, and CD legs, reinforcing the validity of the setup.
Additionally, a potential Wave 2 correction appears to be completing within the .618–.786 Fibonacci golden pocket, adding strong confluence between harmonic and Elliott Wave structures. This overlap highlights a
TSLA 3-Drive & ABCD Pattern – Path to $500 Before a PullbackThis chart highlights multiple harmonic and Elliott structures aligning for a potential bullish extension in Tesla (TSLA). A well-defined ABCD pattern and 3-Drive pattern suggest momentum building toward the $500 zone, supported by Fibonacci projections and channel resistance.
The current wave structure points to an imminent 5-wave advance, likely completing the “Drive 3” and pattern D confluence area near $500–505. Following that move, a corrective pullback (ABC) is anticipated, possibly retes
EURUSD - performing the correctionFurther to my previous idea on EURUSD. The price respected the Buttfly Pattern and started the correction. Nor the price got to the First Resistance, where I expect a correction, then it will continue to the Main Resistance at 1.16300. There I expect the price to return to downtrend and continue to 1.12500.
Just my humble opinion
$MSTR: AB = CD target almost reachedNASDAQ:MSTR : the AB = CD targets $233 and today's low is $236.86. Very close. If NASDAQ:MSTR can bounce here, or fake breakdown to 233 or lower than bounce back, it would be good for Bitcoin. I don't own NASDAQ:MSTR shares and don't plan to trade this name. I'm looking at NASDAQ:MSTR as another data point to gauge bitcoin.
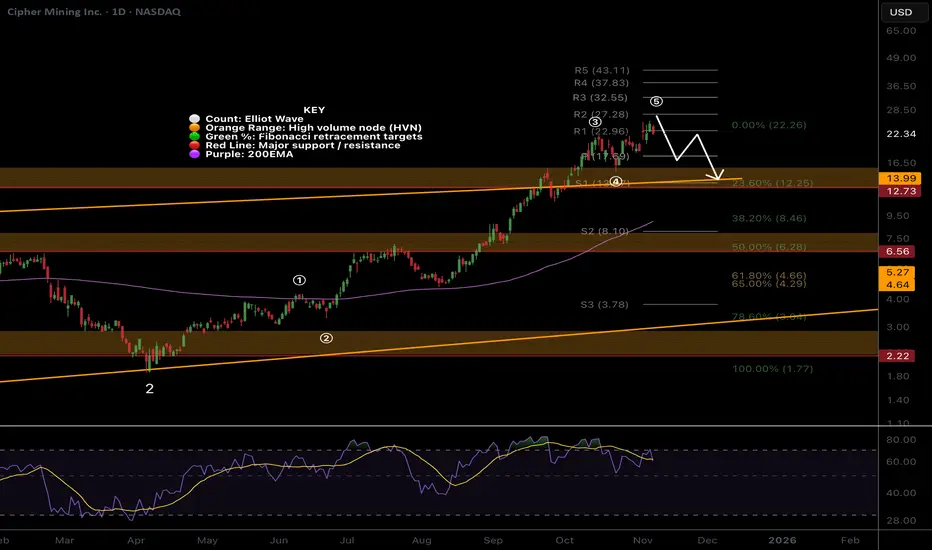
CIFR Pullback time?NASDAQ:CIFR Locally, price continues into price discovery with big jumps suggesting wave 3 is still going Wave (5) of 3 appears to be underway which could end at any moment. I am still expecting a retracement to test the previous all time high and punish late investors who are chasing prices up, trapping them into capitulation later.
Wave 4 has a downside target of the 0.236 Fibonacci retracement, High Volume Node support + the trend-line retest, $14. This may also meet the ascending daily 200
META - At SupportWell, theoretically META is just getting to the support cluster and competing a Crab Pattern. It may be respected and push the price higher, but if... If the markets forget of the poor results and of the fear that AI Rally is actually no more than another bubble... The best way to wait a bit and just see
Just my humble opinion
USDCAD - At ResistanceUSDCAD is just approaching a Resistance Cluster and completing the Butterfly Harmonic Pattern at 1.4146-1.4166. This is in line with the situation on EURUSD, GBPUSD and USDJPY.
I expect the price to perform a correction down to 1.3914 and then revert to uptrend.
Just my humble opinion
GBP/USD poised to rebound on demand and AB=CD support From the daily price of GBP/USD (British pound versus the US dollar), the pair has rebounded from demand at US$1.2871-US$1.3016, a move that is accompanied by the completion of an AB=CD bullish formation at US$1.3078 (100% projection ratio). From this point, traders tend to target the 38.2% and 61.8% Fibonacci retracement ratios derived from legs A-D at US$1.3307 and US$1.3491, respectively.
Written by FP Markets Chief Market Analyst Aaron Hill
BTC Bullish Continuation: The Significance of 50% RetracementsOver the past three years of bullish market cycles, the 50% retracement level has frequently acted as a reliable support zone following significant upward impulses.
In multiple instances, after establishing a new swing high, price has pulled back to a 50% level before successfully establishing a higher low and resuming the primary bullish trend with strong momentum. This demonstrates the level's importance in reloading the trend.
Following the most recent swing high, BITSTAMP:BTCUSD has exec
#BTCUSDT:Last Drop at 98K Before Hitting 140K?Bitcoin dropped significantly after reaching a record high of 125k. This comes after we announced a 100% tariff on China, creating fear in the global market, especially among crypto investors. We can now see a clear pattern forming, the AB=CD pattern, which is likely what others are also seeing.
Good luck and trade safely!
Team Setupsfx_
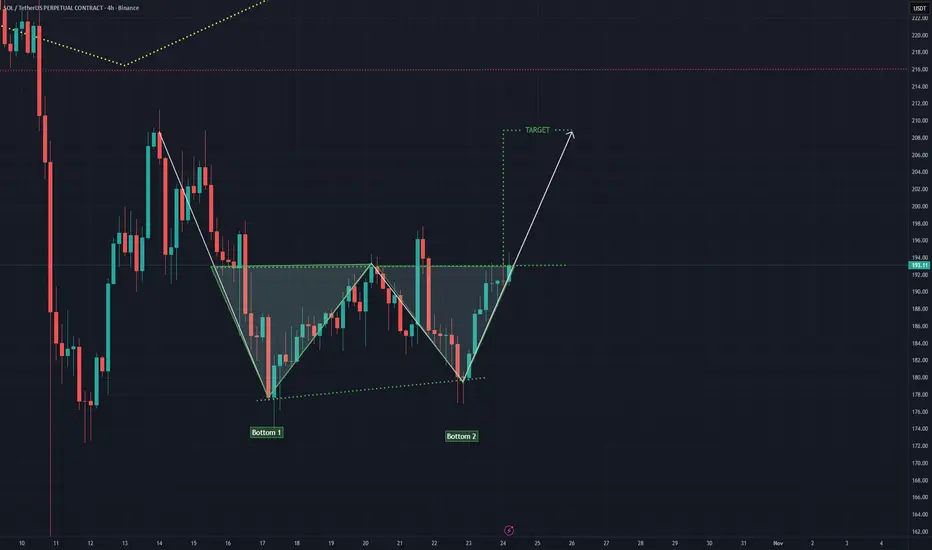
SOL 4H CRYPTOCAP:SOL 4H Chart
Solana forming a clear Double Bottom pattern signaling a potential trend reversal after the recent pullback.
Price is testing the neckline resistance, and a breakout above could confirm bullish continuation toward the projected target zone.
If confirmed, this setup suggests strong bullish momentum building for $SOL.
#SOL #Solana #Crypto #PriceAction #TradingView