Long
Long
 Long
Long
Nifty Analysis EOD – June 29, 2026 – Monday🟢 Nifty Analysis EOD – June 29, 2026 – Monday 🔴
Tug of War at the Wall: Bulls and Bears Deadlock Below 23,970
🗞 Nifty Summary
Nifty opened flat to positive and made an early attempt at 24,110, but that move didn’t hold — the index dropped sharply and found support around 24,005 before staging a strong recovery. That bounce pushed price back above the day high and broke the IBH, but the rally fizzled out quickly. From that point, Nifty fell 195 points from the day high and in that move smoothly breached PDC, PDL, IBL, and the 23,970 support level one by one.
Around 12:40 PM, the index found support at 23,925 and spent the rest of the session hovering wildly in a tight 45-point range between 23,925 ~ 23,970. The 3 PM candle looked like it might follow through towards 24,005 ~ 24,025, but it disappointed and the move didn’t come. A 60-point recovery in the final 20 minutes pulled Nifty back up to close at 23,978.50 on the spot — though the average close came in at 23,946.25, sitting below the 23,970 support level.
Overall, the day played out broadly as expected — bearish — with the 24,075 ~ 24,135 zone acting as resistance and the 23,970 ~ 23,925 band holding the session. After 1 PM, the intraday chart showed a clear tug of war between bulls and bears that lasted right through to the close.
Tomorrow is monthly expiry for Nifty, BankNifty, and FNO stocks, and Nifty is sitting at a crucial point — fighting for the survival of its short-term bullish trend. A close below 23,825 could open the gate for 23,650 ~ 23,620. For bulls, 24,075 ~ 24,125 is now strong resistance — a close above that is needed to resume the bullish trend. Until that happens, the bias stays short-term bearish.
Today’s daily candle closed well below the open with a moderate body, reflecting steady selling pressure through the session. Expiry tomorrow sets up a volatile session — the 23,925 and 24,075 levels will likely be the ones to watch.
🛡 5 Min Intraday Chart with Levels
📉 Daily Time Frame Chart with Intraday Levels
🕯 Daily Candle Breakdown
Open: 24,061.75
High: 24,120.00
Low: 23,924.55
Close: 23,946.25
Change: −109.75 (−0.46%)
🏗️ Structure Breakdown
Type: Bearish candle — sellers were in control for most of the session
Range: ≈ 195 points — high volatility
Body: ≈ 115 points — moderate selling pressure, not a collapse but a steady drift down
Upper Wick: ≈ 58 points — early bullish attempt at 24,120 got pushed back
Lower Wick: ≈ 22 points — some support found near the lows, but nothing strong enough to reverse
🛡 5 Min Intraday Chart
⚔️ Gladiator Strategy Update
ATR: 256.65
IB Range: 105.30 → Medium
Market Structure: Balanced
Trade Highlights:
10:20 Long Trade: Target Hit (R:R 1:3.31)
10:38 Short Trade: Target Hit (R:R 1:3.78)
12:12 Short Trade: Target Hit (R:R 1:2.62)
13:55 Long Trade: Early Exit with Minor Loss
Trade Summary: Three targets hit back to back in the morning session — the system did its job cleanly. The early long and short trades both worked well within the IB range, and the 12:12 short caught the afternoon slide nicely. The 13:55 long was an early exit with a minor loss — probably read the 3 PM setup as a follow-through that didn’t materialise. Overall a solid day. The one loss was small and managed well.
🧱 Support & Resistance Levels
Resistance Zones: 24,025 | 24,075 ~ 24,125 | 24,190
Support Zones: 23,900 | 23,855 | 23,790
🧠 Final Thoughts
“On expiry eve, the market rarely gives clear answers — it just asks harder questions.”
Today’s session was a good reminder of how the same level can act like both a magnet and a wall at the same time. The 23,970 ~ 23,925 zone held for most of the afternoon, but the close below 23,970 on an average basis is something worth keeping in mind going into expiry.
Tomorrow’s monthly expiry for Nifty, BankNifty and stocks adds a layer of unpredictability that plain levels won’t fully capture. The 23,925 zone and the 24,075 ~ 24,125 resistance band are the two things I’ll be watching first. A decisive move through either one early in the session could define the whole day.
Going in with a neutral stance until the market shows its hand in the first 30 minutes seems like the sensible approach. Expiry days can move fast in both directions — patience at the open, and then follow what the price does.
✏️ Disclaimer
This is my personal digital diary and represents my own analysis and point of view. It is not financial advice; please consult a professional advisor before making any trading decisions. Bitcoin Bulls have work!
BTC is still working under lower highs and lower lows, so bulls have levels to reclaim before this downtrend can be considered over at multiple degrees.
The main bull levels I’m watching:
• 60,708.90
• 61,862.27
• 63,171.19
• 65,000
A clean break through these levels would start shifting the structure back toward upside delivery. Until then, bulls still have work to do.
On the bearish side, 58K remains the key area to watch. If BTC loses that area, the downside structure can continue.
For Elliott Wave, we may have a completed zigzag up and a zigzag down already printed, but the count still needs more price action for clarity. If these are stacked side-by-side zigzags, BTC may be setting up for more sideways movement here.
The cleaner bearish path would be an impulsive or motive move lower, potentially completing another leg of the larger-degree downside structure from the 83K region.
For now, I’m watching whether bulls can reclaim the listed levels, or whether this remains corrective and rolls over again.
 Long
Long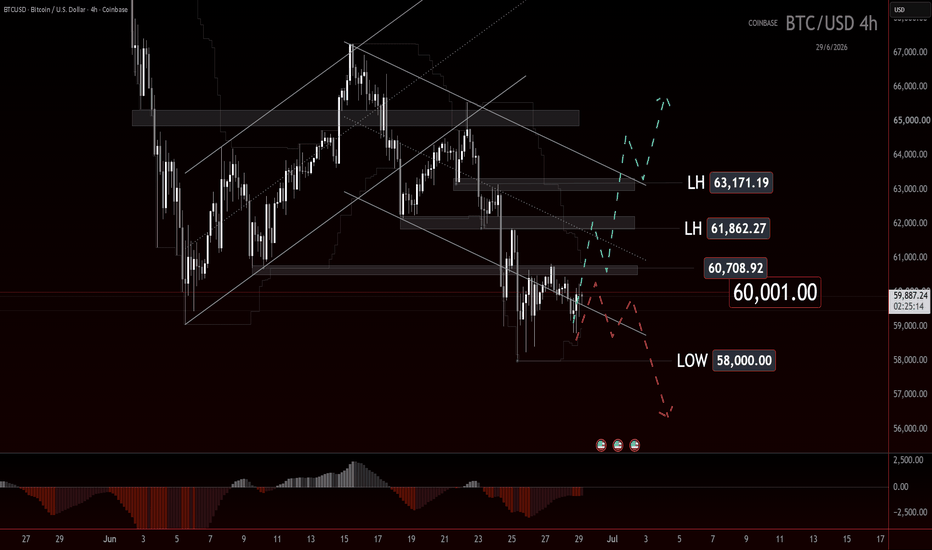
 Long
Long
2026: Bitcoin in a bear market! When will new growth begin?
The main cryptocurrency shows one of the worst results among all liquid assets.
Bitcoin fell by -50% from its peak.
This has happened more than once. Or more precisely, 3 times in the last 10 years.
There was a -82% drop in the period 2017-2018, in 2022 BTC fell by -78% and by -64% during the covid panic.
After such drops in CRYPTO:BTCUSD , great opportunities appeared on which one could make good money by buying coins on the spot.
Bitcoin shows itself much weaker than other assets such as: Sp500 , Nasdaq, gold because BTC is considered a risky asset.
Let's think about where Bitcoin can find the bottom?
What about technical analysis?
What the most popular RSI indicator says:
1 month (45) - neutral.
Week 1 (34) is already very close to the oversold zone.
1 day (42) - neutral.
4 hours (45) - neutral.
On higher time frames, the asset does not look oversold - now the price is in the neutral zone on all time frames.
The “fear and greed” index has been hovering around 14/100 (extreme fear) for several months now.
Based on the listed factors, we can conclude that April-May will be successful for the asset and we can see good short-term growth.
But in June-October, we can expect a continuation of the downward movement, since if the situation around Iran’s war continues to escalate, this will lead to worsening inflation in the world and an increase in world central bank rates.
This combination will weigh heavily on the price of Bitcoin this year.
My Trading Strategies Now:
I sold my bitcoins at levels of $100-110k (there are proofs on my channel).
For the last six months I have been in the cache and waiting for good buying opportunities.
I expect that the zone for long-term investment in Bitcoin is now at the level of $35-46k.
At these levels, I plan to actively buy an asset for long-term investment.
Be careful in the market brother, the 2026 bear market is unforgiving! Long 
 Long
Long
Long 
Short 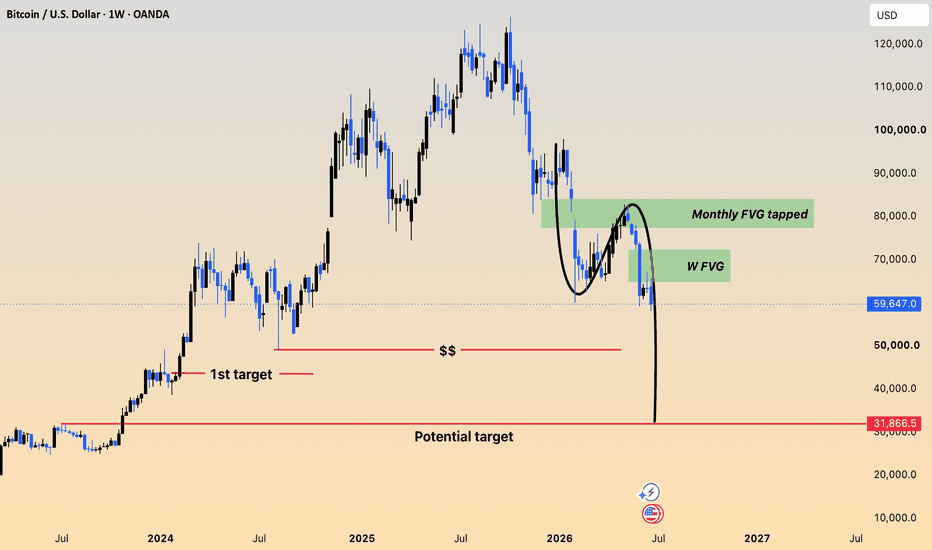
GOLD seems to have reached the end of its bullish trend! (1D)Before anything else, please make sure you have checked my signature; otherwise, you will miss important analyses and updates.
We are active exclusively in the crypto market and do not normally operate in other markets. However, as an exception, we have analyzed GOLD at the request of our users.
On the chart, we can observe a bearish CH pattern, which clearly indicates the presence of sellers in the market. In addition, there is a 3D pattern visible on the chart, which is more relevant for higher timeframes. This suggests that sellers may soon initiate position liquidations and take profits, potentially causing downward pressure on the price.
When looking at pivots and liquidity zones, there is no significant support until the $3,600–$3,400 range, which could leave the market vulnerable to further declines in the short term.
For risk management, the invalidation level can be set above the most recent high, where sharp bearish moves were previously observed. A daily candle closing above this level would invalidate this analysis and signal a potential change in market dynamics.
Overall, traders should be cautious and monitor these levels closely, as the combination of bearish patterns and lack of strong support points to a possible continuation of selling pressure in the near future.
What’s your take on this setup do you see the same bearish structure or a different scenario?
Drop your analysis in the comments and let’s compare perspectives. BNB — Is a 20-30% Drop Still Ahead?Breakdown Below Support, Lower Targets in Focus
BNB is slowly breaking below key support. The $570 area previously acted as support and is now acting as resistance.
For the next move, I'd like to see another leg lower toward the $500 psychological level, which aligns well with the Fibonacci confluence such as the -0.6 fib and 1.618 fib, giving us an overall target of $503.57 and $500.
My primary downside target sits between $463.65–$438.43, suggesting there could still be another 20–25% move to the downside before a high-probability long setup develops.
Several key confluences line up in this region:
Anchored VWAP aligning with the 1.618 Fibonacci extension around $464.65
0.786 Fibonacci retracement at $438.43
Liquidity Zone
Educational insight — Anchored VWAP:
Anchored VWAP is powerful because it represents the average price of all participants from a specific starting point, rather than just the current session. This makes it especially useful for identifying where larger market participants are likely positioned. When price repeatedly reacts to an anchored VWAP, especially when it aligns with Fibonacci levels it often signals interest zones where liquidity is being defended or distributed.
One reason I continue to rely heavily on the Anchored VWAP is its ability to identify support and resistance. In this case, it's lining up almost perfectly with the Fibonacci extension, a confluence that has already produced two clean rejections.
Overall, BNB has respected Fibonacci levels remarkably well throughout this cycle. I'll remain patient and wait for price to reach these higher-confluence zones before looking for the next long opportunity.
_________________________________
💬 If you found this helpful, drop a like and comment! a  Short
Short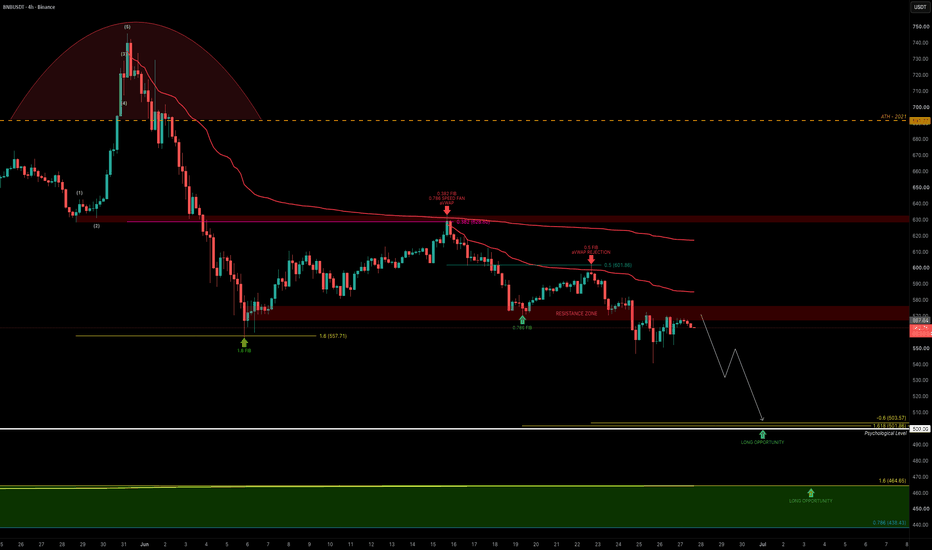
 Long
Long
 Long
Long
 Long
Long
 Long
Long
 Long
Long
 Long
Long