Introduction to Dividend Calendar
The Dividend Calendar is designed to help you compare which dividend-paying stocks were the most profitable over the previous quarter relative to others. If you are performing top-down fundamental analysis, this calendar provides a clear overview of the market, helping you easily identify cash-generating assets to potentially add to your long-term portfolio.
What are dividends?
A dividend is a portion of a company's earnings paid out to its shareholders for each share they own. While companies typically publish dividend reports and distribute payouts on a quarterly basis, the decision to distribute dividends is entirely up to the company's management — though it is widely expected from mature, established businesses.
Using the Dividend Calendar
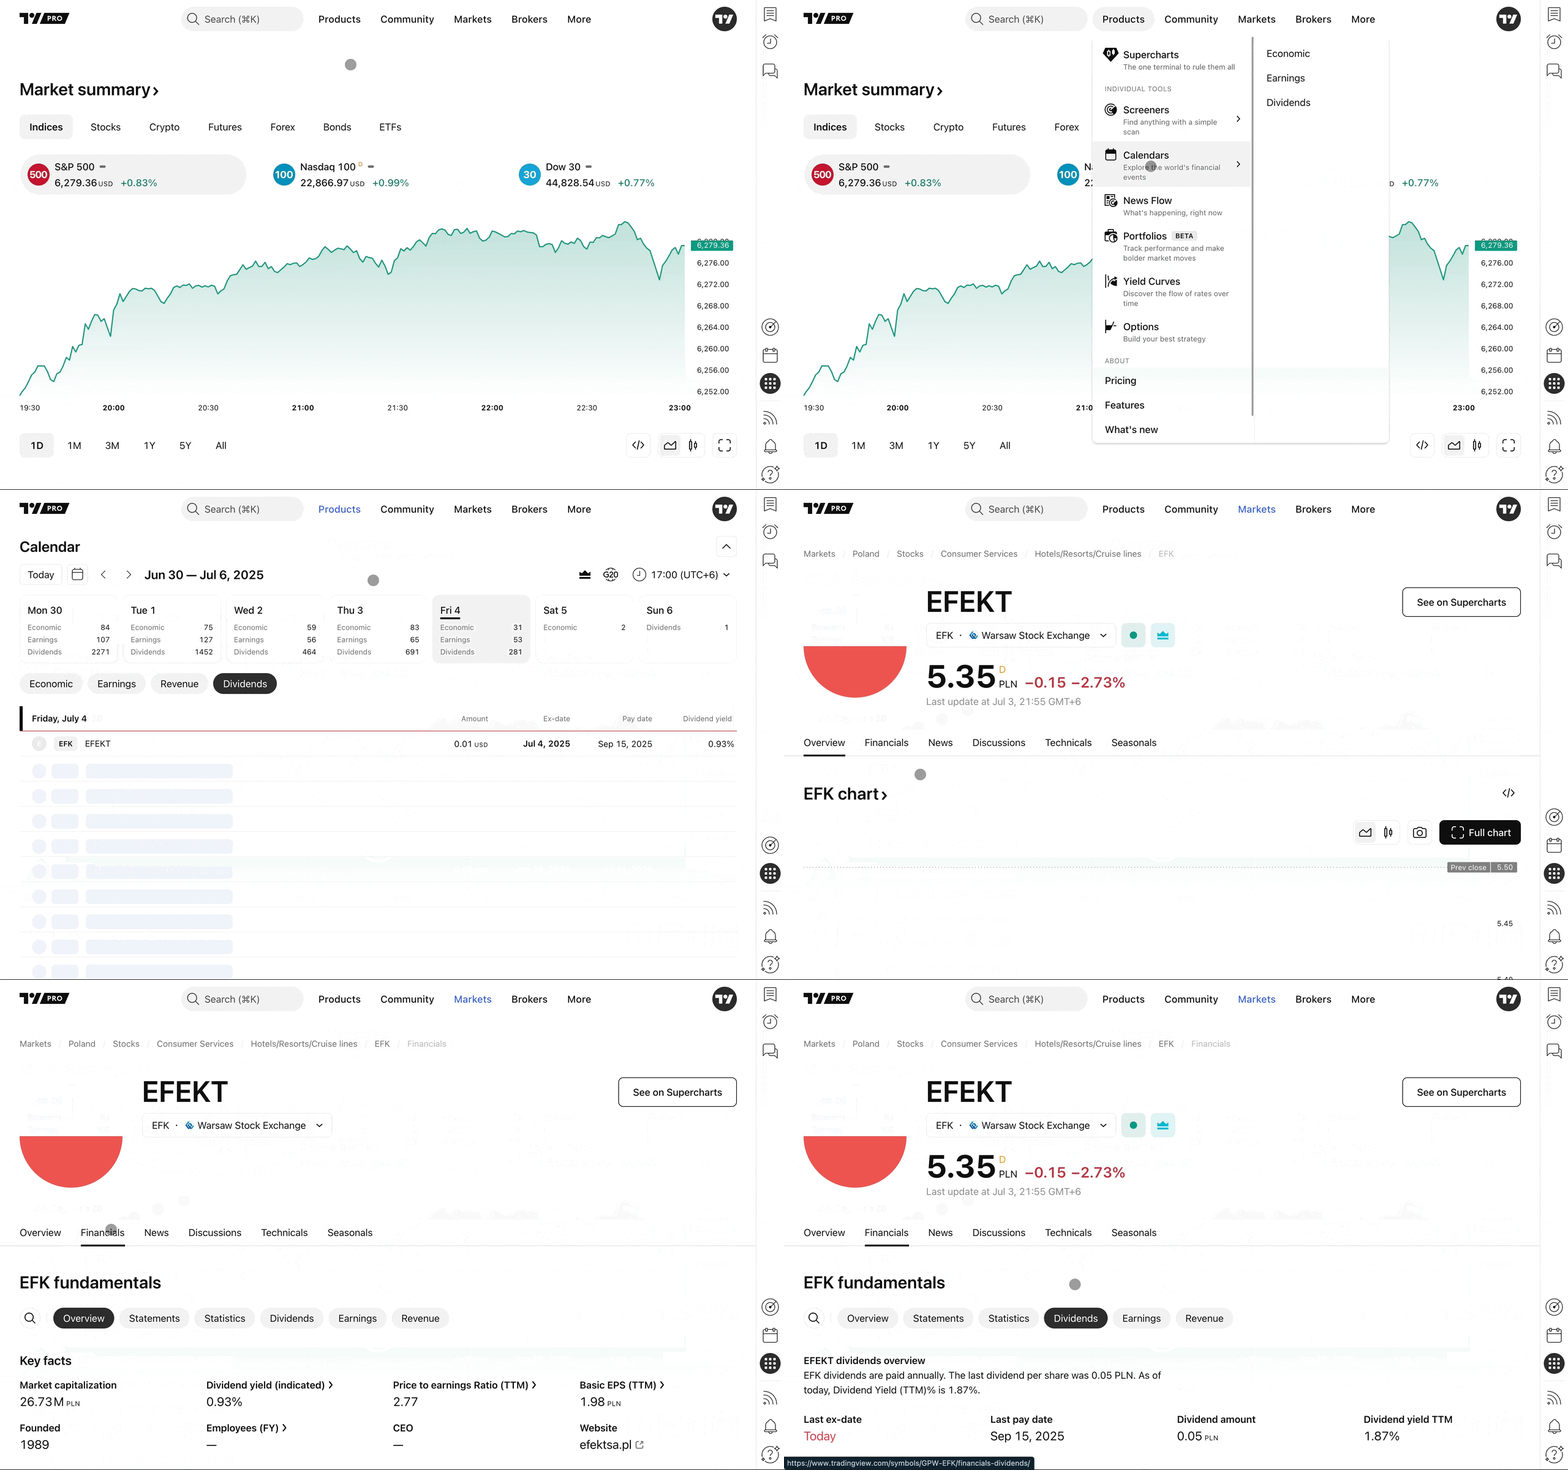
In the Dividend Calendar, you will find the following key information for each stock:
- Amount: How much money the company is going to pay shareholders for each share they hold.
- Ex-date: The cutoff day. You must purchase the stock before this date to be entitled to the upcoming dividend payout.
- Pay date: The exact date when the cash distributions will occur and be deposited.
- Dividend yield: A financial ratio showing the annual dividend payout relative to the current stock price, usually expressed as a percentage.
Tip: Notice the Sun or Moon icons to the left of each company. These indicate exactly when the dividend report will be published — either before the market opens (Sun) or after the market closes (Moon).
Deepening your analysis
If you need more data regarding a specific company, simply click its ticker symbol to navigate to its dedicated market page. From there, open the Financials tab to dive into any fundamental data you need for your analysis.
Moreover, you can choose to display upcoming dividend payouts directly on your price charts. To do this, navigate to your Superchart settings by clicking the Gear icon, open the Events tab, and check the Dividends box. You will then see blue "D" markers appear along the bottom time scale of your chart, visually aligning the company's payout history with its price action.
Also read: