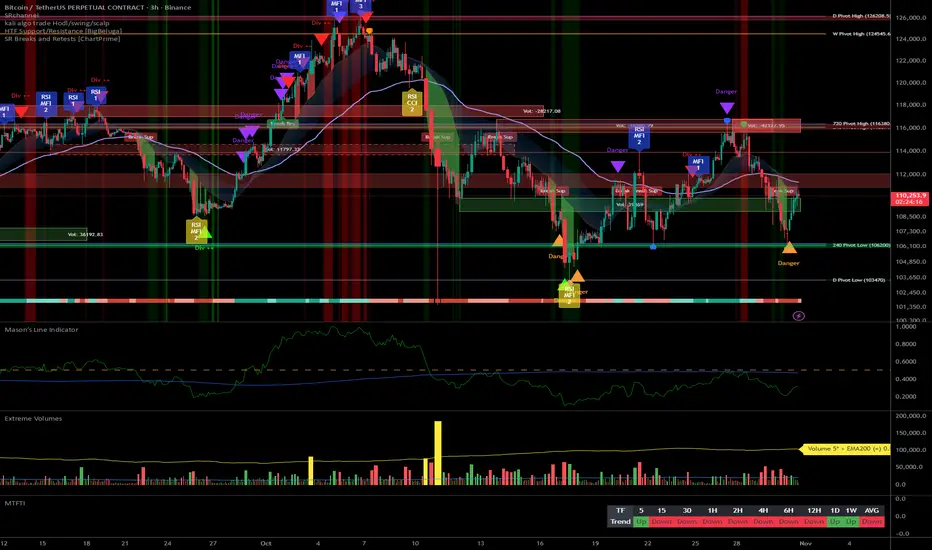
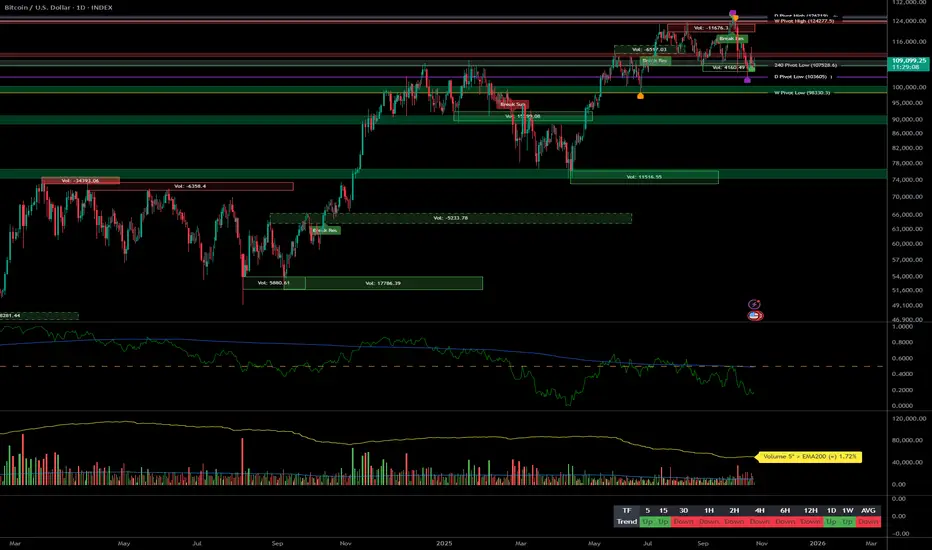
Long
Long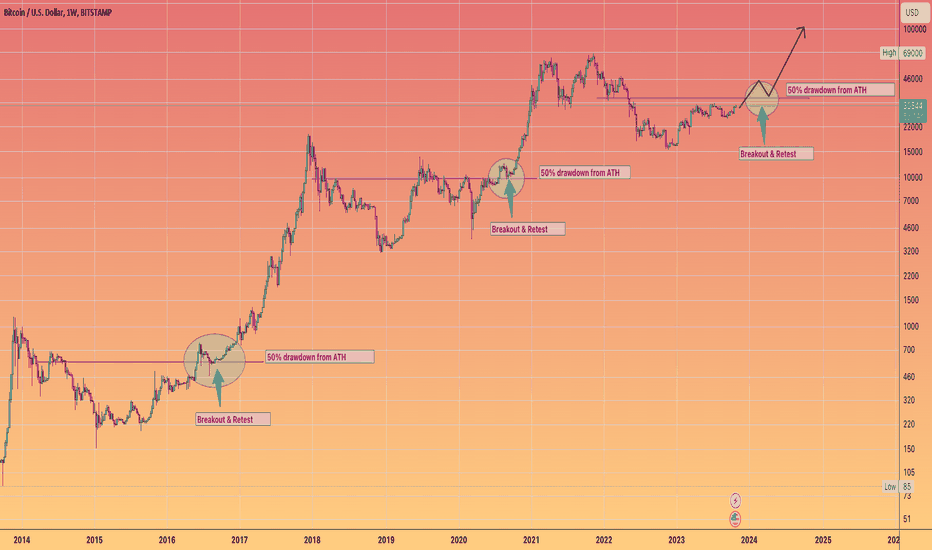
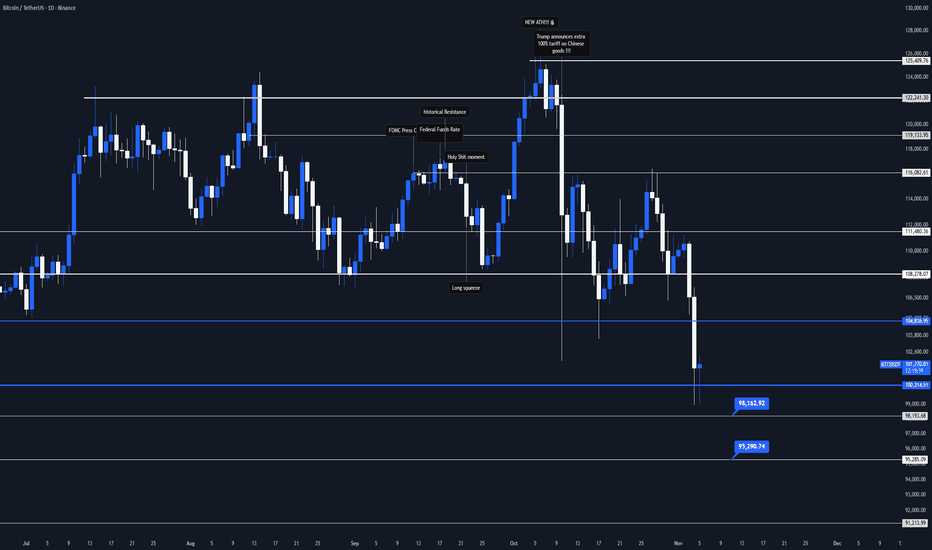
 Long
Long
iShares Semiconductor ETF Eyes Bullish Continuation🚀 SOXX Breakout Play — Swing/Day Trade Setup 🎯
Asset: SOXX – iShares Semiconductor ETF
Playbook Type: Fund ETF Market Profit Playbook
Plan: 🔥 Bullish Plan (Swing/Day Trade Setup)
⚡️ Entry Plan
Looking for long entries after a confirmed breakout above $292.50.
Once this resistance gives way, momentum traders may pile in — that’s where our profit zone starts heating up! ⚙️
🛡️ Stop-Loss (Risk Control)
Stop Loss: $277.50 — a.k.a. The Thief SL.
Dear Ladies & Gentlemen (Thief OG’s) 👑 — I’m not recommending you to use only my SL. It’s your call, your risk, your money. Manage like a boss. 💼
💰 Profit Target
Target: $308.00 — this level sits near a strong resistance zone where the market might turn overbought or trap late buyers.
Be smart. Escape with profits before the herd does. 😎
Again, Thief OG’s — my TP is just my view. You decide when to take your money and run. 💸
🔗 Correlated Assets to Watch
Keep your eyes on these key players — they often front-run SOXX moves or confirm direction:
SMH (VanEck Semiconductor ETF) → Often mirrors SOXX behavior.
NASDAQ:SOX (Philadelphia Semiconductor Index) → Sector index — leads ETF flow.
NVDA / AMD / TSM → Chip giants that heavily influence ETF weight.
QQQ → Tech sentiment gauge; if NASDAQ rallies, SOXX gets wings.
💡 Tip: When NVDA and SMH break resistance together, SOXX rarely stays quiet — momentum usually follows fast.
⚠️ Key Watchpoints
Always confirm breakout volume before entry.
Keep an eye on macro headlines — rate decisions, chip demand, or supply chain data can shift the tone fast.
Protect profits once RSI hits overheated zones near the upper channel.
🧠 Thief Trader Mindset
This setup isn’t about guessing — it’s about waiting for confirmation, reacting fast, and locking profits like a pro thief in daylight. 🕶️
✨ “If you find value in my analysis, a 👍 and 🚀 boost is much appreciated — it helps me share more setups with the community!”
Disclaimer: This is a thief-style trading strategy just for fun. Always trade responsibly and at your own risk.
#SOXX #Semiconductors #ETF #BreakoutTrade #SwingTrade #DayTrade #TechSector #TradingView #TradeIdea #ThiefTrader #RiskManagement #MarketPlaybook  Long
Long
BTC: 112k caps, 108.5k–106.5k defends__________________________________________________________________________________
Market Overview
__________________________________________________________________________________
BTC trades in a range with a bearish intraday tilt, while 12H/1D remain constructive. ETF outflows and a risk-off tone still cap sustained upside.
Momentum: 📉 Bearish within a 112k–106k range; rebounds capped below the 111.9k–112.2k flip.
Key levels:
• Resistances (4H/12H/1D): 111,900–112,200 (flip), 115,500–116,030 (HTF supply), 120,800–121,000 (1D/2D cap).
• Supports (12H/4H/1H): 108,482 (12H pivot), 106,050–106,500 (Cluster A 30m/4H), 102,530–102,790 (Cluster C 1H/2H/12H).
Volumes: Overall normal; very high prints at the recent 15m low — more “flush” than fresh catalyst.
Multi-timeframe signals: 1D/12H up; 6H/4H/2H/1H/30m/15m down — bearish confluence below 112k; key supports at 108.5k then 106.05–106.50k.
Risk On / Risk Off Indicator context: NEUTRE VENTE — it contradicts HTF momentum and argues for caution until 112k is reclaimed.
__________________________________________________________________________________
Trading Playbook
__________________________________________________________________________________
Strategic stance: range with intraday pressure — favor reactive entries at HTF floors, avoid chasing.
Global bias: NEUTRE VENTE near current prices; tactical invalidation on firm acceptance > 111,972 with volume.
Opportunities:
• Buy: confirmed reaction at 108,482 or 106,050–106,500; target 111,972 then 113.5–115.5k.
• Breakout buy: acceptance > 111,972 with volume; target 115.5–116.0k, stretch 120.8–121.0k.
• Tactical sell: rejection at 111,900–112,200 or 115.5–116.0k, aiming 108.5k then 106.5k/106.05k.
Risk zones / invalidations: Clean break < 106,048 opens 104.59/103.66 then 102.53–102.79; acceptance > 112k opens 115.5–116k.
Macro catalysts (Twitter, Perplexity, news):
• Fed to end QT on Dec 1 → liquidity tailwind, timing uncertain.
• Spot BTC ETF outflows → near-term headwind for trends.
• LTH distribution; STH cost basis near ~113k → rallies capped below 112–113k.
Action plan:
• Long (reactive): Entry: 108.6k (12H/2H confirmation) or ~106.3k (Cluster A) / Stop: below floor / TP1: 111,972, TP2: 113.5k, TP3: 115.5k / R:R ≈ 1:2–1:3.
• Short (tactical): Entry: rejection 111.9–112.2k / Stop: above the rejected band / TP1: 108.5k, TP2: 106.5k, TP3: 106.05k / R:R ≈ 1:2.
__________________________________________________________________________________
Multi-Timeframe Insights
__________________________________________________________________________________
HTFs (12H/1D) support buy-the-dip, while intraday frames remain bearish below 112k.
1D/12H: Uptrend but range-bound 112k–106k; 108,482 holds as pivot; acceptance above 111,972 opens 115.5–116.0k.
6H/4H/2H/1H/30m/15m: Lower highs persist; repeated failures at 111.9–112.2k; watch for a sweep into 106,050–106,500 if 108,482 fails. The tight 102,53–102,79 cluster is a magnet if pressure extends.
Major confluences: The 111.9–112.2k flip governs any relief; 106.05–106.50k concentrates multiple floors (30m/4H), with depth at 102.53–102.79.
__________________________________________________________________________________
Macro & On-Chain Drivers
__________________________________________________________________________________
Macro liquidity is set to improve, but crypto-specific flows remain hesitant — fostering two-way volatility inside the range.
Macro events: Fed ending QT on Dec 1 (liquidity positive); calmer European rates backdrop; managers heavily long risk with abundant cash sidelined — selective deployment.
Bitcoin analysis: Recent spot BTC ETF outflows weigh on upside attempts; pivot near 108.6k, with sub-106k flush risk if 108.5k gives way.
On-chain data: Elevated LTH distribution; STH cost basis near ~113k — a tactical lid until reclaimed.
Expected impact: Risk-off flows support a cautious bias below 112k; strong reactions at HTF floors can still spark relief.
__________________________________________________________________________________
Key Takeaways
__________________________________________________________________________________
Range-bound with a bearish intraday skew.
- Overall trend: neutral-to-bearish short term; turns constructive only above 112k with volume.
- Most relevant setup: reactive buys at 108.5k or 106.05–106.50k with confirmation; or tactical sells on 111.9–112.2k rejection.
- One macro driver: QT ends in December, but ETF outflows remain a headwind.
Stay disciplined: let levels lead, react to holds/breaks — don’t pre-empt. ⚠️  Long
Long
 Long
Long
Stronger dollar, ETF outflows: buy only confirmed dips__________________________________________________________________________________
Market Overview
__________________________________________________________________________________
BTC is consolidating after a reject below 115–116k, holding above 111.7k/110k in a corrective pullback within a still-up 12H/1D trend. Near-term macro flows (firmer USD, ETF outflows) cap bounces for now.
Momentum: Mildly bearish/corrective 📉 — pullback from 115–116k; upside capped until 114.6k is reclaimed.
Key levels:
- Resistances (HTF/4H) : 112.7k–114.6k (4H/1D supply), 115.4k–115.6k (1D pivot), 119.9k–120.45k (HTF).
- Supports (HTF/LTF) : 111.7k (HTF pivot), 110k (intraday shelf), 108.5k–107.4k (HTF + ISPD 30m zone).
Volumes: Very high on 1H/30m during the selloff; 1D volumes normal.
Multi-timeframe signals: 1D/12H Up; 6H/4H/1H/30m corrective; 2H basing — 111.7k/110k defense is key; a firm reclaim above 112.7k would aid bulls.
Risk On / Risk Off Indicator: NEUTRAL SELL — aligns with near-term hesitation and favors confirmed signals at support.
__________________________________________________________________________________
Trading Playbook
__________________________________________________________________________________
Primary trend constructive but capped by 114.6–116k; favor confirmed buy-the-dip and tactical sells on clear rejections.
Global bias: Cautious neutral-sell; tactical invalidation on a clean reclaim/close > 114.6k.
Opportunities:
- Buy: Confirmed bounce at 111.7k/110k (wick + 2H/4H close), target 112.7k then 114.6k.
- Deep buy: 108.5k–107.4k with 12H/1D bullish rejection; add above 112.7k.
- Tactical sell: Rejection at 112.7k–114.6k with rising sell volume, target 111.7k then 110k.
Risk zones / invalidations: Acceptance below 107.4k opens 105k then 102.7–102.9k; daily close > 115.6k invalidates shorts and unlocks 120k.
Macro catalysts (Twitter, Perplexity, news):
- Fed: 25 bps cut, QT ends Dec 1; near-term hawkish tone, firmer DXY.
- US BTC ETFs: notable daily outflow — headwind for follow-through.
- Synchronized light easing (HKMA, Saudi) + Eurozone GDP beat — mixed macro signal.
Action plan:
- Entry: 108.5k–107.4k on a strong 12H/1D bullish rejection.
- Stop: ~0.8–1.0% below 107.2k (or confirmed close below the floor).
- TP1: 111.7k; TP2: 112.7k–113.0k; TP3: 114.6k; Approx R/R: ~2.0–3.0R depending on execution.
__________________________________________________________________________________
Multi-Timeframe Insights
__________________________________________________________________________________
HTFs (12H/1D) remain up, while LTFs correct and probe nearby supports.
1D/12H: Uptrend with controlled pullback; 114.5–116k acts as ceiling; 111.7k is the key hold.
6H/4H/1H/30m: Corrective pressure, sellers active into 112.7k–114.6k; a flush to 108.5k–107.4k can offer better asymmetry.
2H: Attempting to base above 110k; a firm reclaim over 112.7k would improve MTF confluence.
Major signals: LTF very high sell volume vs normal 1D — wait for clean confirmations before adding risk.
__________________________________________________________________________________
Macro & On-Chain Drivers
__________________________________________________________________________________
Macro tilts cautiously risk-off near term (firmer dollar, ETF outflows) even as medium-term policy shifts are supportive.
Macro events: Fed -25 bps and QT to end Dec 1, near-term hawkish tone; DXY firmer; light synchronized easing (HKMA, Saudi) and better Eurozone GDP.
Bitcoin analysis: US ETF net outflows weigh on rallies; ~111.2k support watched and ~120k pivot as the gateway to 130k+ if reclaimed.
On-chain data: Elevated LTH distribution, STH stress; reclaiming ~113k STH cost basis would aid momentum.
Expected impact: Confirms a “buy dips on confirmation” bias while keeping size conservative until USD/flows improve.
__________________________________________________________________________________
Key Takeaways
__________________________________________________________________________________
Corrective consolidation below 114.6–116k with 111.7k/110k as first defense.
- Overall trend: HTF bullish, short-term neutral/bearish.
- Top setup: Confirmed dip-buy at 108.5k–107.4k, add on reclaim > 112.7k.
- Key macro factor: Firmer DXY and ETF outflows cap upside momentum.
Patience and disciplined execution on clean signals — that’s how to win this range. IBIT: ready for liftoffOn the daily chart, iShares Bitcoin Trust (IBIT) trades at $62.97, testing the key 0.705–0.79 Fibo zone ($61.63–63.87). This area marks a breakout and retest line, forming a clear buy zone. The technical structure remains bullish: after breaking out and pulling back, price holds potential to move toward $69.39, with Fibo extensions targeting $76.54 and $85.63. Volumes confirm buyer activity on dips, and the bullish flag pattern supports the continuation of the upward trend.
Fundamentally , the main driver is bitcoin itself, with institutional demand for BTC ETFs staying strong. Large funds continue accumulating positions, while expectations of a softer Fed tone add pressure on the dollar, fueling capital inflows into crypto. This strengthens the bullish case for IBIT.
Tactical plan: watch $61.6–63.8 as the key entry zone. Holding above opens the path toward $69.3, followed by $76.5 and $85.6. The scenario breaks only if price falls below $61.
And let’s be honest: IBIT isn’t just a ticker - it’s the “accelerate bitcoin” button for your portfolio. Long 
BTC: Range below 114k — breakout soon or fresh rejection?__________________________________________________________________________________
Market Overview
__________________________________________________________________________________
BTC is range-bound below 112,600–114,000, with improving intraday momentum but a firm HTF supply shelf overhead. The broader backdrop stays constructive while supports hold, pending a liquidity catalyst.
Momentum: Range with a bullish skew 📈 if 112,600 breaks and holds.
Key levels:
- Resistances (12H–1D): 112,600–114,000, then 116,000.
- Supports (2H–1D): 111,000–110,300, then 108,600.
Volumes: Normal to moderate (1H–4H), acting as an amplifier on rejections/breakouts.
Multi-timeframe signals: 1D Up, while 12H/6H/4H remain Down; intraday (2H/1H/30m/15m) Up but capped under 112,600–114,000.
Risk On / Risk Off Indicator: Mixed read (NEUTRAL SELL vs NEUTRAL BUY) → overall neutral stance, waiting for flow confirmation; this aligns with a range rather than a trend.
__________________________________________________________________________________
Trading Playbook
__________________________________________________________________________________
Strategically, the dominant trend is neutral below 112,600–114,000; stay opportunistic: buy a clean breakout or tactically sell a clear rejection.
Global bias: Neutral with buy-on-breakout skew above 112,600; key invalidation if 1D closes below 108,600.
Opportunities:
- Breakout long: Close + retest above 112,600 targeting 114,000 then 116,000.
- Buy the dip: 111,000–110,300 (or 108,600) on a bullish 2H–1D rejection.
- Tactical short: Rejection at 112,600–114,000 aiming 111,000 then 110,300.
Risk zones / invalidations:
- Below 108,600 on a 1D close: HTF structure weakens → risk of acceleration toward 106,800.
- Above 114,000 on 4H/1D: invalidates range shorts and opens 116,000.
Macro catalysts (Twitter, Perplexity, news):
- FOMC and liquidity tone (potential QT end) as key driver.
- US equities at ATHs: supportive risk backdrop while it lasts.
- BTC spot ETF flows mixed: uneven tailwind, needs confirmation.
Action plan:
- Entry: 112,650–112,900 (clean break/retest on 1H–4H).
- Stop: below 111,900 (breakout play) or below 110,300 (dip play).
- TP1: 114,000; TP2: 116,000; TP3: 118,500 (if extension).
- Approx R/R: 1.8R to 2.5R depending on stop and scaling.
__________________________________________________________________________________
Multi-Timeframe Insights
__________________________________________________________________________________
Overall, HTFs stay rangey under a stacked resistance shelf, while LTFs press into the 112,600 pivot.
1D: Uptrend but capped beneath 112,600–114,000; a clean reclaim/hold would unlock 116,000.
12H/6H/4H: Down/corrective; countertrend bounces likely capped at 112,600–114,000 absent confirmed closes.
2H/1H/30m/15m: Rising structure with higher lows; continuation on break & hold of 112,600, otherwise rotation risk toward 111,000–110,300.
Major divergences: Mixed 1D Up vs 12H Down; raises the bar for confirmation (retest + volume) on any breakout.
__________________________________________________________________________________
Macro & On-Chain Drivers
__________________________________________________________________________________
Macro/on-chain is mixed: potential risk-on via liquidity, but demand signals remain cautious below resistance.
Macro events: Fed QT reportedly nearing an end (near-term), risk supportive; US indices at ATHs; FOMC next → primary liquidity tone driver.
Bitcoin analysis: Pinned between the 200D (~108.5k) and STH cost basis (~113.1k); a daily close above ~113.1–116.0k unlocks higher; loss of ~108.5k risks 100–101k.
On-chain data: Below STH cost basis, demand fatigue; elevated LTH distribution; cautious options → need flow impulse to validate a breakout.
Expected impact: Constructive technical bias contingent on a confirmed break; without liquidity impulse, the range can persist.
__________________________________________________________________________________
Key Takeaways
__________________________________________________________________________________
Range beneath 112,600–114,000 with improving intraday but HTF supply still in control.
- Trend: Neutral, bullish if a clean break above 112,600; key supports at 111,000–110,300 and 108,600.
- Setup: Break & retest > 112,600 toward 114,000/116,000; alternative is disciplined dip-buys on bullish wicks at 110,300–108,600.
- Macro: FOMC + liquidity tone (potential QT end) is the main trigger.
Stay patient: wait for confirmation (close + retest + volume) and let flows lead risk. ⚠️ BTC: Breakout or a deeper dip into 105–102k?__________________________________________________________________________________
Market Overview
__________________________________________________________________________________
BTC is pinned just below 112.0–112.5k, with 12H/1D still trending up but capped by a risk‑off macro backdrop. Volatility is compressing and flows are mixed, favoring catalyst‑driven moves.
Momentum: 📉 Neutral‑to‑bearish tactically below 112.0–112.5k until a clean daily breakout confirms.
Key levels:
- Resistances (HTF): 112.0–112.5k (key pivot), 114.6–115.0k, 115.8–116.6k.
- Supports (HTF): 109.5–110.0k (demand block), 107.0–107.5k, 105.0–102.0k (ISPD staircase: 105.0 → 103.5 → 102.6–102.0k).
Volumes: Moderate to normal, no notable extremes (mainly intraday).
Multi-timeframe signals: 1D/12H = Up, 2H/4H = Down, 15/30m = Up; this mix warrants clear confirmation at key gates (112.5k up, 109.5k/107k down).
Risk On / Risk Off Indicator context: NEUTRE VENTE — a headwind that contradicts the HTF uptrend and argues for caution on break attempts.
__________________________________________________________________________________
Trading Playbook
__________________________________________________________________________________
Strategic stance: HTF trend remains constructive, but we favor patient, opportunistic execution while price sits below 112.5k.
Global bias: Neutral‑cautious (NEUTRE VENTE) while < 112.5k; bullish invalidation on a daily close above 112.5k.
Opportunities:
- Breakout buy: Buy a confirmed close/retest above 112.5k targeting 114.6k then 116.5k.
- Tactical sell: Fade a firm rejection at 111.9–112.5k with volume, target 110.0k then 107.0k.
- Buy‑the‑dip: Scale in on clean reversal within 105.0–102.0k (ISPD), add on hold above the reclaimed floor.
Risk zones / invalidations:
- Break below 109.5k opens 107.0k; losing 107.0k can accelerate toward 105.0–102.0k.
- Failed follow‑through after >112.5k breakout = trap; invalidate on a close back below 111.9k.
Macro catalysts (Twitter, Perplexity, news):
- US CPI ahead: a hotter print revives “higher for longer” and weighs on breakouts.
- US spot ETF flows: 7‑day average negative — headwind until it improves.
- Fed: 2025 cut cycle started but split views — volatility remains elevated.
Action plan:
- Breakout long: Entry 112.6k (validated retest) / Stop 111.9k / TP1 113.2k, TP2 114.6k, TP3 116.5k (R/R ≈ 1.8–2.0).
- Fade short: Entry 112.2k (confirmed rejection) / Stop 112.6k / TP1 110.0k, TP2 107.0k, TP3 105.0k (R/R ≈ 2.0).
- Dip long (scales): Entry 105.0–102.0k on ≥2H reversal candle / Stop below hit floor / TP1 107.0k, TP2 110.0k, TP3 112.5k (R/R ≈ 2–3).
__________________________________________________________________________________
Multi-Timeframe Insights
__________________________________________________________________________________
In sum, higher timeframes are constructive, but mid‑TF weakness still caps upside attempts.
1D/12H: Uptrend, yet 112.0–112.5k is the breakout “gate”; moderate volumes → demand a clean close/follow‑through before adding risk.
6H: Recovery stalls below 112.7–113.0k; watch 105.0k (6H ISPD) for a quality reversal‑buy trigger.
4H/2H/1H: Corrective bias; rallies fade near 112.9–113.4k while 109.3–110.0k holds — loss exposes 107.0k.
30m/15m: Micro uptrend inside the range; momentum trigger above 112.25–112.3k, but macro headwind argues for smaller size and confirmed follow‑through.
__________________________________________________________________________________
Macro & On-Chain Drivers
__________________________________________________________________________________
Macro is event‑driven (CPI, ETF flows), while on‑chain/derivatives point to a hedged, cautious regime.
Macro events: US CPI in focus (a “hot” print would weigh on breakouts); US spot ETF 7‑day average flows negative (risk‑off tone); the Fed started a 2025 cut cycle but remains split — volatility risk persists.
Bitcoin analysis: Range framed by 112k (daily close needed) and ~106–107k; volatility compression lifts breakout odds, but cooled flows argue for selectivity.
On-chain data: BTC below STH cost basis (~113.1k) and ~108.6k quantile; options put‑skew and elevated IV — a hedged transition regime.
Expected impact: Technical bias stays “neutral‑sell” until a daily close > 112.5k or a strong reversal on clustered floors at 105–102k.
__________________________________________________________________________________
Key Takeaways
__________________________________________________________________________________
BTC trades a liquidity‑heavy range below 112.5k with stepped supports toward 107k and 105–102k.
- Overall trend: neutral with a slight downside skew at resistance.
- Most relevant setup: confirmed breakout above 112.5k or quality reversal buy within 105–102k.
- Key macro factor: US CPI and persistently soft ETF flows shape timing and conviction.
Stay disciplined: wait for validation or quality dips before deploying risk. LEARN to INVEST Like Warren BuffetHello Stock Traders and Speculators 📈📢
If you trade and or watch stocks, commodities and/or ETF's then this one is for you!
Warren Buffett is probably one of the most successful investors of all time. Over the years, he has developed a set of principles and strategies over his career. He was inspired by the teachings of key financial thinkers like Phil Fisher, Benjamin Graham and Charlie Munger.
Phil Fisher
Fisher’s approach focusses on quality companies with long-term growth potential, emphasizing focused portfolios and long-term holdings. He believed in gathering information about a company beyond what’s readily available. His lessons on maintaining a focused portfolio and committing to long-term holdings are clear influences on Buffett’s patient, value-driven investment philosophy.
Benjamin Graham
Known as the father of value investing, Graham’s core principle was to buy stocks at a price lower than their intrinsic value, creating a margin of safety (MOS). This strategy helps mitigate risk and increase the likelihood of future gains. Buffett absorbed Graham’s teaching on finding stocks that are undervalued and buying them at the right price— definitely a large contributor of his investment success.
Charlie Munger
Munger is Warren Buffett’s long-time business partner. He introduced the concept of economic moats, which refers to a company’s long-term, sustainable competitive advantages. Munger advocates investing in businesses that can fend off competition and maintain profitability over time. This philosophy drives Buffett’s focus on companies with strong market positions and solid long-term potential, favoring these over shorter-term, speculative opportunities.
Buffett's Investment Approach
1 - Buy for the Long Term. Buffett’s strategy emphasizes identifying companies that can consistently perform well over long periods. He holds stocks for years, or even decades, often looking for opportunities where other investors may overlook value.
2 - Buy at the Right Price. Buffett is known for his discipline in waiting for the right moment to invest. His approach ensures he doesn’t overpay, instead seeking stocks when they are priced below their true value, maintaining a margin of safety.
3 - Buy the Right Stocks. Buffett doesn’t just buy cheap stocks, he buys quality companies with sustainable advantages. His goal is to invest in firms with strong business models that will continue to perform well regardless of market conditions.
Warren Buffett emphasizes investing in companies with simple and clear business models, ones that fall within his circle of competence. He prefers to thoroughly understand the operations, products, and long-term prospects of a company before making any investment.
This principle is combined with in-depth analysis of how the company operates and how sustainable its valuations and future growth prospects are. If a business model is too complex or outside his expertise, he avoids it.
He prioritizes companies with integrity and transparency in their management. He believes in backing leaders who are passionate, have strong vision and execution capabilities and who use shareholder funds wisely. Trusting management to run the company effectively, with efficiency and accountability, is critical for long-term success in Buffett’s eyes.
Investing in quality companies isn’t enough—Buffett also insists on buying them at attractive prices. He maintains a strict discipline of buying with a margin of safety, ensuring the price paid is lower than the company’s intrinsic value. This means waiting for opportunities to buy great businesses at fair prices rather than settling for fair businesses at attractive prices, which may not perform well over time.
Buffett has made many of his lessons and strategies available to the public through his letters to shareholders and partnership letters. These documents offer insight into his investment approach, decision-making process, and lessons from both successes and failures. There are several key books that capture Buffett’s life, philosophy, and strategies in greater detail:
📚Warren Buffett’s Ground Rules
📚The Warren Buffett Way
📚Buffett: The Making of an American Capitalist
📚The Warren Buffett Portfolio
📚The Snowball: Warren Buffett and the Business of Life
Each of these resources provides a comprehensive look into the mind of one of the most successful investors of all time. Personally I've read Buffett: The Making of an American Capitalist by Roger Lowenstein and it is fantastic.
 Long
Long
 Long
Long
BTC: Risk-off range below 110k, focus on 106.5k/105k/103k__________________________________________________________________________________
Market Overview
__________________________________________________________________________________
BTC is range‑bound with a cautious tilt: sellers cap 110k while 106.5k keeps holding. The 12H pressure remains down even as higher timeframes stay resilient.
Momentum: Range with a bearish tilt 📉 — multiple rejections below 110k and repeated defenses at 106.5k; 12H risk filter points Down.
Key levels:
• Resistances (HTF→Mid): 109,800–110,200 (supply), 111,500–112,000 (supply), 112,800–113,200 (HTF supply).
• Supports (HTF→Mid): 106,500–106,700 (pivot), 105,200–104,900 (6H floor ~105,013), 103,200–103,500 (2H/4H cluster + D pivot).
Volumes: Moderate on 30m–4H; no outsized catalyst.
Multi-timeframe signals: 12H/6H/4H/2H/1H trending down, 1D/1W up; below 110k, risk of 106.5k then 105k retests unless price reclaims 110.8k with volume.
Risk On / Risk Off Indicator: NEUTRAL SELL — confirms the cautious bias and the cap near 110k.
__________________________________________________________________________________
Trading Playbook
__________________________________________________________________________________
Strategic stance: range market with a risk‑off tilt; favor tactical fades at supply and only take defensive longs on validated floors.
Global bias: NEUTRAL SELL below 110k; main invalidation: daily close > 110,800 with volume and follow‑through.
Opportunities:
• Defensive long at 105,200–104,900 if wick + ≥2H reversal close; target 108k/110k.
• Secondary long at the 103,200–103,500 cluster on clean 2H/4H signal; add if 106,700 is reclaimed.
• Tactical short on rejection at 109,800–110,200 (or 111.5–112k) aligned with 12H Down; add on breakdown of 106,500 with volume.
Risk zones / invalidations:
• Sustained break < 106,500 invalidates an immediate bounce and opens 105k then 103k.
• Impulsive reclaim > 110,800 invalidates tactical shorts and unlocks 112–114k.
Macro catalysts (Twitter, Perplexity, news):
• Cautious liquidity into FOMC week; CPI eyed as a decisive catalyst.
• Soft 7‑day BTC spot ETF flows (risk‑off tone), making rallies fragile under 110–112k.
• Potential geopolitics/energy headline risk that can amplify moves at key levels.
Action plan:
• Long Plan (105k): Entry 105,200–104,900 / Stop ~104,500 / TP1 108,000, TP2 109,800–110,200, TP3 111,500–112,000 / R:R ≈ 1.8–2.5.
• Long Plan (103k): Entry 103,200–102,900 / Stop ~102,400 / TP1 106,700, TP2 108,000, TP3 109,800–110,200 / R:R ≈ 2.0–2.8.
• Short Plan (110k): Entry 109,800–110,200 / Stop 110,800 / TP1 108,200, TP2 106,700, TP3 105,200 / R:R ≈ 1.6–2.2.
__________________________________________________________________________________
Multi-Timeframe Insights
__________________________________________________________________________________
Intraday timeframes (≤12H) lean lower while 1D/1W remain resilient above key supports.
1D/1W (Up): Constructive structure, but 112.8–113.2 remains a HTF supply cap; bullish confirmation needs a reclaim >110.8k with volume.
12H/6H/4H/2H/1H/30m/15m (Down): Lower highs below 110k; 106.5k then 105k as key demand; breakdown of 106.5k risks acceleration.
Major confluences/divergences: Strong confluence around 103k (2H/4H cluster + D pivot ~103.5k) and a 6H floor near 105,013; the deeper 102k+ zone sits lower — high quality if reached.
__________________________________________________________________________________
Macro & On-Chain Drivers
__________________________________________________________________________________
Macro is in “wait‑and‑see” mode into FOMC/CPI and ETF flows stay soft, weighing on rallies under 110–112k.
Macro events: Markets cautious into FOMC and CPI; USD/liquidity guarded; geopolitics/energy risks can add volatility near key levels.
Bitcoin analysis: 7‑day negative BTC spot ETF flows (risk‑off backdrop); technical structure centered on 106.5k/105k/103k versus 110–112k supply.
On-chain data: Price below STH cost basis (~113.1k) and below the 0.85 quantile (~108.6k); elevated LTH distribution; put‑leaning options skew; higher IV — a defensive stance.
Expected impact: Technical NEUTRAL SELL bias intact; rallies likely faded unless volume improves and a >110.8k close confirms.
__________________________________________________________________________________
Key Takeaways
__________________________________________________________________________________
BTC remains range‑bound with a risk‑off tilt between 106.5k and 110k.
- Overall trend: short‑term neutral/bearish, HTF still constructive but capped by 110–112k supply.
- Most relevant setup: fade 109.8–110.2 or take defensive longs at 105k/103k only on ≥2H reversal signals.
- One key macro factor: FOMC/CPI week with soft ETF flows leaves rallies vulnerable without volume.
Stay disciplined: respect invalidations and wait for confirmation before leaning into a direction.
__________________________________________________________________________________ BTC: 106,845 defended, 113,425 caps — tactical range__________________________________________________________________________________
Market Overview
__________________________________________________________________________________
BTC is chopping in a corrective range after a leverage flush: HTF bias remains up, but a risk‑off backdrop caps rebounds below 111,775/113,425.
Momentum: ⚖️ Range with bearish intraday tilt; post‑flush context and a daily Kijun cap at 113,425.
Key levels:
• Resistances (4H–1D) : 109,800–111,775 (pivot zone) · 113,425 (daily Kijun) · 115,000–120,000 (stacked offers).
• Supports (4H–1D) : 106,845 (major pivot) · 104,900–102,080 (HTF shelf) · 99,823 (daily pivot).
Volumes: Overall moderate; a prior spike was absorbed (most visible on 6H).
Multi-timeframe signals: 1D/12H = Up (HTF intact) while 6H→15m = Down; buyers lean on 106,845, but expect rejections near 109,800–111,775 until 113,425 is reclaimed. Normalized volumes add false‑break risk mid‑range.
Risk On / Risk Off Indicator: NEUTRAL SELL — this contradicts the HTF up‑filter and argues for caution and reduced sizing below 113,425.
__________________________________________________________________________________
Trading Playbook
__________________________________________________________________________________
Core stance: range‑trade until 111,775/113,425 are decisively reclaimed, prioritizing confirmation and lighter sizing.
Global bias: Neutral with a bearish tilt while below 111,775/113,425; bias invalidated on daily acceptance above 113,425.
Opportunities:
• Tactical buy: Defended sweep/reclaim of 106,845 (15m/30m confirmation) → target 109,800 then 111,775.
• Breakout long: 12H/1D acceptance above 113,425 → target 118–120k; avoid if risk‑off tone intensifies.
• Tactical sell: Sharp rejection at 109,800–111,775 (volume pickup) → target 108,200 then 106,845.
Risk zones / invalidations: Acceptance below 106,845 voids longs and opens 104,900–102,080; clean acceptance above 113,425 voids tactical shorts and opens 118–120k.
Macro catalysts (Twitter, Perplexity, news):
• Friday CPI: likely resolver for the 113.5k pivot (breakout quality hinges on risk‑on/off tone).
• US BTC ETF outflows on 7‑day avg: dampen upside follow‑through on breakouts.
• Gold at record highs and UK/Japan access expansion: “hard‑asset” vs crypto flow balance may steer BTC demand.
Action plan:
• Entry: 107,200–107,600 (confirmed pullback above 106,845) or 108,650 (break&hold intraday).
• Stop: 106,450 (below structure).
• TP1/TP2/TP3: 109,800 / 111,775 / 113,425.
• R/R approx.: 2:1 to 3:1 depending on entry and execution.
__________________________________________________________________________________
Multi-Timeframe Insights
__________________________________________________________________________________
Broadly, HTF (1D/12H) remains up while LTF (6H→15m) lean down within a tight range.
1D/12H: Up‑filter, consolidation 106,800–111,800; acceptance > 113,425 unlocks 118–120k, otherwise risk of rotation back to 109,400 then 106,845.
6H/4H: Down momentum after failing at 111,775, compressing on support; the recent volume spike “cleansed” leverage, favoring edge fades.
2H/1H/30m/15m: Persistent down‑channel under 109,800–111,775; reclaims > 108,650 enable controlled mean‑reversions, loss of 106,845 reopens 104,900–102,080.
Major divergences/confluences: Strong confluence at 106,845/111,775/113,425; conflict between HTF Up and risk‑off backdrop → chop/false‑break risk mid‑range.
__________________________________________________________________________________
Macro & On-Chain Drivers
__________________________________________________________________________________
Macro is mixed: access keeps improving while ETF flows are soft and the tone is risk‑off, which tempers upside break quality until 113,425 is reclaimed.
Macro events: Record‑high gold (hard‑asset bid), ongoing geopolitics (Ukraine/Gaza), and upcoming CPI — all shaping selectivity of flows into BTC; UK ETPs and Japan bank allowances improve access.
Bitcoin analysis: US BTC ETF outflows (streak, weak 7‑day) weigh on break follow‑through; 115–120k stacked offers; pivotal 113.2k–113.5k cluster (STH CB + 128D SMA) gating 118–120k.
On-chain data: Heavy deleveraging with normalized funding; some LTH distribution; cleaner positioning but spot demand still tentative.
Expected impact: With risk‑off tone and 113,425 unclaimed, bias stays neutral/downside‑tilted; a CPI‑driven impulse plus better flows could unlock the 118–120k leg.
__________________________________________________________________________________
Key Takeaways
__________________________________________________________________________________
Post‑flush range with defended support and nearby overhead resistance.
- Overall trend: neutral with a bearish tilt while 111,775/113,425 cap price.
- Most relevant setup: fade 109,800–111,775 rejections or buy confirmed sweep/reclaim of 106,845.
- One key macro factor: risk‑off tone and ETF outflows reduce breakout quality.
Stay selective: trade the range edges, demand confirmation, and size to the backdrop. Bitcoin - Will Bitcoin also cross $100,000?!Bitcoin is located between EMA50 and EMA200 on the four-hour timeframe and is in its medium-term ascending channel. In case of an upward correction towards the specified supply range, it is possible to sell Bitcoin with a better risk-reward.
It should be noted that there is a possibility of heavy fluctuations and shadows due to the movement of whales in the market and compliance with capital management in the cryptocurrency market will be more important. If the downward trend continues, we can buy within the demand range.
Bitcoin’s recent rally has stalled under macroeconomic pressures, marking one of the most significant events in the asset’s history. With capital inflows into ETFs slowing and volatility spiking, the market has entered a recalibration phase—characterized by deleveraging, cautious investor sentiment, and a reliance on new demand to reignite the bullish trend.
This latest price decline is particularly concerning, as it marks the third time since late August that Bitcoin has fallen below roughly $117,000, a zone where most large holders are now underwater.
Following the largest liquidation cascade in Bitcoin’s history, capital inflows into U.S. spot ETFs have weakened alongside price declines. At the same time, the derivatives market has seen a sharp reduction in leverage, while ETF investors have shown mild selling pressure, resulting in a net outflow of about 2.3K BTC so far this week.
Unlike previous capitulation phases, where outflows typically accelerated price drops, the current slowdown reflects hesitation rather than panic. However, if weakness persists or ETF inflows take longer to recover, it could signal fragility on the demand side, undermining one of the core drivers behind Bitcoin’s past rallies.
During the recent liquidation wave, spot trading volumes surged to some of the highest levels of the year, reflecting intense market activity as traders rapidly adjusted their positions amid heightened volatility.
...دادهاند
In Q3 of this year, the number of publicly traded companies holding Bitcoin on their balance sheets hit a new record — despite ongoing market turbulence. According to data from Bitwise Asset Management, the number of listed firms with Bitcoin holdings grew by nearly 40% in just three months, reaching 172 companies.
Still, a recent October survey by Bank of America shows that 76% of investors currently hold no exposure to cryptocurrencies, up from 67% in September. Even among those with some allocation to digital assets, exposure remains minimal:
• 3% of investors hold only 2% of their portfolios in crypto.
• 1% allocate around 4% to cryptocurrencies.
• 3% have 8% or more of their portfolios invested in digital assets.... Short 
 Long
Long
 Long
Long
Long 
 Long
Long
 Long
Long
How to Short Gold as a Stock Trader and Profit on the DropGold is at historically high levels due to several key factors
Geopolitical Tensions: Trade disputes, regional conflicts, and global uncertainty are pushing investors toward safe-haven assets like gold
Monetary Policy Expectations: Anticipated interest rate cuts reduce the opportunity cost of holding gold, making it more attractive compared to bonds or cash
Weakening U.S. Dollar: A softer dollar makes gold cheaper for international buyers, boosting demand
Central Bank and Institutional Demand: Many central banks are increasing gold reserves, and institutional investors are allocating more to gold as a hedge against economic instability
Market Sentiment and Speculation: Bullish sentiment and speculative positioning are adding upward pressure on prices
If these factors start to ease, such as trade tensions reducing (highly likely with the next Trump Tweet), interest rates staying the same or even rising (less likely), or the dollar strengthening (likely), gold could start to pull back and given how aggressive its run has been, it could be a significant pull back.
For investors looking to profit from declines, inverse gold ETFs provide a way to benefit when prices fall, offering a strategic tool for hedging or directional trading.
They are a MUCH riskier type of trade - especially leverage ETFs so please do your research beforehand and definitely do not invest any money you can't do without if it all goes horribly wrong and Gold does indeed continue to head up past $5k.
Crazy times - hence probably why Gold is doing so well.
Buyer / bear - beware :)