Compare with Global X MSCI Argentina ETF
Key stats
Fund info
Home page
Inception date
Mar 2, 2011
Structure
Open-Ended Fund
Replication method
Physical
Dividend treatment
Distributes
Distribution tax treatment
Ordinary income
Income tax type
Capital Gains
Max ST capital gains rate
39.60%
Max LT capital gains rate
20.00%
Primary advisor
Global X Management Co. LLC
Distributor
SEI Investments Distribution Co.
ISIN
US37950E2596
CUSIP
37950E259
FIGI
BBG001K93GS6
Identifiers
ISIN US37950E2596
ARGT is the first ETF to provide exposure to the Argentine equity market. Eligible companies are those across various sectors that are classified in Argentina in accordance to MSCI Global Investable Market Index Methodology. In addition, companies that are listed, headquartered and carry out most of their operations in Argentina are also eligible for index inclusion. The fund is a concentrated portfolio that targets a minimum of 25 securities and 20 issuers at portfolio construction. The underlying index utilizes a capping methodology so that no individual constituent has a weight greater than 25% and the aggregate weight of constituents with over 5% weight in the index are capped at 50% weight of the portfolio. Index rebalancing occurs quarterly. Prior to August 15, 2014, ARGT traded as Global X FTSE Argentina 20 ETF and tracked FTSE Argentina 20 index.
Classification
What's in the fund
Exposure type
Retail Trade
Energy Minerals
Finance
Utilities
Breakdown by region
Top 10 holdings
Potential Diamond Formation in PlayNot yet confirmed, but a potential diamond formation seems to be developing on ARGT. Forget the noise — focus on the chart.
A trigger above 73.42 could confirm the breakout, with an upside target equal to the pattern’s height — which, interestingly, aligns with the 61.8% Fibonacci retracement level
Long ARGT ETFShould the 48.46 level hold then I think we'll see an expansion to 100. Price got ahead of itself due to overoptimism with Milei. People expected an overwhelming victory in the most recent elections, and he didn't deliver that. He lost the Buenos Aires election, but his party elected more people tha
Argentina's Strength through Fiscal ResponsibilityArgentina has made some of the hardest fiscal decisions of any country I can remember in my lifetime and with this has come growth and new investment.
We could see a strong bottoming signal from a bit ago of the Lin Reg + RSI indicator with all values below 50 and RSI below 30. Confirmed in the Wil
AGRT - ARGENTINA ELECTIONHi, today we are going to talk about AGRT
We observe a D1, some important points. The details are highlighted above.
Thank you for reading and leave your comments if you like.
Targets: Exclusive to Traders Heaven members.
Stop: Exclusive to Traders Heaven members.
Join the Traders Heaven tod
ARGT: Argentinian shares bottomed after the Primary electionsIt seems Argentinian stocks have bottomed here for now, after basing for 5 weeks, daily charts show some strength but there's risk going forward after the elections by October 27th. If the next president manages to surprise investors positively, the situation here might improve, and inflation drop d
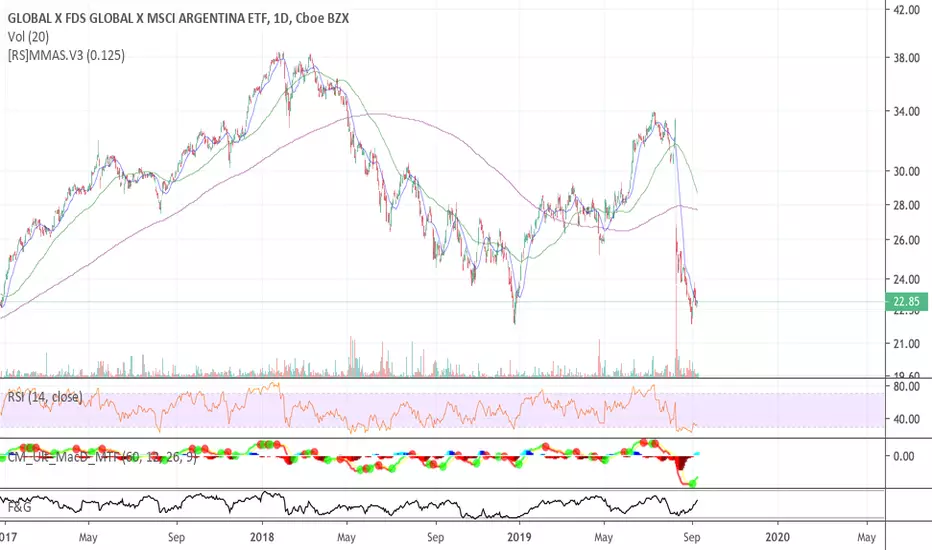
Point blankI just want to inform my followers of what happened to Argentina's stock market. The return to the Dec 2018 lows did not happen over months. It did not happen over weeks. It did not happen over days. The crux of it happened in a matter of overnight *hours* where the majority could do *nothing*.
See all ideas
Summarizing what the indicators are suggesting.
Oscillators
Neutral
Oscillators
Neutral
Summary
Neutral
Summary
Neutral
Summary
Neutral
Moving Averages
Neutral
Moving Averages
Neutral
Displays a symbol's price movements over previous years to identify recurring trends.
Frequently asked questions
An exchange-traded fund (ETF) is an investment product that holds a basket of assets such as stocks, bonds, futures, or other instruments, and trades on an exchange like a regular stock.
Why investors use ETFs:
– Easy way to gain exposure to sectors like stocks, bonds, real estate, or crypto
– Lower barrier to entry compared to buying individual assets
– Can help reduce volatility through diversification
Explore the largest ETFs: they are considered the most trusted and secure and will help you start your journey on the ETF markets.
Why investors use ETFs:
– Easy way to gain exposure to sectors like stocks, bonds, real estate, or crypto
– Lower barrier to entry compared to buying individual assets
– Can help reduce volatility through diversification
Explore the largest ETFs: they are considered the most trusted and secure and will help you start your journey on the ETF markets.
Markets don't sleep, here's what's going on with ARGT at the moment:
– Argentine stocks join the party as Milei's Libertarians win, but FX risks linger
– Argentina ADRs rally after Milei's party wins midterm elections
– Argentina ADRs rally after President Javier Milei's party wins midterm elections
See more updates in real-time with our News Flow.
– Argentine stocks join the party as Milei's Libertarians win, but FX risks linger
– Argentina ADRs rally after Milei's party wins midterm elections
– Argentina ADRs rally after President Javier Milei's party wins midterm elections
See more updates in real-time with our News Flow.
ARGT net asset value (NAV) is 78.41 USD. It represents the total value of the fund's assets less liabilities.
Other key metrics:
– ARGT AUM — 604.90 M USD
– ARGT discount/premium to NAV — −0.09%
– ARGT expense ratio — 0.59%
Explore more funds in our list of largest ETFs.
Other key metrics:
– ARGT AUM — 604.90 M USD
– ARGT discount/premium to NAV — −0.09%
– ARGT expense ratio — 0.59%
Explore more funds in our list of largest ETFs.
To put today's price into context, compare ARGT's performance across different time periods:
– 1 day — +0.20%
– 1 week — −5.52%
– 1 month — −9.49%
ARGT's all-time low was 14.12 USD on Mar 23, 2020, while its all-time high was 103.97 USD on Jan 28, 2026.
For a deeper look at market activity, explore the ETF Heatmap and the ARGT price chart.
– 1 day — +0.20%
– 1 week — −5.52%
– 1 month — −9.49%
ARGT's all-time low was 14.12 USD on Mar 23, 2020, while its all-time high was 103.97 USD on Jan 28, 2026.
For a deeper look at market activity, explore the ETF Heatmap and the ARGT price chart.
The safest way to buy ARGT is through a reliable broker. Create an account, fund it, and place a buy order.
You can trade ARGT directly from TradingView:
– Choose a broker: Explore our supported trading partners and pick one that fits your needs
– Compare options: View available brokers side by side to evaluate fees and features
– Connect your account: Open Supercharts, click “Trade”, select your exchange, and log in
– Start trading: Place orders directly from the chart
Tip: If you’re new to trading, try paper trading first — it lets you practice strategies in real market conditions without risking funds.
You can trade ARGT directly from TradingView:
– Choose a broker: Explore our supported trading partners and pick one that fits your needs
– Compare options: View available brokers side by side to evaluate fees and features
– Connect your account: Open Supercharts, click “Trade”, select your exchange, and log in
– Start trading: Place orders directly from the chart
Tip: If you’re new to trading, try paper trading first — it lets you practice strategies in real market conditions without risking funds.
Global X MSCI Argentina ETF expense ratio is 0.59%. It represents the annual cost of managing the fund, expressed as a percentage of its assets.
Other key metrics:
– ARGT AUM — 604.90 M USD
– ARGT NAV — 78.41 USD
– ARGT discount/premium to NAV — −0.09%
Explore more ETFs with highest expense ratio and find even more stats in the ETF Screener.
Other key metrics:
– ARGT AUM — 604.90 M USD
– ARGT NAV — 78.41 USD
– ARGT discount/premium to NAV — −0.09%
Explore more ETFs with highest expense ratio and find even more stats in the ETF Screener.
Before making an investment decision, it's important to understand how the ETF works and whether it aligns with your goals and risk tolerance. Consider factors such as:
– The ETF's holdings
– Whether it is passively or actively managed
– Whether it uses leverage
– Its costs, performance, and other characteristics relevant to your strategy
You can also use technical analysis to assess current market conditions. Our summary Technical Ratings for ARGT are:
– Today — sell
– 1 week — sell
– 1 month — sell
For a deeper analysis, explore other ARGT technicals and follow the latest ETF news.
– The ETF's holdings
– Whether it is passively or actively managed
– Whether it uses leverage
– Its costs, performance, and other characteristics relevant to your strategy
You can also use technical analysis to assess current market conditions. Our summary Technical Ratings for ARGT are:
– Today — sell
– 1 week — sell
– 1 month — sell
For a deeper analysis, explore other ARGT technicals and follow the latest ETF news.
ARGT trades at a discount (0.09%).
Premium/discount to net asset value (NAV) expresses the difference between the ETF's price and its NAV value.
– A positive percentage indicates a premium, meaning the ETF trades at a higher price than the calculated NAV.
– A negative percentage indicates a discount, suggesting the ETF trades at a lower price than NAV.
You can find more funds in the list of highest discount to NAV.
Premium/discount to net asset value (NAV) expresses the difference between the ETF's price and its NAV value.
– A positive percentage indicates a premium, meaning the ETF trades at a higher price than the calculated NAV.
– A negative percentage indicates a discount, suggesting the ETF trades at a lower price than NAV.
You can find more funds in the list of highest discount to NAV.
ARGT follows the MSCI All Argentina 25/50.
ETFs usually track some benchmark seeking to replicate its performance and guide asset selection and objectives.
Indices usually act as such benchmarks by tracking a group of companies or specific sectors, giving a broad view of market performance.
ETFs usually track some benchmark seeking to replicate its performance and guide asset selection and objectives.
Indices usually act as such benchmarks by tracking a group of companies or specific sectors, giving a broad view of market performance.
The fund's management style is passive, aiming to replicate the performance of the MSCI All Argentina 25/50 by holding the same assets in similar proportions.
What it means:
– Index tracking: Mirrors the composition and weight of the underlying index
– Low turnover: Fewer trades compared to active funds
– May be more cost-efficient: Passive approach typically results in lower fees (expense ratio)
Combine this knowledge with other metrics:
– ARGT AUM — 604.90 M USD
– ARGT NAV — 78.41 USD
– ARGT expense ratio — 0.59%
Explore more details in the Profile section.
What it means:
– Index tracking: Mirrors the composition and weight of the underlying index
– Low turnover: Fewer trades compared to active funds
– May be more cost-efficient: Passive approach typically results in lower fees (expense ratio)
Combine this knowledge with other metrics:
– ARGT AUM — 604.90 M USD
– ARGT NAV — 78.41 USD
– ARGT expense ratio — 0.59%
Explore more details in the Profile section.
Today, ARGT trades at 78.45 USD.
For broader market analysis, dive into the technicals on the ARGT price chart and read the latest ARGT news:
– Argentine stocks join the party as Milei's Libertarians win, but FX risks linger
– Argentina ADRs rally after Milei's party wins midterm elections
– Argentina ADRs rally after President Javier Milei's party wins midterm elections
For broader market analysis, dive into the technicals on the ARGT price chart and read the latest ARGT news:
– Argentine stocks join the party as Milei's Libertarians win, but FX risks linger
– Argentina ADRs rally after Milei's party wins midterm elections
– Argentina ADRs rally after President Javier Milei's party wins midterm elections
ARGT assets under management (AUM) is 604.90 M USD. It represents the total market value of all assets held by the fund.
Other key metrics:
– ARGT NAV — 78.41 USD
– ARGT expense ratio — 0.59%
– ARGT premium/discount to NAV — −0.09%
Explore more funds in our list of largest ETFs. For deeper analysis, check the ETF Screener.
Other key metrics:
– ARGT NAV — 78.41 USD
– ARGT expense ratio — 0.59%
– ARGT premium/discount to NAV — −0.09%
Explore more funds in our list of largest ETFs. For deeper analysis, check the ETF Screener.
ARGT fund flows account for −53.49 M USD, showing the net amount of money entering or leaving the fund over 1 year. Many traders use it to get insight into investors' sentiment and evaluate whether it's time to buy or sell the fund.
Other key metrics:
– ARGT AUM — 604.90 M USD
– ARGT discount/premium to NAV — −0.09%
– ARGT expense ratio — 0.59%
For broader market analysis, read the latest market news and read the ETF trading ideas.
Other key metrics:
– ARGT AUM — 604.90 M USD
– ARGT discount/premium to NAV — −0.09%
– ARGT expense ratio — 0.59%
For broader market analysis, read the latest market news and read the ETF trading ideas.
ARGT invests in stocks. See more details in our Profile section.
No, ARGT isn't leveraged, meaning it doesn't use borrowings or financial derivatives to magnify the performance of the underlying assets or index it follows.
Yes, ARGT pays dividends to its holders with the dividend yield of 1.32%.
The dividends come from the underlying assets in ARGT and are distributed periodically to investors.
Explore more in the dividend-paying ETFs list and follow dividend updates in the Dividend Calendar.
The dividends come from the underlying assets in ARGT and are distributed periodically to investors.
Explore more in the dividend-paying ETFs list and follow dividend updates in the Dividend Calendar.
ARGT shares are issued by Mirae Asset Global Investments Co., Ltd.
ARGT started trading on Mar 2, 2011. The launch date marks the fund's first day on the exchange and the start of its publicly available price history.
The age of a fund can be useful when evaluating its track record, as older funds typically provide more historical data for analyzing performance across different market conditions.