BNBUSDT Potential Bear ActionPotential bearish scenario to this asset. Price action is suggesting a further drawdown to the 239USDT demand region as the actual pullback seems to be accomplished. The reciprocal AB=CD pattern projection is reinforcing this idea, as a Head and Shoulders pattern is likely in formation. Thus, on this hypothetical 30m scenario, the price can made a ranging interacting w/ the neckline. Chaikin Money Flow hidden divergence & below zero + Awesome oscillator twin peaks in formation + Fisher Transform
Fibonacci Confluence
EURUSD weekly outlook: Bearish bias for June weeks 3-4Weekly Outlook (W)
Bear bias until price action establishes an uptrend above 1.1092
6/15/23
Still making higher highs and lower highs
Last week of May just made the last higher low @ Weekly fib 78.6 level
Expectation:
IF
Continues uptrend: reach last HH level or 1.1100 and eventually 1.1250 (27 ext)
If not:
Price reactions from levels below:
1) 0.0865
H&S Weekly line and does a downtrend from there
2) Weekly IMB and OB with BOS down.
INVALIDATION POINT: 1.1092
📈 Fibonacci Power in Uptrends📍 What Are Fibonacci Retracement Levels?
Fibonacci retracement levels—stemming from the Fibonacci sequence—are horizontal lines that indicate where support and resistance are likely to occur.
Each level is associated with a percentage. The percentage is how much of a prior move the price has retraced. The Fibonacci retracement levels are 23.6%, 38.2%, 61.8%, and 78.6%. While not officially a Fibonacci ratio, 50% is also used.
The indicator is useful because it can be drawn between any two signi
$EURUSD Can Jump #EURUSDTraders and Investors,
EURUSD has been falling after reaching one of our long-term targets. Now it is at a junction from which it can make a little jump. The price action is still weak, so we must be watchful and wait for good confirmations.
Please support this analysis by liking and sharing. 👍🙂
Rules:
1. Never trade too much
2. Never trade without a confirmation
3. Never rely on signals, do your own analysis and research too
✅ If you found this idea useful, hit the like button, subscribe a
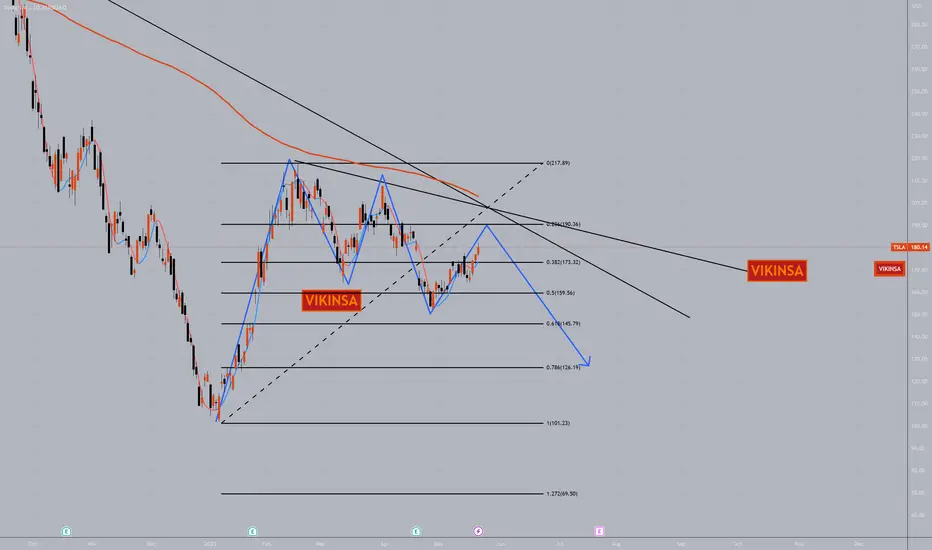
$TSLA Can Fall #TeslaTraders and Investors, Tesla has been in a downtrend and is looking weaker at the moment. It is forming a potential M pattern which can push the price down. A good confirmation may be needed to initiate a position.
Please support this analysis by liking and sharing. 👍🙂
Rules:
1. Never trade too much
2. Never trade without a confirmation
3. Never rely on signals, do your own analysis and research too
✅ If you found this idea useful, hit the like button, subscribe and share it in other trading
$EURCAD Can Rise Now #EURCADTraders, EURCAD has been falling nicely and gave us a very good short trade. Now it has completed an M pattern in a medium time frame. When the M pattern completes the market goes up. So we can expect this market to rise up any time.
Beware that this can still form an extended M pattern as we have a trend lines cross. So trade what you see and only with a confirmation.
Please support this analysis by liking and sharing. 👍🙂
Rules:
1. Never trade too much
2. Never trade without a confirmatio
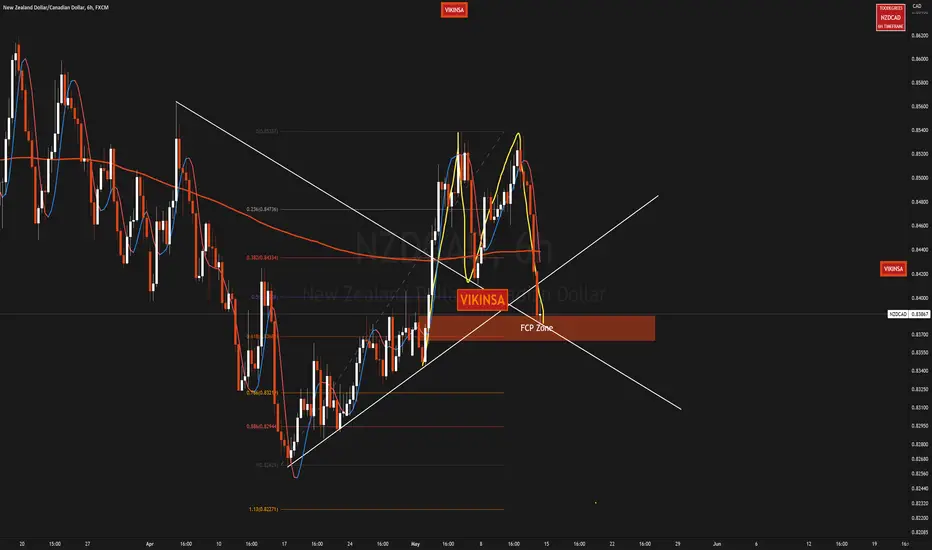
$NZDCAD Can Rise On An M Pattern #NZDCADTraders, NZDCAD has been falling nicely and gave us a very good short trade. Now it has completed an M pattern in a medium time frame. When the M pattern completes the market goes up. So we can expect this market to rise up any time.
Please support this analysis by liking and sharing. 👍🙂
Rules:
1. Never trade too much
2. Never trade without a confirmation
3. Never rely on signals, do your own analysis and research too
✅ If you found this idea useful, hit the like button, subscribe and share i
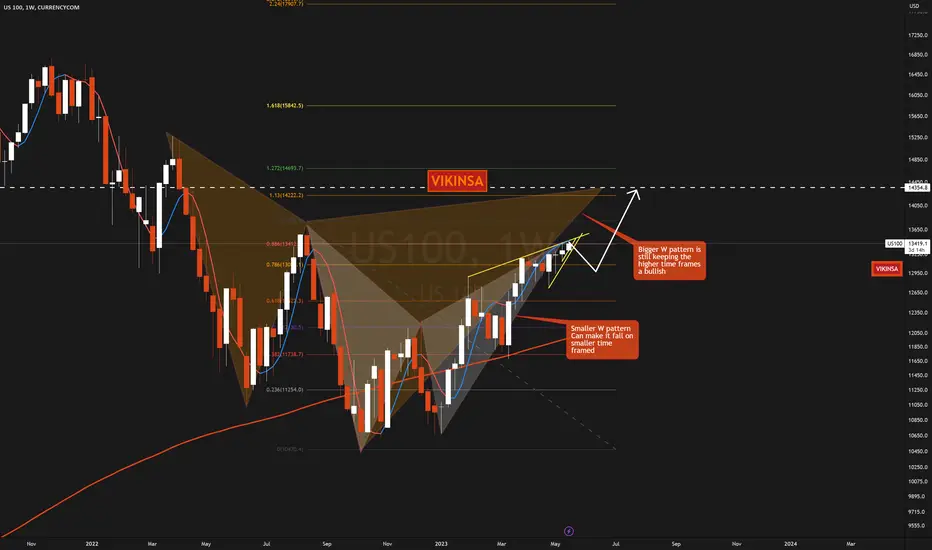
#NASDAQ Can Go Higher $NQ $NDX On The Higher Time FramesTraders, We have been bullish since the last quarter of 2022 on this market. NASDAQ now is reaching a point of a possible breakout. Short term it can go a down a bit but on this higher time frame, it is still forming a bigger W FCP Pattern which means that it is still on its target to reach higher levels.
Please note that the chart is Weekly timeframe.
Please support this analysis by liking and sharing. 👍🙂
Rules:
1. Never trade too much
2. Never trade without a confirmation
3. Never rely on s
U
$EURGBP Can Fall Down Further Before Rising Up #EURGBPTraders, EURGBP last week showed a rejection from the 200 sma. It fell a bit from there. We have a potential M pattern forming on the daily time frame. So it can continue to fall until it reaches one of the FCP zones where it can bounce upward again.
Please support this analysis by liking and sharing. 👍🙂
Rules:
1. Never trade too much
2. Never trade without a confirmation
3. Never rely on signals, do your own analysis and research too
✅ If you found this idea useful, hit the like button, sub
$DXY Latest Analysis #DXY #USDOLLARTraders and Investors,
It is still consolidating. I tried to go higher in the last week of the last month but failed to keep the breakout. There is a double bottom below which can target liquidity but trade what you see. It may or may not happen. Below this, we have 100 as the psychological level. A possible W pattern is also forming. It is not confirmed yet and is just a scenario (possibility) for now to consider. The higher time frame levels are there on the chart.
Please check USDCHF and
$CADJPY Can Rise #CADJPYCADJPY has a similar pattern as USDJPY. Please see the attached USDJPY analysis:
Please support this analysis by liking and sharing. 👍🙂
Rules:
1. Never trade too much
2. Never trade without a confirmation
3. Never rely on signals, do your own analysis and research too
✅ If you found this idea useful, hit the like button, subscribe and share it in other trading forums.
✅ Follow me for future ideas, trade setups, and updates on this analysis
✅ Don't hesitate to share your ideas, comments, opi
$GBPUSD Watch These 2 Zones On #GBPUSD Traders and Investors,
GBPUSD has been very bullish but the recent price action has started to show signs of fatigue. So watch these 2 zones (as marked on the chart) for a possible correction downward or trend reversal. A proper confirmation will be needed as the trend has been strong.
Please support this analysis by liking and sharing. 👍🙂
Rules:
1. Never trade too much
2. Never trade without a confirmation
3. Never rely on signals, do your own analysis and research too
✅ If you found this
$USDJPY Can Rise #USDJPYTraders and Investors,
Overall on the monthly and weekly time frame, it is still bullish although it fell down from the 150 level. Once this sort of thing happens, it is natural for the price action to revisit areas around previous highs to form a W pattern. USDJPY created a double top this week and fell down. now we are watching a few zones and the trend lines which can provide support to the price. If the price gets supported it can target that liquidity above the double top. This also can le
$USDCHF Can Rise Soon #USDCHFTraders and Investors,
USDCHF has completed a weekly M pattern as we approach the end of this week. Remember this is a weekly time frame pattern so may take days and weeks but we can expect USDCHF to rise upward because of the M pattern and trend line. This can impact EURUSD inversely and also can give strength to DXY (USDOLLAR) which in turn can impact all asset classes.
Last week (the last week of April) a rise in this gave strength to DXY. This can happen again. So beware of this potential
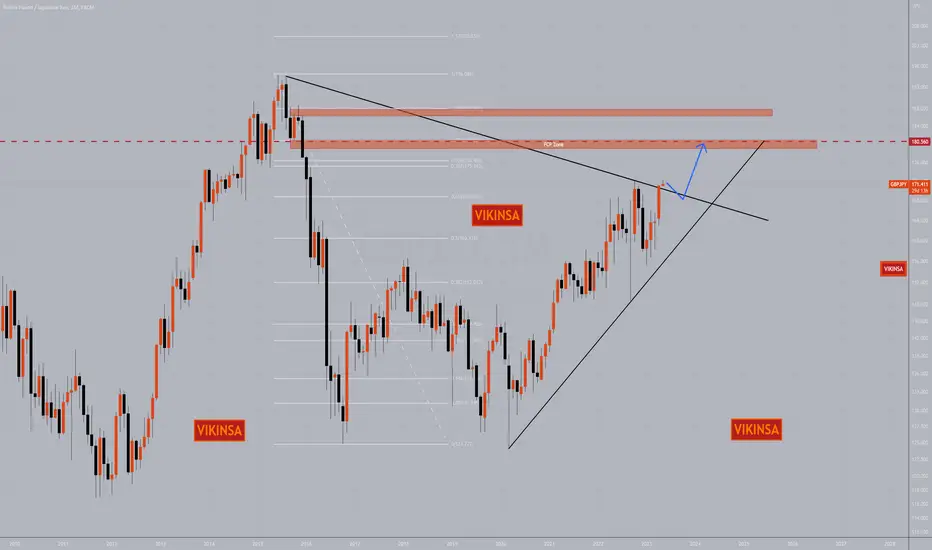
$GBPJPY Can Go Much Higher #GBPJPYTraders and Investors,
GBPUSD fell to multi-decade lows last year and since then it has been consistently rising up. Whilst GBPUSD itself was not moving that sharply up, other pairs such as GBPJPY showed much higher strength. GBPJPY last week/month crossed an important barrier. If this trend line and this correct resistance level are broken and confirmed, GBPJPY can rise much higher into FCP zones as marked on the chart to complete potential W patterns.
Please note that this is a Weekly/Month
BTCUSDT ZIGZAG heading to 19600USDTBTCUSDT entered in a downtrend on a corrective intermediate Zig-Zag pattern, in which minor wave-(A) is potentially aiming the greater demand @ 19600. A swing trading plan can be made easily based on supply and demand theory, avoiding to trade in the grey sectors, so-called equilibrium zone.
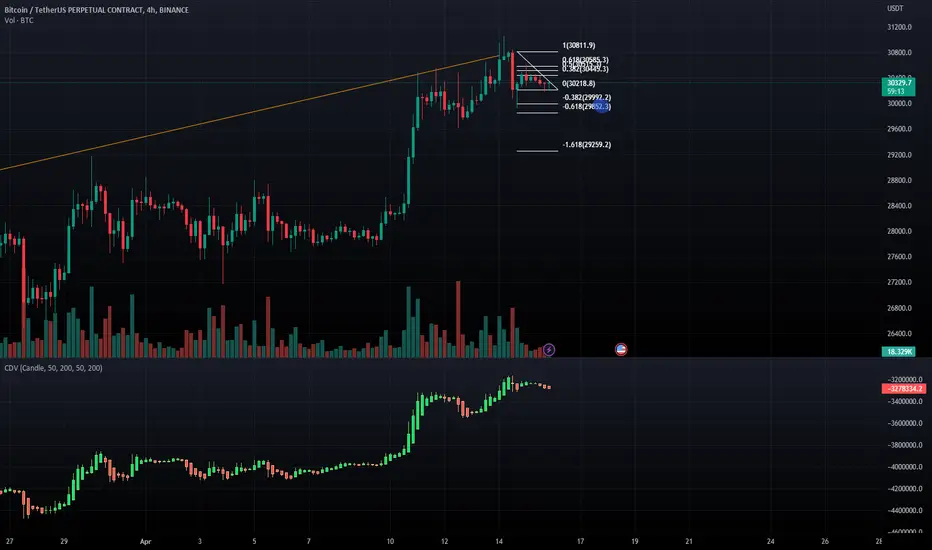
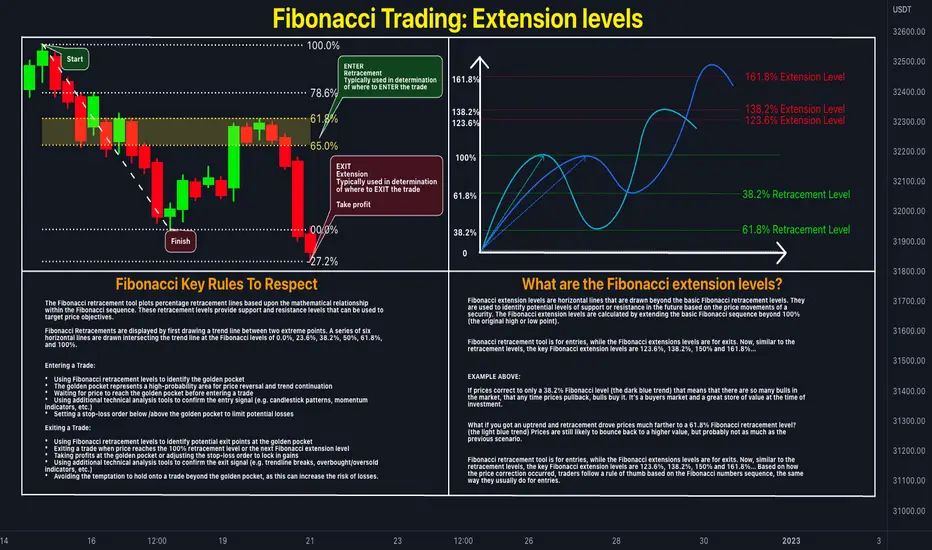
📊 Fibonacci Trading: Extension LevelsThe Fibonacci retracement tool plots percentage retracement lines based upon the mathematical relationship within the Fibonacci sequence. These retracement levels provide support and resistance levels that can be used to target price objectives.
Fibonacci Retracements are displayed by first drawing a trend line between two extreme points. A series of six horizontal lines are drawn intersecting the trend line at the Fibonacci levels of 0.0%, 23.6%, 38.2%, 50%, 61.8%, and 100%.
📍 How this indic
LINKUSDT is testing the support right nowLINKUSDT is testing a key level at the $9.1 area, where the market has previously encountered resistance.
This level is important because it has acted as a significant point of resistance in the past, and traders will be closely watching the price action to see if the level is broken. If the price of LINKUSDT is able to break through this key level and establish new support, this could signal a potential bullish trend.
To apply Plancton's Rules in this scenario, traders should wait for the new
The Ultimate Algorand (ALGO) Analysis - Bottom $0.1618On the 22nd June 2019, Algorand opened at a price of around $3.28 on Coinbase, and slightly higher on Binance.
Over the next few months, it dropped to around $0.1648 (maybe $0.1618 on some exchanges) and then $0.097 at the Covid crisis.
Before the 2021 bull run, in November, ALGO's Support level was around $0.2247 (Point X of the harmonic) before it began its ascend.
In early February of 2021, ALGO topped around $1.8427 (Point A of the harmonic)
This increase is by an exact amount of $1.618,
Fibonacci Retracement Levels In Forex TradingBoth novice and seasoned traders use Fibonacci levels as one of the most common and universal strategies when trading forex and other markets. It is a well-known fact that market prices incline toward levels where the bulk of market orders are gathered. Such levels can be found and predicted using a variety of ways.
Systems for trading are built on a variety of levels. Since traders first realized that the price fluctuations of some assets frequently followed the Fibonacci number sequence, the
Bitcoin Starting Wave III run to ~20,000 with ~16,250 S/LBullish continuation for D1 through W1 on BTCUSD after confirming the higher high on the D1 timeframe from late December. W1 timeframe showing promise to close near the late November weekly high, confirming the higher low from mid November and continuing up towards 20,000 with a stop loss around 16,250.
Entry at ~17,000 should have a good Return to Risk ratio of 3:1 but a drop to ~16,650 is possible. Using the same S/L would yield ~9 R/R. I would suggest starting a small position at ~17,000 an