ARPA is starting a new uptrend. This is going to be hugeARPA is looking really good on the major timeframe. We have a breakout of the local small parallel channel and the volume last year was pretty strong. 25x is possible on this coin in 2024. Take profit at the top of the parallel channel or 1:1 FIB extension (LOG). It looks like the pump is starting, so it is time to buy if you are interested in this coin. Let me know what you think about my analysis, and please hit boost and follow for more ideas. Thank you, and I wish you successful trades!
ARP
Fibonacci Extension
CHZ will 50x in 2024/2025! Buy now.Technical analysis
CHZ is breaking out of the descending parallel channel after an incredible 1085 days! This is a huge event for this coin, and of course, I am expecting a massive pump in the near future. The pump is starting right now, so I recommend buying this coin right now. From the Elliott Wave perspective, we have completed a WXYXZ correction inside this channel, which is always good to see! This coin can 50x in the upcoming months.
Let me know what you think about my analysis, and pl
SUPER: 5800% profit in 2024/2025Technical analysis
SUPER is pumping hard; there is no doubt about it, and the trend should continue in the next few weeks and months! I recommend buying SUPER right now for a 50x profit in 2024/2025. We can see that the downtrend has ended with a descending parallel channel, and bullish volume is very high, which is always good to see! From the Elliott Wave perspective, we have completed a triple-three corrective pattern (WXYXZ), and we are in a new impulse wave.
Let me know what you think a
GOLD - New all-time-high soon! (Buy now)Gold looks extremely bullish in the short-term and also in the long-term. 5000 USD or 10000 USSD in the next few years is definitely very likely, but right now let's focus on the short-term price action.
We can see that GOLD is in a strong uptrend, and we can use a simple trendline tool to measure its strength. The price respects the blue trendline pretty accurately, and the uptrend is valid as long as this trendline holds. Of course, nothing lasts forever, and to be bearish, we need to wait fo
EURUSD | MT Long H4 |Overly OversoldPair: FX:EURUSD
Timeframe: H4 - Medium Term (MT)
Direction: Long
Technical Confluences for Trade:
- Stochastics are in Oversold Conditions on D1, H4 and H1 time-frames
- Price action has some support trend-line holding it
- Horizontal trendline looks like a demand zone across the years
- Horizontal trendline (Red) is at the 1% Fib Extension Level
- Aiming for the 32.8% Fibo Retracement with 23.6% as the TP 1 level
Fundamental Confluences for Trade:
- EUR weakness has been mostly be
BTC: Two potential target prices
- Two critical support zones correspond with the 0.382 and 0.618 Fibonacci retracement levels of the entire swing from A to B, enhancing the significance of these support levels.
- After two months of ranging, the price finally broke below the critical support zone as volume spiked, confirming the breakout and leading to a significant drop.
- If the price does not return above the first support zone , two potential target prices can be anticipated:
1. A 100% extension of the large purple
Bitcoin - Crash to 57k, then 100k! (must see)The price of Bitcoin is preparing for a final drop to the downside, to 57k per my calculations! The price is still inside this bullish flag formation, and we still need to complete the ABC corrective pattern from the Elliott Wave perspective. At this point, I cannot be bullish at all, just be patient and wait for 57k to be hit before buying BTC!
It's also important to take a look at the long term trendline (October 2023 -> January 2024). We have 2 touches, and the 3rd touch is inevitable soone
BTC-USDT | 4H | TECHNICAL CHARTHello traders, Bitcoin has made its first 5 waves, now it's time for the abc waves. This is the exact move I'm expecting in Bitcoin, traders.
PS: Thank you very much that you support me with your likes and Comments
If you have another analysis at this pair, please share in comments, I will be glad to discuss with you.
Thank you for considering my analysis and perspective.
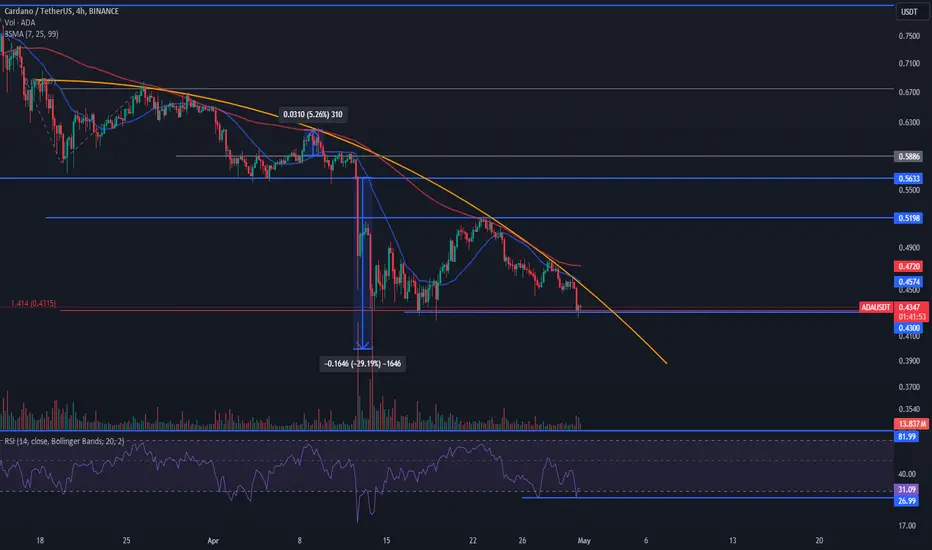
📈Potential Short Opportunity in FTM: Technical Analysis🔥🔍In today's analysis, we observe a continuation of yesterday's market movement, characterized by a minor downward trend. Yesterday's correctionary movement, as discussed in our previous analysis, has extended into the London time frame today. This movement has nullified all corrections suggested yesterday, indicating the potential for a second wave of decline in altcoins, notably in FTM/USD.
⚡️Our focus today is on positioning for a short trade in FTM/USD, leveraging a strong trigger point at $
FShort
📈ADA Market Analysis: Navigating the Current Trends🎯🔍et's embark on our daily market analysis journey. The market witnessed another minor downturn recently. Bitcoin's dominant bullish candles may have overshadowed, causing altcoins like ADA to experience further decline. Among these altcoins, ADA, which we previously analyzed, remains under our scrutiny.
🔄First and foremost, let's review the trading triggers provided in the previous analysis. For long positions, as previously mentioned, a breakout and consolidation above $0.5886 could have initi
Bajaj Hindustan - On Sugar Rush :)Bajaj Hindustan Sugars is in Super Bullish Mode off late. Let's compare the Weekly Vs Quarterly pattern below
On Weekly:
1. Price is about to BO of Rounding Bottom Pattern above 40.5 for Target of 54
2. Fibonacci 0.618 retracement for Targets of 42, 50
On Monthly:
1. Inv Head and Shoulder BO confirmed on Monthly for Target of 54 (which is matching the Rounding Bottom BO on Weekly)
2. Larger Rounding Bottom BO pending above 40.5 for Target of 78
Disclaimer:
3+ Years Teaching Experience in
MATIC.usd stuck between the proverbial Rock and Hard PlaceMATIC currently range bound by major fibs.
Break in either direction should pop violently.
Golden fib above is stronger than blue support.
=========================================
M
MARUTI SUZUKI - A long term Investment Idea - 50% ROI expected.1) The stock is breaking out of a 6 year old consolidation zone in yearly time frame.
2) The stock is reversing from a Fib 61.8% in yearly time frame.
3) The stock is breaking it's previous swing high.
4) The stock is above to form a strong 3 Month breakout if March closes strong.
The stock structure looks strong, one may accumulate in dips for a long term target of 19000.
#genus power ready for next leg of rally?Genus power after breaking out in May 2023 has moved around 164% in a span of 1 year. Then corrected around 26% and once again it has started moving up. This week it tested a strong fib resistance level of 338 and if this or next week manages to sustain above this number then it can try to touch 1) 366 2) 387 3)398 4)413(imp level) 5)443 6) 463 7) 490(imp level). Since my proprietary indicator is telling me that there can be some sort of pullback so I would like to wait for it to initiate long o
Where Does TSLA Land?
Trend
- Downtrend confirmed.
- Components of the channel chart:
The original downtrend channel plus a 100% extended channel.
Both channels divided in half by blue dotted lines.
The shaded zones furthest from the center represent "overbought/oversold forces," which counterbalance each other.
- Currently, the price is descending into the extended channel, suggesting a chance of reaching the lower band of the extended channel.
- Note that when the price enters the orange shaded zone, it
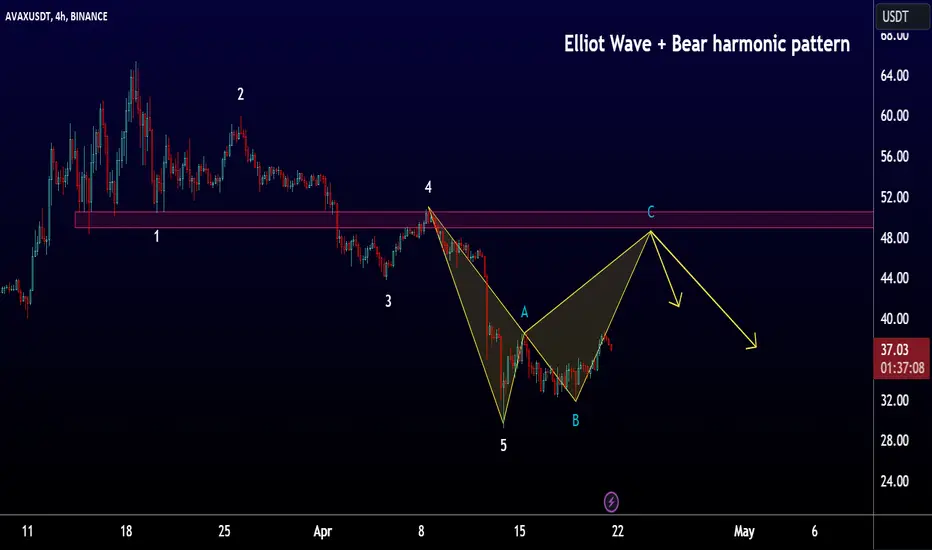
AVAX-USDT | 4H | TECHNICAL CHARTHello traders, AVAX has completed its first 5 waves, and now it's time for the completion of the ABC wave. Right after the completion of wave C, I combined harmonic patterns and made an analysis of both. I marked my target with yellow arrows on the chart after the completion of the harmonic pattern.
If you want me to keep my analysis up to date, please don't forget to like this post.
Thank you for considering my analysis and perspective.
BTC Playing Devils Advocate DOWNSIDE & UPSIDE (30m) pt2Holding 60 K as recent local low, potential retracement's as shown
30m strategy signals are pulling back to support then pushing higher.
Halving event brought no significant volatility into the weekend trading.
** use previous FIB level as Stoploss for LONG/BUY
*** seek next FIB zone as target for taking profits/support/pullback
--Message me for strategy settings 5, 30, 3hr, 18hr Charts
NASDAQ:APP @Aceofwaters
From Leonardo to Trading: The Evolution of Fibonacci LevelsIn the labyrinthine landscape of financial markets, where volatility reigns supreme and uncertainty lurks around every corner, traders seek reliable navigational tools to steer through the tumultuous waters of price movements. Among the myriad techniques at their disposal, Fibonacci analysis emerges as a stalwart companion, offering a nuanced understanding of market dynamics rooted in mathematical precision. In this comprehensive exploration, we delve deep into the multifaceted realm of Fibonacc
TSM: After Downgrading The Outlook, What To Expect?
Trend
- On the weekly chart: Clearly showing an uptrend.
- The uptrend channel has extended 100% and is expected to return to the middle line at least, with a chance of reaching the lower band of the original channel.
100% Symmetrical Projection: Uptrend “N” Patterns
- A 100% Symmetrical Projection of the initial swing (from A to B) and then projected from C. As a result, D was our initial target price.
- Without a symmetrical retracement from D to E, there's a resistance-turn-suppo
MSFT’s Momentum Weakening: Where’re the defending levels?
Trend
- On the weekly chart: Still within the large uptrend channel since January 2023.
- On the daily chart: The minor uptrend channel since October 2023 was broken with moderate volume.
- Although the long-term uptrend remains intact, the short-term momentum may be pausing.
100% Symmetrical Projection: Uptrend “N” Patterns
- There are two price projection models, both leading to the same ultimate target price of $457.
The large purple N, starting from January 2023.
The small or
Bitcoin is ready for a 15% crash! (to 58k)Bitcoin may look pretty bullish, but do not get distracted. The price is forming a bearish distribution pattern inside a bearish parallel channel, as you can see on the chart. Right now, the odds are in favor of another crash. I am not saying this only because of the price action, but also because of the Elliott wave theory: as per my wave count, I am expecting bitcoin to finish wave (C) with a 1:1 Fibonacci extension level. Also look at previous waves, and waves (B) at this point look like an A
Bitcoin - Buy the DIP! Ready for 80k.Bitcoin is definitely ready to go higher, and it's a really good time to buy the dip after the previous crash! We can see that the price is making higher lows on the daily chart, which is a strong sign of an uptrend. The price is currently still inside this symmetrical triangle, so we are waiting for an explosive move, probably to the upside. The trend is your friend until the end, and the trend is still intact bullish. 17% profit if you buy at the current price is very possible in the next few
Ethereum - is ready to go higher! +32% this monthEthereum is still very bullish, so there is no reason to expect lower prices at this moment. We can see that the price broke out of this ascending parallel channel and retested it. Usually you want to wait for a retest and then enter a long position, which is happening right now! You can place your stop loss below the previous swing low (inside the ascending channel).
On the chart, you can see my detailed Elliott Wave count. We are in the bull market, so we can expect an impulse wave to form. I
Gold's Ultimate Destination: Breaking Down Critical Levels
Trend
-- The price has surpassed the healthy channel from the end of 2022.
-- It is possible that the momentum move is nearing its end and entering an overbought zone.
100% Symmetrical Projection: Uptrend "N" Patterns
There are two "N" Patterns: a Large Purple N and a Small Orange N.
N Pattern's Target Price & Fibonacci Price Cluster
-- The target price of $2356 (Orange N) almost perfectly aligns with two other Fibonacci levels.
-- The target price of $2480 (Purple N at 1.5X) m