$BTC Sunday Report Bitcoin touched 116.6K CRYPTOCAP:BTC Sunday Report
Bitcoin touched 116.6K right where we expected, and I’m still holding my short position with eyes on lower targets. If price pushes into the 120–125K zone, I’ll add more there.
We already saw a dump from 116K to 107K three weeks ago, and now BTC has returned to the 116K zone, but this hasn’t changed the overall picture. Market makers continue to push altcoins higher to trap liquidity before the real move down.
⚠️ The FOMC meeting a key event, with the policy stat
Seasonality
This coin did 152X v Bitcoin previously. Can it do a 15x now?I am just presenting price action with this idea share.
But during manic periods of speculation, all rational thought will go out the window.
That we know for certain
How else can you rationalise a forked copied uncollateralised stablecoin that ran up so hard versus #Bitcoin in the past...?
You tell me.
Clearly there must be some sort of community behind this price rise?
Some sort of thesis?
A narrative?
Or at least some sort of on chain evidence of work being done to describe this move
DLong
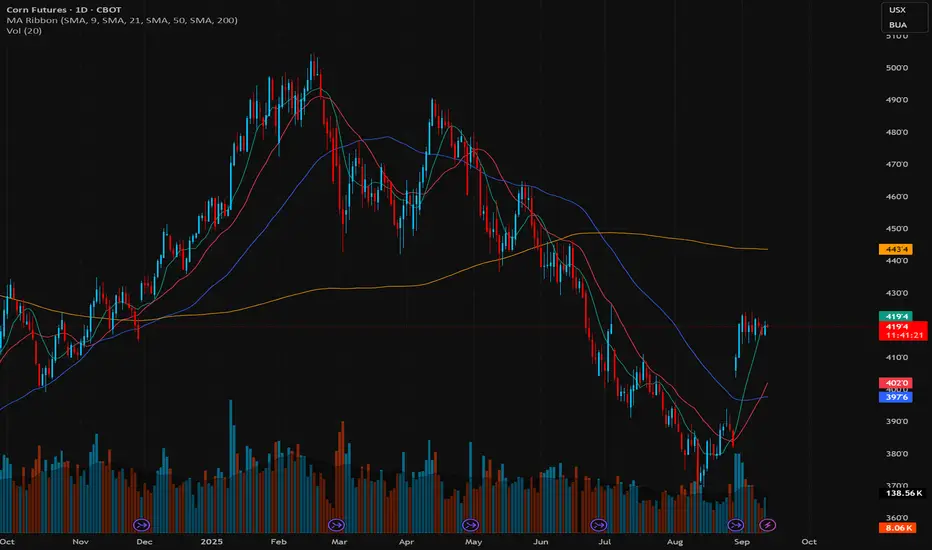
Long Corn📌 When is Corn in High Demand & How Does It Cycle Internationally?
Corn demand follows a seasonal and geographical cycle based on harvest seasons, global weather patterns, livestock feed demand, and ethanol production. Smart traders can rotate between corn-producing nations and their related stocks to profit from month-to-month price cycles.
🔹 1. When is Corn Demand Highest? (Bullish for Corn Prices & Stocks)
✅ Q3-Q4 (August – November) → U.S. Harvest Season & Export Surge
The U.S. is the larg
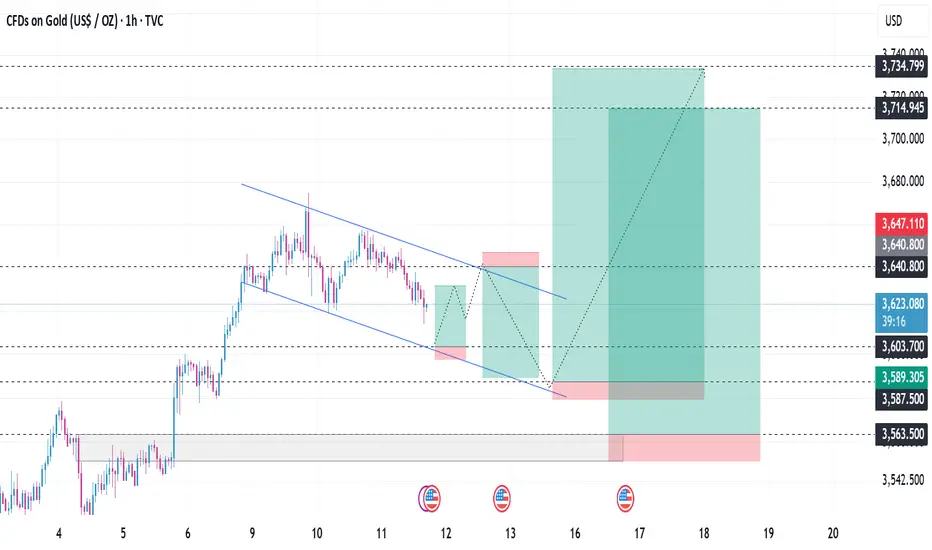
Gold update SeptemberI predict that gold is accumulating in this wedge pattern, the closest point of confluence between the down channel and FVG then increases and my short selling point is Supply frame 3 hours target to Demand frame 1 hour. Then I will collect goods there to hit the last increase of Gold. Because according to my calculation, Gold cycle often creates peaks at the end of September and the beginning of October. In case Gold breaks down falsely to sweep stop loss, I have waited for the FVG frame 1 hour
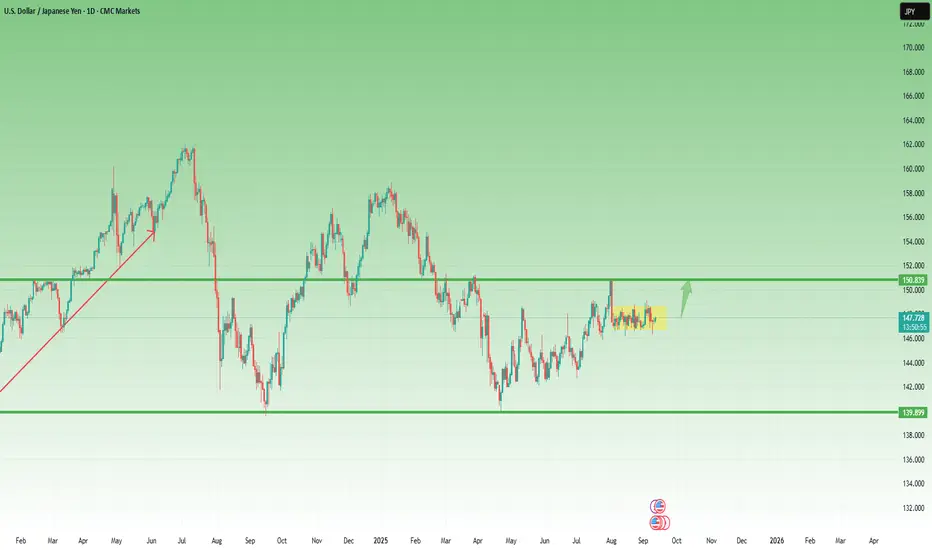
USDJPY: Tight Range, Big Breakout Coming – Bulls Eye 150.80In recent weeks, USDJPY has been one of the most frustrating pairs to trade.
Since early August, the pair has fluctuated inside a very narrow range between 146.70 and 148.50 — less than 1.5% of movement.
However, such tight consolidations rarely last. They usually precede strong moves, and in my opinion, this breakout is more likely to come to the upside.
Looking at the broader picture:
• The April low around 140 (which also tested September last year’s low) marked a strong structural support
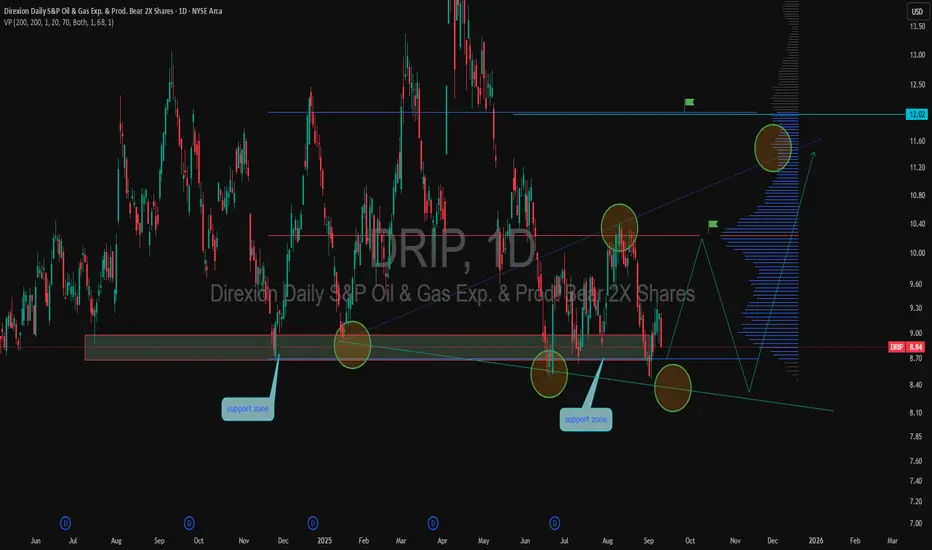
DRIP potential rebound from support zoneDRIP is consolidating near the key support area of 8.40–8.60. Over the past few months, this level has been tested multiple times, creating a strong base for a possible rebound. If local resistance around 9.50–10.00 is broken, the price may extend toward 11.20 and 12.00. However, a breakdown below support could trigger a move toward 8.00.
From a fundamental perspective, DRIP reflects the dynamics of the oil and gas sector, where pressure on producers remains high. In the current market environme
USDCHF daily chart ,the corridor paysThe USDCHF daily chart looks like a corridor battle the price continues to move between support at 0.7910 and resistance at 0.8170 and as long as these levels hold the swing trading strategy remains valid buying near support and taking profits near resistance works textbook style if resistance at 0.8170 is broken the next logical target shifts to the 0.8440 zone where significant volume is concentrated technically the structure still points to a sideways market with possible false breakouts fund
What's up with Altcoins 👀Let's look at the TOTAL3, as you can see from Fibonacci, this cycle of altcoins sold off much stronger, they did not test the 0.5 zone.
Even if we take into account the growth of stablecoins, altcoins still look oversold and I would expect an exit from the 0.23 zone.↗️
🧐Many alt-season skeptics say that #bitcoin dominance still has room to grow, here I can say that stablecoins and a larger alt-season in 2021 should be taken into account, this has not happened before. Therefore, if these facto
FETUSDT: Ascending Wedge Bottom_Ready to take another FlightFETUSDT
Monthly
Continuously moving within an Ascending Wedge.
On a monthly time frame, it is continuously forming HH, HL
Historically, 12 bars (approx. 1 year) correction is observed.
However, it takes a good flight after such correction.
Price is squeezing (and hence profit/loss too) respecting ascending wedge.
Good news! the correction bars have been completed, touching the bottom of ascending wedge.
Flight is ready to take an upside move.
Daily
Flag pattern,
current price range is
Alt season trigger level 0.2 - 0.25$(CRYPTOCAP:TOTAL3-CRYPTOCAP:USDT-CRYPTOCAP:USDC)/CRYPTOCAP:BTC
Description:
I’m closely watching the (TOTAL3 – USDT – USDC) / BTC ratio as a key signal for the next altcoin season.
📊 Expectation:
Once this ratio hits 0.25, I believe it could mark the beginning of strong capital rotation from Bitcoin into altcoins.
💡 Why it matters:
When this ratio rises, it suggests liquidity is leaving stablecoins.
Bitcoin dominance may weaken.
Altcoins tend to outperform when this setup occurs.
If the
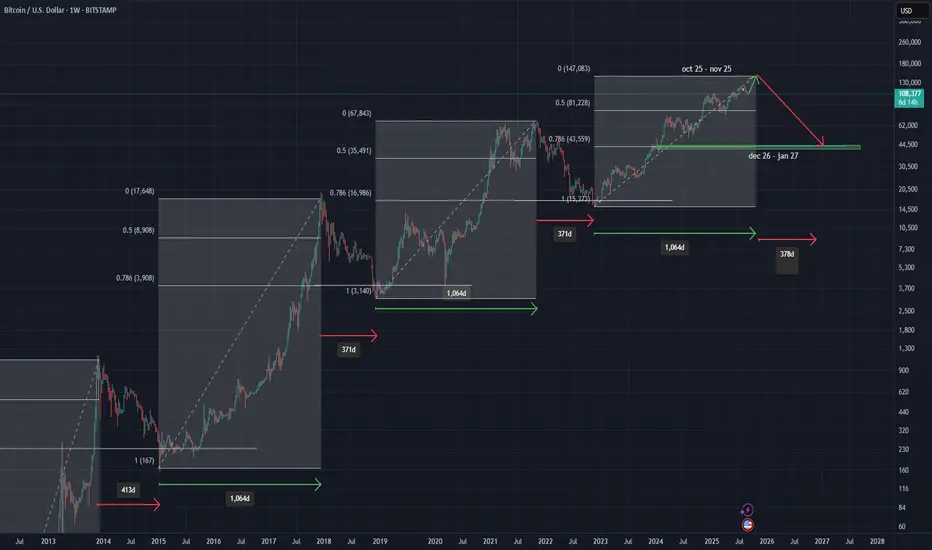
BTC Cycle Analysis: The Script Is WrittenYo, listen up. My first time posting here, so try to keep up.
I've been going down the rabbit hole with some old-school Bitcoin cycle analysis, and while everyone's still busy yelling "bullish" on Twitter, I'm just here to tell you what the charts are saying.
This stuff is like clockwork. We're talking about predictable bull runs of about 1064 days, followed by a brutal beatdown of 370-400 days. You can literally see it on the weekly chart if you bother to look. It's a pattern, not a feeling.
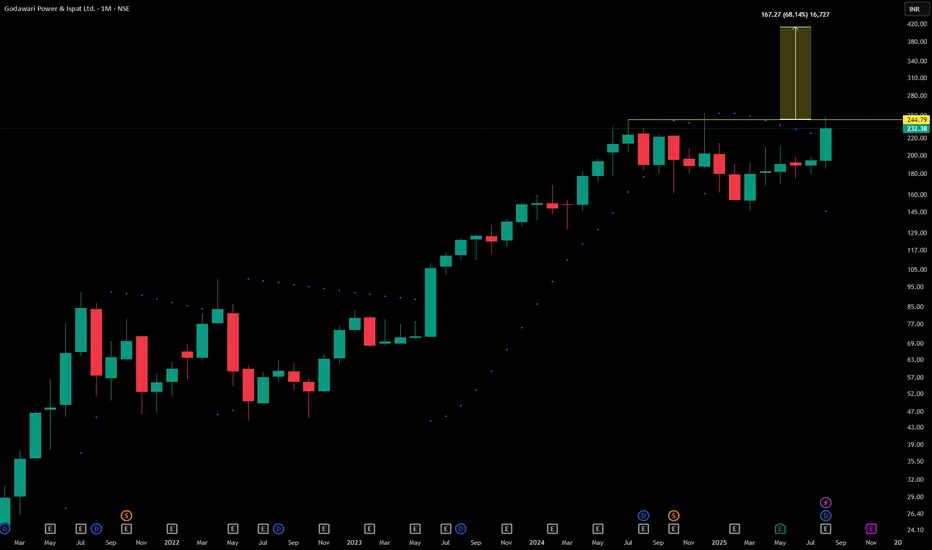
GPILGodawari Power & Ispat Ltd. (currently trading at ₹232.38) is a fully integrated steel and power producer based in Chhattisgarh, India. The company operates captive iron ore mines, sponge iron plants, steel billet and wire rod mills, ferro alloy units, and thermal power generation facilities. GPIL’s backward integration, low-cost raw material sourcing, and diversified product mix make it a strategic player in India’s infrastructure and industrial growth cycle.
GPIL – FY22–FY25 Snapshot
Sales –
$BTC 4-Year Cycle Is NOT Dead According to $QQQ $SPXIt’s really weird cause everyone keeps telling me the ₿itcoin 4-year cycle is dead yet Nasdaq and S&P 500 follow nearly the exact same pattern with cycle lows 🤓
It’s almost as-if monetary and fiscal policy creates this boom and bust cycle every 4-years 🤔
Question for the “this time is different people”….
Will NASDAQ:QQQ and SP:SPX not have similar bear markets as we’ve seen in the past along with CRYPTOCAP:BTC ?
Trend Analysis with 3 Timeframes – D/W/M Trend Analysis with Three Timeframes – D/W/M 📊
You probably looked at this price action and thought: “That doesn’t look like a good buy signal.”
Honestly, I thought the same thing.
In this video, we’re diving into trend analysis, focusing on three timeframes: Daily, Weekly, and Monthly (D/W/M) .
👉 How come only these?
Because that’s what TradingView offers on the FREE plan. And trust me—it’s enough to give you a clear mid-term picture of the market.
If you want faster returns from day t
High Beta Bear | HIBS | Long at $7.54 (Primarily September)Historically, September is one of the worst performing months in the stock market. A hedge against my bets for this month is to buy shares of Direxion Daily S&P 500 High Beta Bear 3X AMEX:HIBS as a volatility play. The index provider selects 100 securities from the S&P 500 Index that have exhibited the highest sensitivity to market movements, or “beta,” over the past 12 months based on the securities’ daily price changes.
This isn't "buy and hold" play, whatsoever - you'll lose. It's a short
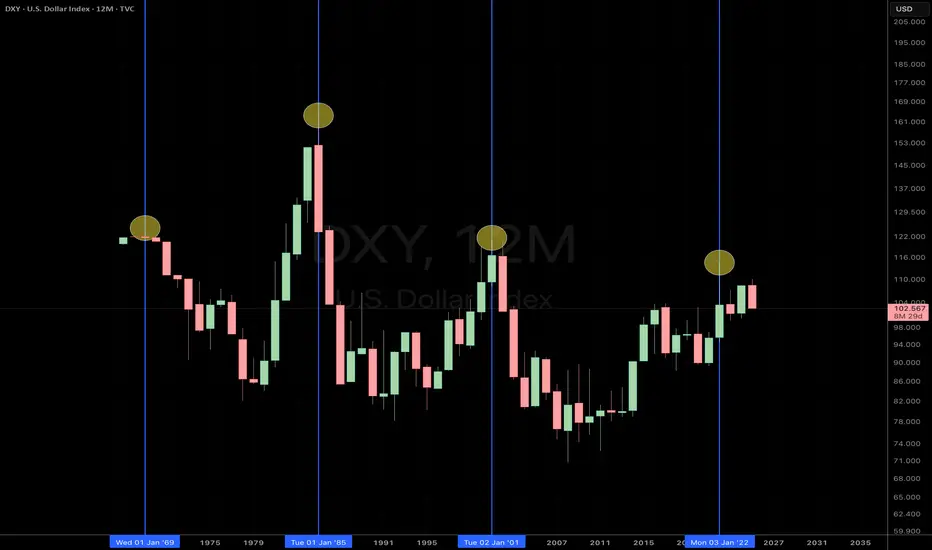
DXY | Major Cycle Peak – Is the Dollar Losing Its Grip?The U.S. Dollar Index (DXY) appears to be following a well-defined historical cycle, marking major peaks approximately every 15–20 years. If history repeats, the 2022 peak near 114 could signal the beginning of a multi-year dollar decline, impacting global markets, commodities, and currency pairs like EUR/USD.
Historical Peaks & Reversals
Examining past DXY cycles, we see:
969 Peak (~120): Followed by a prolonged decline into the 1970s.
1985 Peak (~165): Marked by the Plaza Accord, trigg
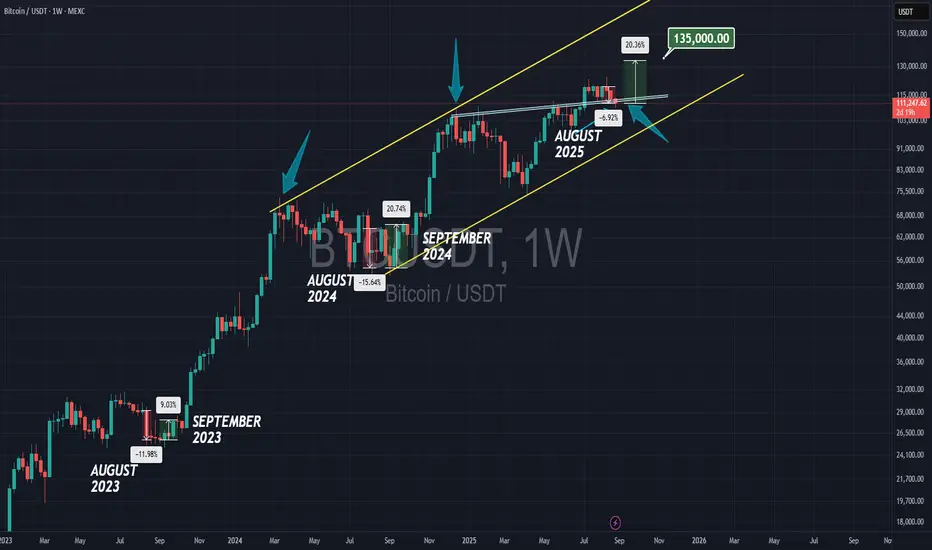
BITCOIN RISE IN SEPTEMBER??!In August 2023, Bitcoin fell about 12% and rose about 9% in September 2023. In August 2024, it fell 15% and rose 20% in September 2024. In August 2025, it dropped about 7%, but I think it could recover in September with a 20% pump, reaching $135,000, though there’s no guarantee.