Long
Long
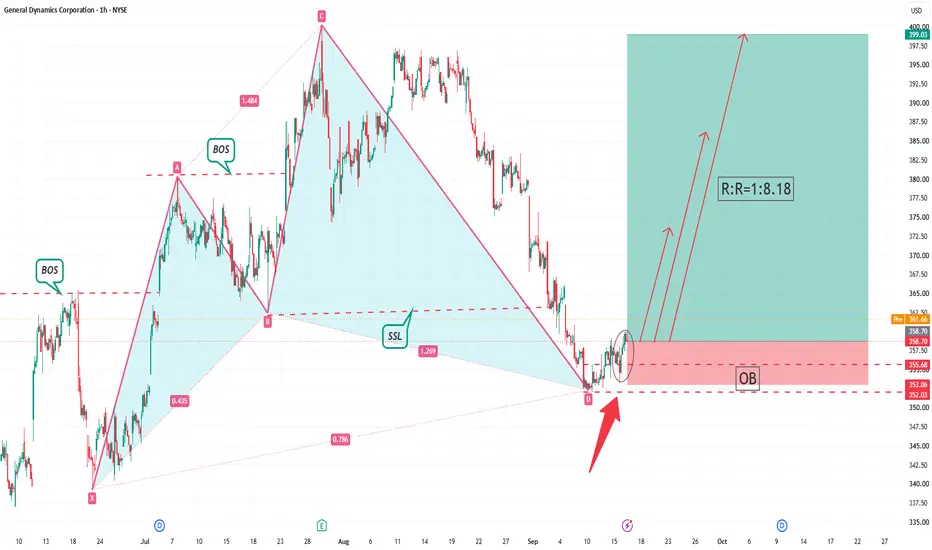
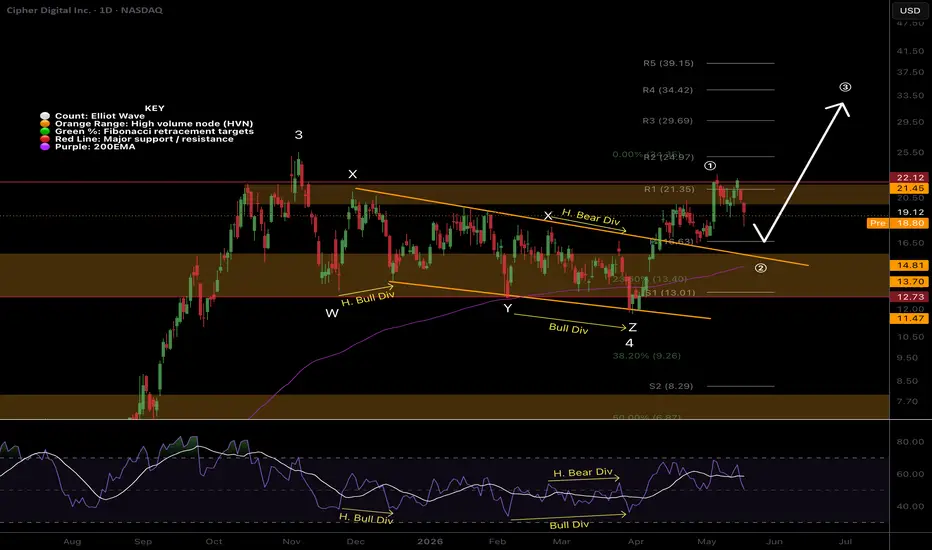
GD Official Trading PlanGD Official Trading Plan
1. Trading Instrument
Trading Instrument: GD (US Stock)
2. Analysis Timeframe
Analysis Timeframe: 1H Band Trading
3. Entry Level
Go long near the market price at 358.70
4. Stop Loss Level
Full position stop loss placed at 353.00.
Strictly execute stop loss once the price breaks the stop loss level, no holding and no subjective adjustment. This trade is configured with a fixed risk-reward ratio of 1:8.18.
5. Take Profit & Risk Protection Rules
1. First Target: 373.70
Reduce half of the position, move stop loss forward to lock floating profits and protect remaining positions.
2. Second Target: 385.70
Reduce half of the remaining positions again, continue to push up stop loss to further expand profit protection range.
3. Third Target: 400.00
Reduce half of the remaining positions, push stop loss again to fully secure trading profits.
Leave the last tail position to run with the trend and dynamically adjust protection according to real-time price movement.
6. Position Sizing
Trade with a fixed 1:8.18 risk-reward ratio for 1H band trading. Control single trade risk within a reasonable range, prohibit over-sizing and averaging down against the trend. All position calculations strictly comply with the preset high reward trading structure.
7. Trading Cycle
1H cycle band trading. Hold positions according to trend structure, close partial positions step by step at each target level, and retain tail positions to capture further trend extension opportunities.
8. Risk Transaction Reminder
US stock markets are affected by U.S. macroeconomic data, Federal Reserve policy, corporate financial reports, industry sector rotation and global capital sentiment. 1H band trading has relatively frequent signal changes and faces overnight gap risks. Extreme market volatility, pre-market and after-hours trading slippage may affect the actual execution of stop loss and take profit. This trade adopts a high 1:8.18 risk-reward strategy which requires strict trading execution discipline. Graded position reduction and trailing stop protection can effectively control trading risks but cannot eliminate all market uncertainties. All position adjustment operations must be executed strictly in accordance with the preset plan, and impulsive temporary position opening and arbitrary position modification are prohibited.
Professional Disclaimer
All financial transactions involve huge risks such as price fluctuations, liquidity imbalance and sudden market reversals. The US stock market has session-specific risks, policy uncertainties and overnight gap risks. Stock trading and leveraged trading amplify both returns and risks, and may cause partial or total loss of principal. This trading plan is only for personal strategy reference and does not constitute any investment invitation or financial advice. All opening, closing and risk control decisions are independently executed by the trader, and all profit and loss consequences shall be borne solely by the trader.
 Long
Long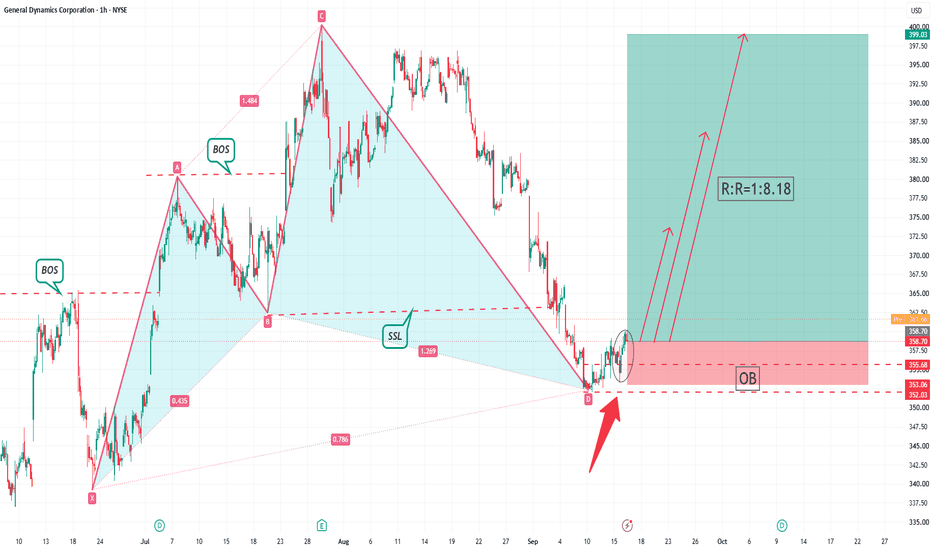
BTC/USDT Official Trading Plan BTC/USDT Official Trading Plan
1. Trading Instrument
BTC/USDT
2. Analysis Timeframe
30M Intermediate trading timeframe
3. Entry Level
Go long near the current market price at 76870.00
4. Hard Stop Loss
Fixed stop loss placed at 76700.00
No averaging down, no holding position after stop loss trigger.
5. Take Profit & Position Management Rules
TP1 Primary Target: 77800.00
Close 50% of total position, trail stop loss upward immediately to lock floating profit.
TP2 Secondary Target: 78500.00
Close 50% of remaining position, continue trailing stop loss upward for risk protection.
TP3 Advanced Target: 79400.20
Close 50% of remaining position again, adjust dynamic trailing stop loss.
Leave the final tail position running with trailing stop mechanism to capture further trend movement.
6. Professional Risk Disclaimer
All trading activities in the financial market carry significant risks of price volatility, liquidity imbalance and unexpected trend reversal. Cryptocurrency markets operate 24/7 with high uncertainty, which may cause gap movement and stop-loss slippage. Leveraged trading magnifies both returns and risks, potentially resulting in partial or total loss of principal capital. This trading plan is purely for personal strategy reference, not investment solicitation or financial advice. All entry, exit and risk control decisions are undertaken independently by the trader, who assumes full responsibility for all profit and loss consequences.
 Long
Long
 Long
Long
Pfizer’s Cypher Setup: The Yellow Trend Line Could Hold the Key Pfizer is approaching one of the most technically important areas on its long-term monthly chart.
The setup is built around a bullish Cypher harmonic pattern, with the projected completion occurring inside a major potential reversal zone around the $17.50 area. But the harmonic pattern is only part of the story.
The real significance of this chart may be the long-term yellow trend line.
## The Yellow Trend Line: A Decades-Long Technical Battlefield
The yellow trend line is not simply another line drawn across the chart. It has repeatedly demonstrated its importance by acting as both support and resistance over the years.
Price has interacted with this trend line at multiple major turning points. When price has approached it from above, the line has had the ability to provide support. When price has moved beneath or into the area from below, the same line has acted as resistance.
That transformation from support to resistance, and resistance back to support, is what makes this trend line so important.
Now Pfizer is moving toward another potential interaction with this long-term level.
If the yellow trend line once again behaves as meaningful support, it could become the catalyst for a much larger reversal.
## The Bullish Cypher Pattern
The harmonic structure shown on the chart points toward a bullish Cypher completion near the $17.50 area.
That region represents the potential reversal zone where the pattern could complete and where the risk-to-reward profile becomes particularly interesting.
The setup is therefore not simply based on Pfizer being oversold or trading at a historically depressed price. It is based on the convergence of several technical factors:
* A long-term bullish Cypher harmonic structure
* The projected completion of the pattern near $17.50
* The long-term yellow trend line
* A historically important support and resistance structure
* A defined invalidation level below the reversal zone
This convergence is what makes the $17.50 region particularly significant.
## Entry: The Potential Reversal Zone
The primary entry area shown on the chart is approximately $17.50.
This is the area where the Cypher pattern is projected to complete and where the yellow trend line becomes especially important.
Rather than viewing $17.50 as just another price level, it should be viewed as the potential battleground between the long-term bearish trend and a possible new bullish cycle.
A successful reaction from this area would strengthen the bullish harmonic thesis.
## Invalidation: $11
The chart places the invalidation level around $11.
A decisive move below this area would substantially weaken or invalidate the bullish Cypher thesis shown here.
That level is important because the entire reversal thesis depends on the projected harmonic structure holding within its completion zone. If price moves substantially beyond that structure, the pattern no longer carries the same technical significance.
## The Upside Targets
If the reversal develops as anticipated, the chart identifies several major upside objectives.
The first major target is approximately $40.
From there, the chart projects additional targets around:
**$51**
**$65**
**$85**
These targets represent progressively larger upside objectives rather than a single fixed destination.
A move from the projected $17.50 reversal area toward $40 would already represent a substantial recovery. A continuation toward $51 and $65 would indicate that the reversal had developed into a much larger trend change.
The ultimate projection on the chart reaches approximately $85.
## Why the Yellow Line Matters More Than Anything
The most important message of this chart may not actually be the Cypher pattern itself.
It is the relationship between the Cypher completion and the yellow trend line.
Harmonic patterns can identify potential reversal zones, but confirmation comes from price behavior.
That is where the yellow trend line becomes critical.
If Pfizer reaches the projected reversal area and the yellow trend line once again transforms into support, the technical picture becomes considerably more compelling.
The market would effectively be saying that this decades-long level still matters.
And if that support produces a sustained reversal, the $17.50 area could eventually be remembered as the foundation of a much larger Pfizer recovery.
## The Bigger Picture
Pfizer has spent years developing the structure shown on this monthly chart. The potential Cypher completion is therefore being presented against a much larger historical backdrop.
The setup is straightforward:
**Potential Entry:** ~$17.50
**Invalidation:** ~$11
**Target 1:** ~$40
**Target 2:** ~$51
**Target 3:** ~$65
**Target 4:** ~$85
The key question is whether Pfizer can reach the projected reversal zone and, most importantly, whether the yellow trend line once again proves that it deserves the respect it has earned over decades of price action.
If it does, this may be far more than a simple bounce.
It could mark the beginning of a major long-term reversal.
The $17.50 area is therefore the level to watch. The Cypher identifies the potential reversal. The yellow trend line provides the historical context. And price action at that intersection will ultimately determine whether this setup becomes one of Pfizer’s most significant long-term turning points.
 Long
Long
 Long
Long
CIFR Short This Week — $15.5 TargetCIFR (Cipher Digital) builds and operates industrial-scale data centers, moving from bitcoin mining into HPC hosting for large AI and compute customers.
Q2 came out on August 4 and it was a miss on both revenue and earnings, mostly because they are moving away from bitcoin mining. The buildout side looked fine though, with Black Pearl delivered early and the third data center fully funded. Analysts kept their Buy ratings but cut their targets.
From a technical point, I do not see price making any major moves, but that still does not mean we cannot take short term or swing trades. I see price consolidating between $15, the 29 September to 5 October NWOG, and $19. Even though the news from earnings was bad, that does not mean we can short blindly.
🟢 Looking to short price from $18 down to $15, treating the OTE of the monthly range as support and resistance. If I somehow miss the entry, I will look to long it once price is around $15.
🔴 If you see no proper entry, it is better to wait and see what price does than to take an entry blindly.
🔵 I am attaching my NBIS idea for this week, where I am more confident. Check it out.
⚠️ Disclaimer: This analysis reflects my personal market view and is not financial advice.
#CIFR #Cipher #Stocks #AI #DataCenters #TechnicalAnalysis #PriceAction #OTE #Earnings #TradingView #NASDAQ  Short
Short
 Short
Short
Long 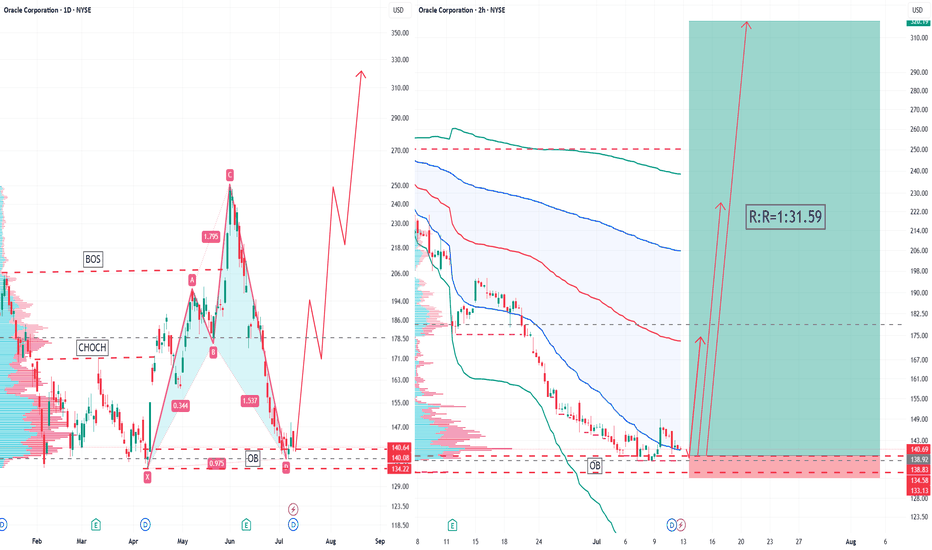
JK PAPE ON next moveWhat Is the Cypher Chart Pattern?
The Cypher is a type of harmonic pattern used by traders to identify potential buying and selling opportunities in the markets. Specifically, it’s used to help find areas where a reversal may occur.
The pattern is made up of five swing points (X, A, B, C, D) and four legs (XA, AB, BC, CD). It’s characterised by an “M” shape when bullish and a “W” shape if bearish. Traders typically place orders at D to catch the potential reversal.
Like other harmonic patterns, the Cypher requires that specific Fibonacci ratios be met before it is traded. However, the ratios used for the Cypher are relatively unique, which makes the formation one of the less common harmonic patterns.
The Cypher is also more advanced than other patterns, like the Gartley, Bat, or Butterfly, so you may need to spend some extra time learning how to recognise and trade it effectively. Once you master the skill, however, you’ll find that the Cypher can be a valuable addition to your trading arsenal.
JK paper has formed a cypher pattern, and expecting 411 and 550 levels in coming times
it also indicate start of 3rd wave of elliot  Long
Long
Long 
 Long
Long
Long 
 Short
Short
 Long
Long
 Long
Long
 Long
Long
 Short
Short
 Long
Long