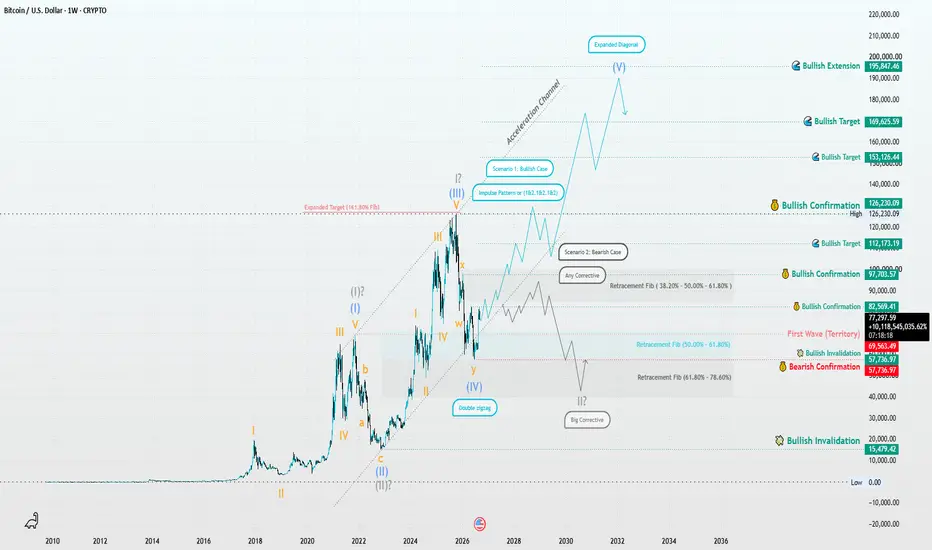
Bitcoin Weekly | Two Macro Paths⏱️ Reading Time: ~3 minutes
Hey everyone,
This weekly analysis takes a long-term look at Bitcoin’s structure. At this stage, I think it’s better to keep more than one interpretation open and let the market reveal more of its internal structure before choosing one count with confidence.
🟦 Scenario 1 | Leading Expanding Diagonal
One possible long-term interpretation is that Bitcoin’s entire macro structure could eventually be viewed as a Leading Expanding Diagonal on the linear chart.
If this
Leading Diagonal
Gold Rebounds From PRZ — Can Bulls Reclaim $4,400?Gold ( OANDA:XAUUSD ) reacted well to the Potential Reversal Zone(PRZ) and has started to move higher.
However, gold remains below the 200_SMA(Daily), which is not a positive sign for the broader bullish trend and keeps the risk of a deeper correction alive.
Can gold reclaim $4,390 and extend its recovery, or is the current bounce only temporary?
Technical Analysis
From an Elliott Wave perspective, gold appears to be completing its fifth bearish wave, suggesting that the current downward seq
Trading Roadmap | Wave Analysis · Lesson 10 — DiagonalsLesson 10 - Leading and Ending Diagonals
Difficulty: (Advanced)
There is one structure in the whole framework that is allowed to break a rule you have been treating as absolute since Lesson 4. It looks like a wedge, it overlaps where an impulse never should, and it shows up in exactly two places in a sequence. Reading it correctly is often the difference between calling a trend early and calling a top late.
Five legs squeezed between two converging lines, each push covering less gro
NZDUSD Near a Major PRZ: Is a Bearish Reversal Starting?NZDUSD ( FX:NZDUSD ) is currently trading near the Resistance Zone, the Potential Reversal Zone(PRZ), and the Resistance Lines.
Multiple technical signals are now converging around the same area, increasing the importance of the current resistance structure.
Can NZDUSD break above this zone, or is a bearish reversal about to begin?
Technical Analysis
From an Elliott Wave perspective, NZDUSD appears to be completing Wave 5 of a Leading Diagonal.
A Negative Regular Divergence(RD-) is also vis
AAPL 4H — Nested Structure or Final Diagonal?🍎 AAPL 4H — Nested Structure or Final Diagonal?
In this update, the main focus is on the current price structure and what the market needs to show to confirm the wave count.
The aggressive scenario is currently focused on a nested structure across two degrees:
1-2 / 1-2
In this interpretation, the current decline could be a three-wave corrective structure. If this decline completes in three waves and price then begins to advance again, that behavior could provide important confirmation of th
NASDAQ: The Wave Structure Is TalkingOn the larger degree, NASDAQ is still developing within a large impulsive structure, and what matters most right now is the Third Wave still unfolding. It has not yet reached a point where we can reasonably declare it complete simply based on wave proportions.
The daily chart tells a similar story on a lower degree. After Wave II, the market has continued developing impulsive structures, and more recently we can see several nested 1–2 structures. If this count remains valid, these nested struct
DXY | The Diagonal Test DXY | The Diagonal Test 🌀
In this update, our focus remains on the Aggressive Scenario—a higher-degree interpretation in which the recent structure may represent either Wave (C) or Wave (III).
A closer examination of the 4-hour chart suggests that the current structure could initially be interpreted as a Double Zigzag. However, the ongoing price development also raises the possibility that the market is building a Leading Diagonal.
At this stage, the more compelling structural interpretation
Gold | Tracking Wave IV Before the Next Major MoveGold | Tracking Wave IV Before the Next Major Move
XAUUSD | 4H Elliott Wave Update
Based on the Elliott Wave Principle, two primary structural scenarios currently best fit the market. These represent our current interpretation of price behavior and will be reviewed as new structural evidence emerges.
In the aggressive scenario, Wave A is considered complete as a Leading Diagonal. The Base Channel has been drawn solely to evaluate the first impulsive advance of Wave B. If this structure remains
PUMP Surges 20% — Is Another 5% Rally Still Ahead?PUMP ( BINANCE:PUMPUSDT ) has surged nearly 20% over the past 24 hours, supported by both fundamental catalysts and a major technical breakout.
Can PUMP extend its rally, or is a temporary pullback approaching?
Key Catalysts
• BOOST Buybacks: Continuous buybacks helped absorb part of the selling pressure following the recent token unlock.
• Spot-Led Demand: Open Interest declined while price moved higher, suggesting that the rally was driven mainly by spot buying rather than excessive leve
Litecoin (LTCUSD) Shows Signs of a Potential Bottom FormationLitecoin has reached new lows near the 40 area within a five-wave bearish impulse, where we are now seeing some stabilization, which can be a signal for the bottom formation.
The recent recovery attempt from the lows is starting to show some constructive signs, as Litecoin may be developing a leading diagonal structure to the upside. This type of formation can often appear at the beginning of a larger reversal and may provide the first indication that sellers are losing control.
However, after
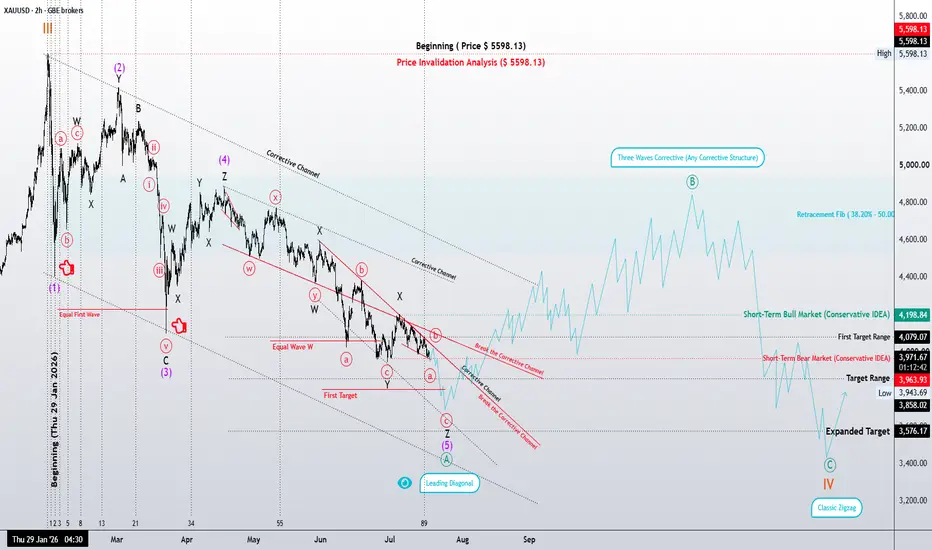
Gold | One More Wave or the Beginning of a Bullish Reversal?XAUUSD | 4H Elliott Wave Update
According to the higher-degree wave count, Wave IV is still expected to be in progress. From an Elliott Wave perspective, the current structure may be developing a Leading Diagonal as the final part of Wave A. However, additional price action is still required before the pattern can be considered complete.
In the aggressive scenario, if Waves 1, 3, and 5 of the diagonal are all impulsive, the internal structure should follow the 5-3-5-3-5 formula. Although price
Gold | One More Wave… or Has Wave B Already Begun?XAUUSD | 2H Elliott Wave Update
According to the higher-degree Weekly and Daily wave counts, Gold continues to develop Wave IV. This analysis is based on the Elliott Wave Principle, following both its core rules and structural guidelines while focusing on market structure rather than price prediction.
The primary focus of this update is a Leading Diagonal, currently identified as part of Wave A. Price has now reached a region where this structure may be complete. However, until the market prov
4H Roadmap: The Structure That Will Decide the Weekly Scenario# **DXY | 4H Roadmap: The Structure That Will Decide the Weekly Scenario 🌀**
Greetings, fellow wave practitioners.
In the previous weekly analysis, I presented two valid long-term scenarios for the U.S. Dollar Index (DXY): an **Aggressive Scenario** and a **Conservative Scenario**. The purpose of this 4-hour update is to determine which of those higher-degree paths the market is currently constructing.
From the most recent major high, the initial decline is unfolding as a **three-wave structu
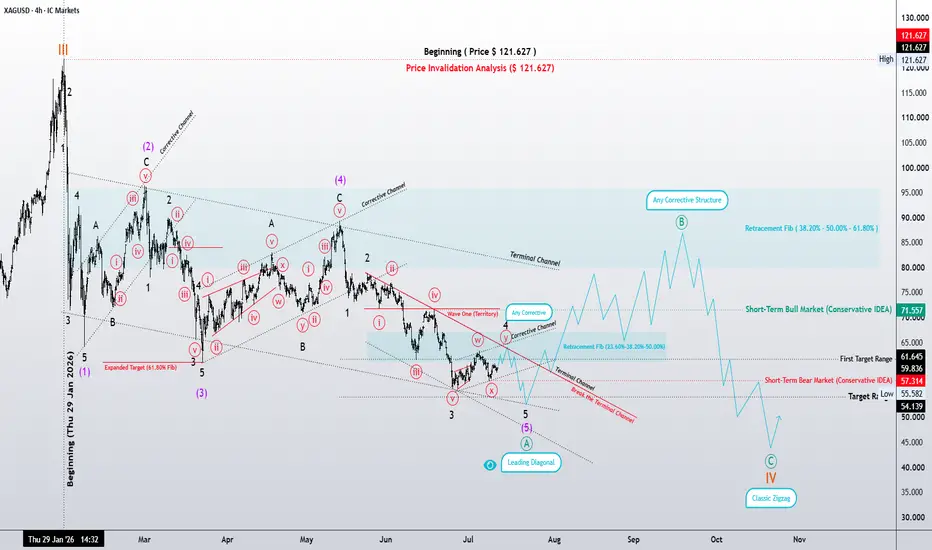
Leading Diagonal Suggests a Corrective Rally Before Completing XAGUSD (Silver) | Leading Diagonal Suggests a Corrective Rally Before Completing Higher-Degree Wave IV
"Price is the outcome. Structure is the cause."
After examining the weekly, daily, and now the 4-hour chart, the aggressive scenario continues to align with the rules and guidelines of the Elliott Wave Principle.
In this interpretation, the recent decline is counted as a Leading Diagonal following the 5-3-5-3-5 structural sequence. So far, the internal subdivisions remain consistent with the
Gold | One More Wave… or Has Wave B Already Begun?XAUUSD – 4H Elliott Wave Analysis
According to the higher-degree Weekly and Daily wave counts, Gold appears to be developing Wave IV. This analysis is built upon the Elliott Wave Principle, adhering to its core rules and structural guidelines rather than relying on price prediction.
The first component of this structure is a Leading Diagonal, which may have already reached completion. If confirmed, the market could initiate a short-term bullish move, representing Wave B within the larger corre
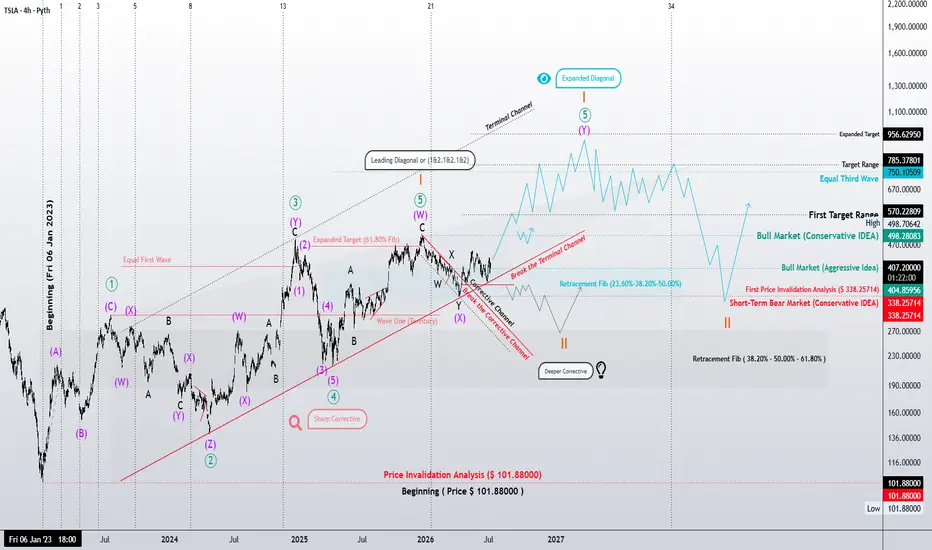
TSLA 4H: Extended Leading Diagonal or a Deeper Correction?
"Price is the consequence. Structure is the cause."
This four-hour structural analysis of Tesla (TSLA) examines the market through the principles of Elliott Wave Theory. Rather than forecasting price alone, the objective is to determine the market's current position within the larger wave structure and identify the most probable path forward.
Primary Thesis — Extended Leading Diagonal
The preferred interpretation views the current structure as a Leading Diagonal exhibiting structural extensi
TLong
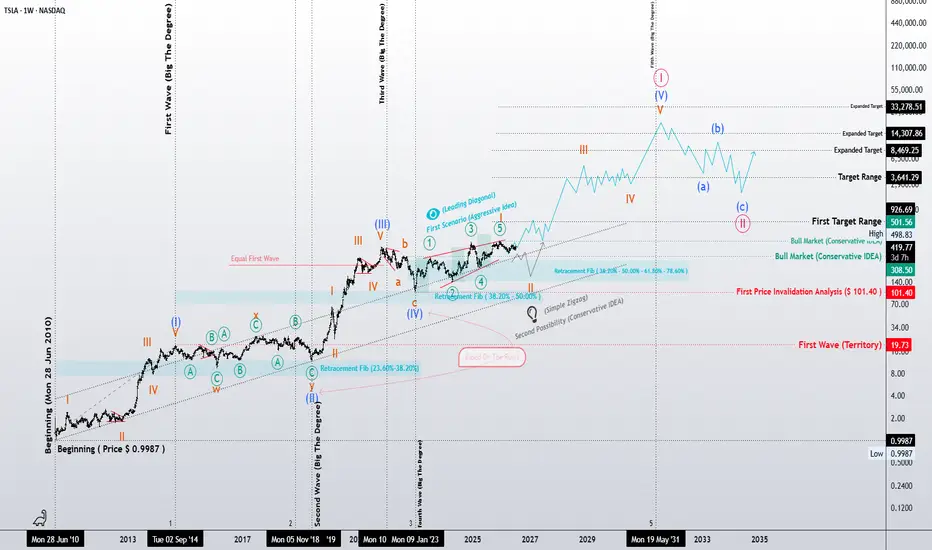
TSLA: A Structural Blueprint of the Grand Cycle
"Price is the consequence. Structure is the cause."
This analysis is not a simple price forecast. Rather, it is a structural study of Tesla's position within its Grand Cycle through the principles and guidelines of Elliott Wave Theory.
Since its 2010 low, Tesla has developed a sequence of impulsive and corrective waves, each forming part of a much larger market geometry. The objective of this study is to identify the market's current position within that hierarchy and explore the most probabl
Is the Leading Diagonal Completing Wave A Before the Next RallySilver Elliott Wave Analysis (XAGUSD) | Is Wave A Near Completion Before a Classic Zigzag Correction?
Financial markets reward discipline—not certainty.
Every price movement reflects collective market psychology, and the Elliott Wave Principle provides a structured framework for studying that behavior through objective market structure.
This analysis is based on Elliott Wave rules, guidelines, Fibonacci relationships, channel analysis, and price action—not prediction.
Ultimately, the market
Is the Leading Diagonal Signaling the Beginning of Wave IV?Gold Elliott Wave Analysis (XAUUSD) | Is the Leading Diagonal Signaling the Beginning of Wave IV?
Financial markets reward discipline—not certainty.
Every price movement reflects collective market psychology, and Elliott Wave Principle provides a structured framework for studying that behavior. My objective is not to predict the future, but to evaluate market structure through Elliott Wave rules, guidelines, Fibonacci relationships, channel analysis, and price action.
The market will ultimate
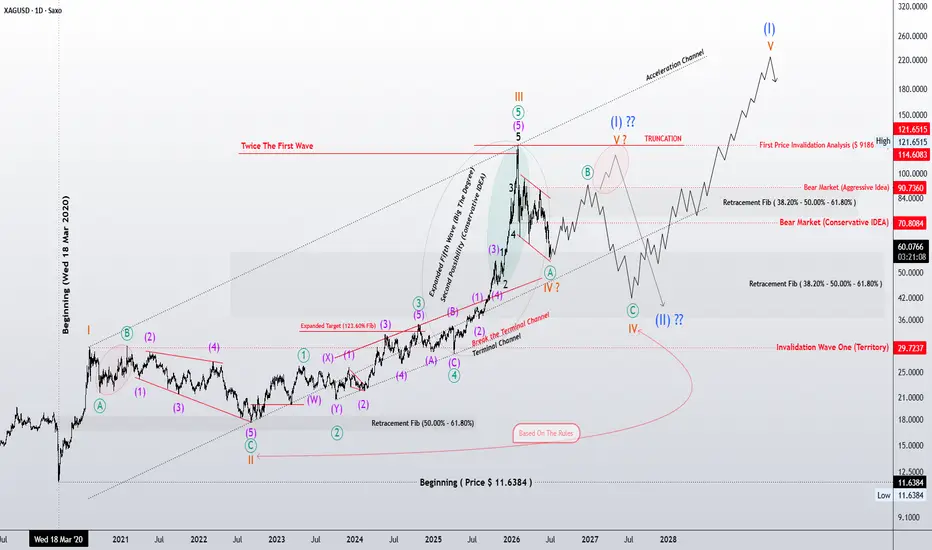
Is Wave IV Building the Foundation for the Final Fifth Wave?Silver (XAGUSD) | Is Wave IV Building the Foundation for the Final Fifth Wave?
Financial markets are not random.
Every price movement reflects the collective decisions of millions of market participants, and over time those decisions tend to organize themselves into recognizable structures. Elliott Wave Principle is not simply a forecasting tool—it is a framework for studying collective market behavior through objective price structure.
This publication is shared from that perspective.
Its p
Gold Elliott Wave Analysis (GC1!) | Has the Impulse Cycle Ended?Financial markets are rarely random.
Behind every candlestick lies the collective psychology of millions of market participants, and over time, that psychology tends to organize itself into recognizable structures. Elliott Wave Principle is not simply a forecasting tool—it is a framework for studying collective market behavior through objective price structure.
This analysis is shared in that spirit.
It is not a prediction. It is an ongoing research study based on Elliott Wave rules, guidelin
$XAUUSD | Structure Research 3.3.3.3.3 or 5.3.5.3.5 Bar Chart
The market is whispering something...
But is everyone hearing the same message?
At first glance, the current formation can be interpreted as a Leading Diagonal — a pattern often seen near the beginning of a new trend.
However, there is another possibility worth considering.
What if this entire structure is actually a complex Triple Zigzag disguising itself as a diagonal?
From an Elliott Wave perspective, both interpretations remain valid.
Wave 3 is not the shortest wave, overlap is presen
XAUUSD: Leading Diagonal Completed – Wave B Rebound AheadXAUUSD — 4H (Leading Diagonal Update)
According to The Wave Principle, the recent bearish sequence has concluded as a textbook Leading Diagonal within Wave (A). The internal geometry is highly consistent: Wave 5 reached the 61.8% Fibonacci projection of Wave 3, and Wave 3 remained longer than Wave 1, validating the structural integrity of the diagonal.
The market is now expected to transition into a three-wave corrective rebound for Wave (B) to retracing the preceding diagonal.
Primary Scenar