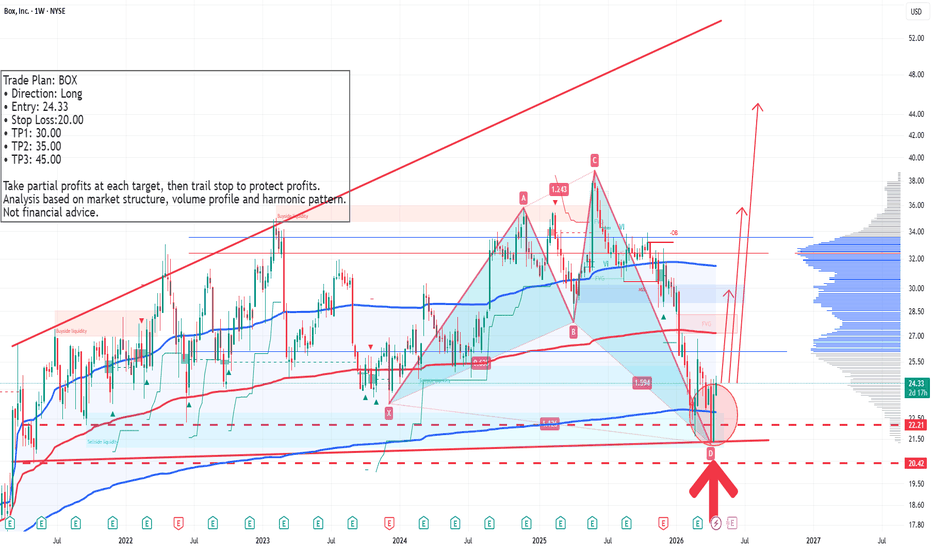
Trading Plan for MDTTrading Plan for MDT
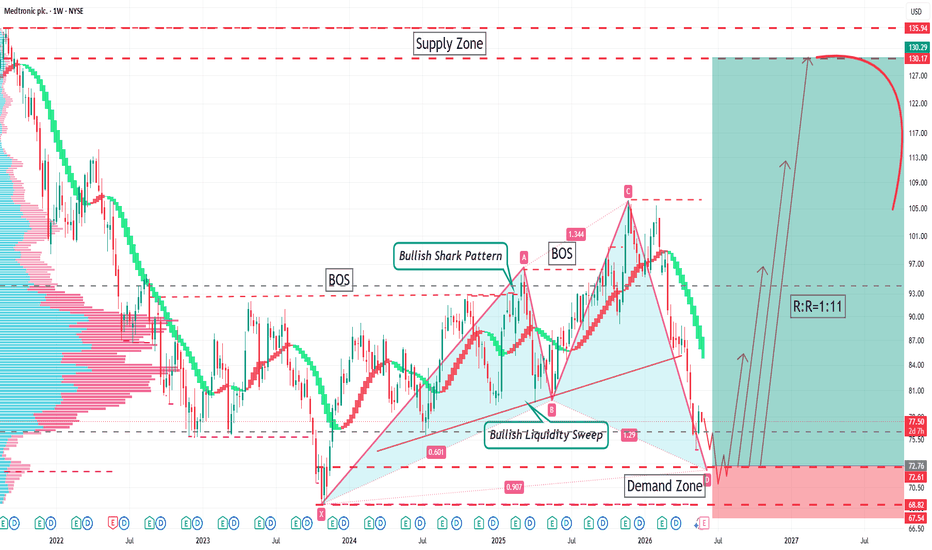
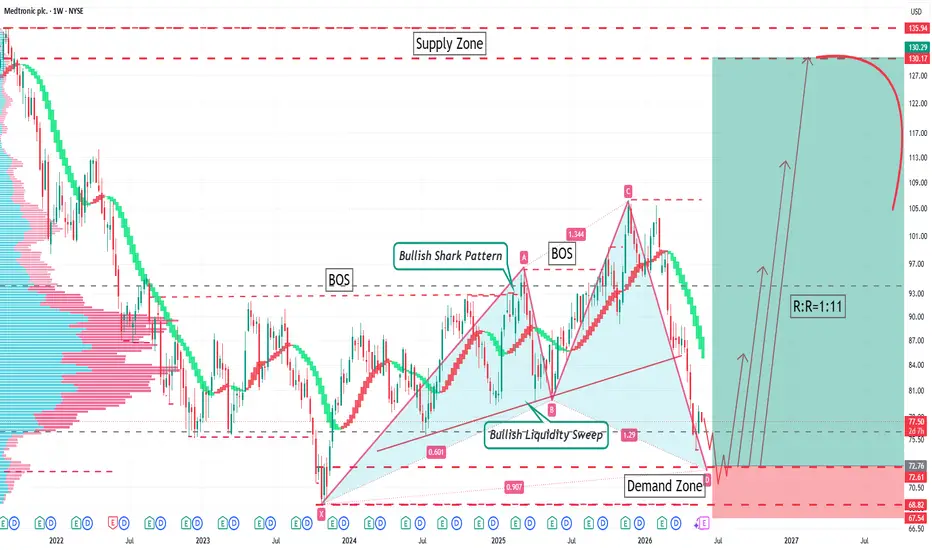
Asset: US Stock MDT
Timeframe: Weekly Chart
Current Price: $77.50
Wait for pullback on lower timeframes to go long.
Entry: $72.80
Stop Loss: $67.50
Profit Targets & Management
1. TP1: $85.50. Reduce half position and adjust stop loss to lock profits.
2. TP2: $96.60. Reduce half of the remaining position and trail stop loss.
3. TP3: $112.50. Reduce half of the remaining position and trail stop loss.
4. TP4: $130.30. Reduce half of the remaining position, trail stop loss and keep the last position.
US Stock Trading Risk Disclaimer
Trading US stocks involves high risks. Market volatility, price gaps and slippage may occur at any time. Corporate news, regulatory changes and industry policies can lead to sharp price swings. This document is for reference only, not investment advice. All trading activities and losses shall be borne by the trader. Please manage risks properly.
Shark
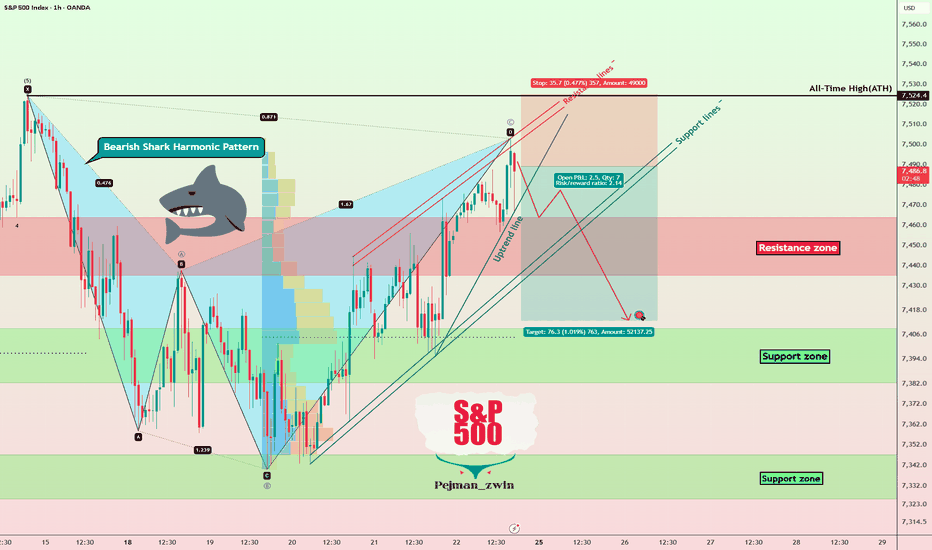
S&P 500 Near ATH Again — But This Breakout May Be FakeThe S&P 500 index ( SP:SPX ) these days is moving heavily based on geopolitical news, especially surrounding whether Iran and the U.S. can finally reach an agreement. Initial signs and headlines related to a possible agreement have supported the bullish movement of the S&P 500, while any negative developments or tensions have pressured the index lower. Right now, investors are highly focused on whether military tensions in the Middle East will continue or whether we are approaching the end of the conflict.
At the moment, the S&P 500 seems unable to properly break the resistance zone($7,464-$$7,435) after multiple attempts. There is also a possibility that the recent breakout was a fake breakout (fake break). Although the index is still trading near its previous all-time highs (ATH), it appears there is a chance that the S&P 500 may fail to create a new ATH.
From a Harmonic Pattern perspective, the S&P 500 index seems to be forming a Bearish Shark Harmonic Pattern.
From an Elliott Wave Theory perspective, it appears the S&P 500 has formed an Expanding Flat(ABC/3-3-5), which could lead to another bearish move for the index.
I expect the S&P 500 index, after breaking the Uptrend line and returning back below the resistance zone($7,464-$$7,435), to decline at least toward the $7,413. If bearish momentum increases, we could expect even deeper correction levels.
First Target: $7,413
Second Target: $7,361
Stop Loss(SL): $7,525
Note: Since the stop-loss level is relatively close to the entry point, the risk-to-reward ratio of this trade setup appears attractive. However, proper risk and capital management remains essential.
What’s your view on the S&P 500? Can the index create a new all-time high, or should we expect a deeper correction?
💡 Please respect each other's opinions and express agreement or disagreement politely.
📌 S&P 500 Index Analyze (SPX500USD), 4-hour time frame.
🛑 Always set a Stop Loss(SL) for every position you open.
✅ This is just my idea; I’d love to see your thoughts too!
🔥 If you find it helpful, please BOOST this post and share it with your friends.
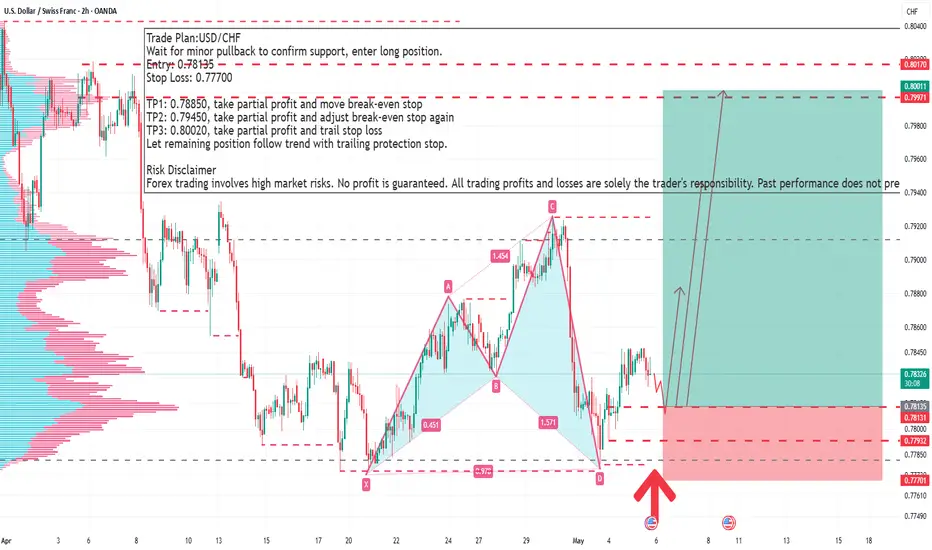
Trade Plan:USD/CHFTrading Plan:USD/CHF
Wait for minor pullback to confirm support, enter long position.
Entry: 0.78135
Stop Loss: 0.77700
TP1: 0.78850, take partial profit and move break-even stop
TP2: 0.79450, take partial profit and adjust break-even stop again
TP3: 0.80020, take partial profit and trail stop loss
Let remaining position follow trend with trailing protection stop.
Risk Disclaimer
Forex trading involves high market risks. No profit is guaranteed. All trading profits and losses are solely the trader's responsibility. Past performance does not predict future results.
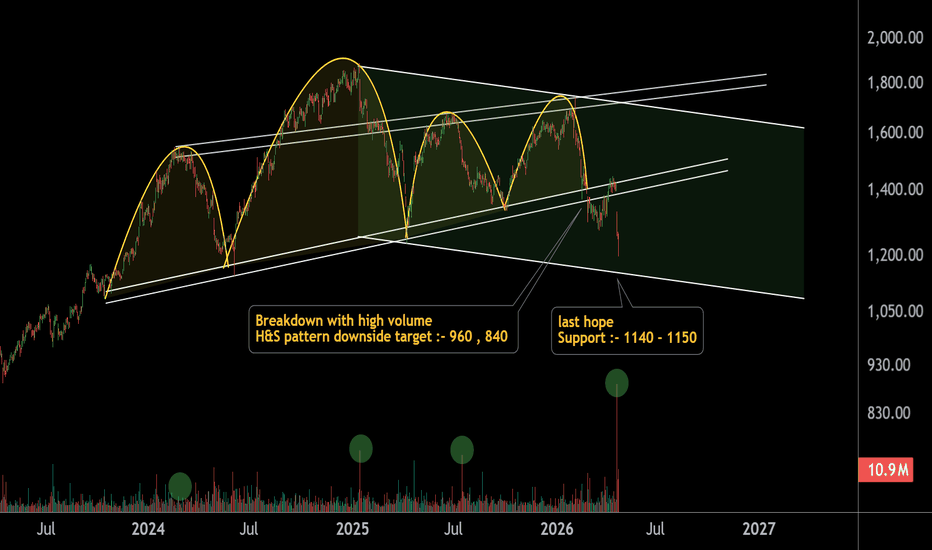
HCL Technologies Ltd – Technical Breakdown Alert The chart reflects a mature topping formation in the form of a Head & Shoulders pattern, developed after an extended uptrend—indicating a probable trend reversal phase.
A decisive neckline breakdown, supported by expansion in volume, confirms distribution at higher levels. Price has now slipped below the intermediate trendline, signaling weakening momentum and loss of bullish structure.
From a structural standpoint:
The right shoulder rejection near resistance confluence adds conviction to the bearish setup
Price is now trading within a falling channel, respecting lower highs and lower lows
Projection:
Measured move from the H&S pattern suggests a downside trajectory towards 960 – 840 levels
Critical Demand Zone:
The 1140 – 1150 zone acts as the last structural support. A sustained breakdown below this region could trigger accelerated downside momentum.
Thoughts on CADJPYGood afternoon, everybody,
The thoughts I have about the market in CADJPY is still bullish but there is a potential reversal zone between 117.963 and 118.20 for a bearish position. From previous days and in for 4H charts the market has been in bullish trend and based on geometric patterns, it is expectable to finish the impulse up to 117.300 approximately. This doesn't mean it should start go bearish, but it's the completion of the rectangle pattern after giving an entry point and the same amount of pips.
Being said this, a bearish possibility is at PRZ 117.963 and 118.20 for bearish position (not yet happening, we are still pips away). The pattern shown is a shark pattern for its double entry at 1.28 fibonacci approximation. We will just have to wait and wait for candle confirmation in the PRZ.
As for now, a bullish position entry could happen after bouncing at 116.800 price but we will need a pulse, retracement, bounce and candle confirmation at that price and SL can be 116.500 with TP at 117.300. It is all waiting until the market tell us what to do based on the candle confirmation.
Chart snap link:
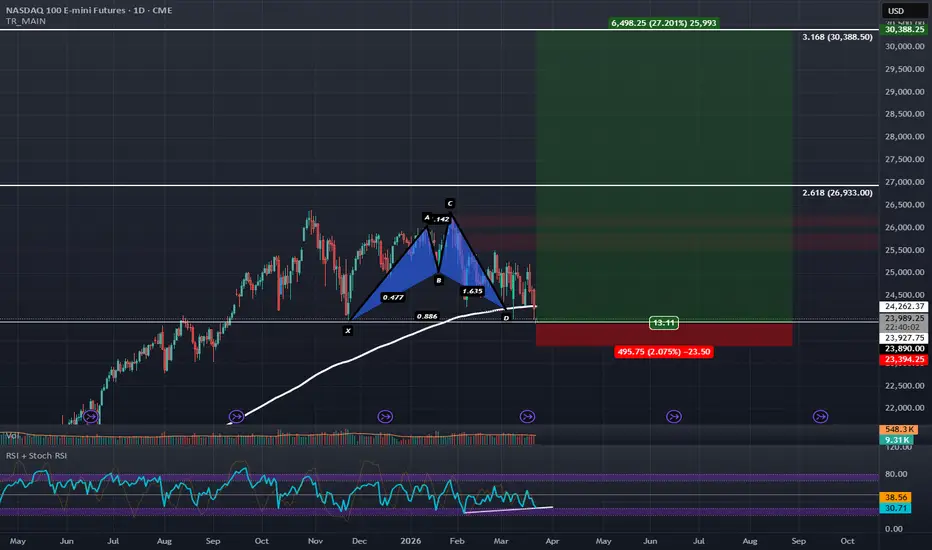
Nasdaq Futures is Holding Support for the Third TimeNasdaq Futures has been trading around the 200-day EMA and .886 PCZ of a Bullish Shark for awhile now kind of in line with what the S&P-500 Futures have been doing.
This level aligns with the August 2025 High and it seems to be diverging bullishly on the RSI here. Things should get more confident if we can trade back above the 200- day EMA just above the current price as we gap-down into support for the third time.
I think equities are likely to rally as Crude Oil futures come down significantly below the $100 mark and potentially as low as the $60s as I specified in a my previous ideas involving USOIL. I will be adding long NQ futures here but even more so getting more long term OTM calls on QQQ around the $625 strike once the options markets open.
Syengene Forming Shark pattern (Bearish Mode)Syengene has formed bearish Shark pattern on weekly time frame
776 is an important support at 0.5 Fib. Immediate target at 776.
If it closes below 776 on week candle, then rest target to follow and could go down more till 400.
Target1 - 776
Target2 & 3 - 736 / 680
Target4 & 5 - 515 / 400
SShort
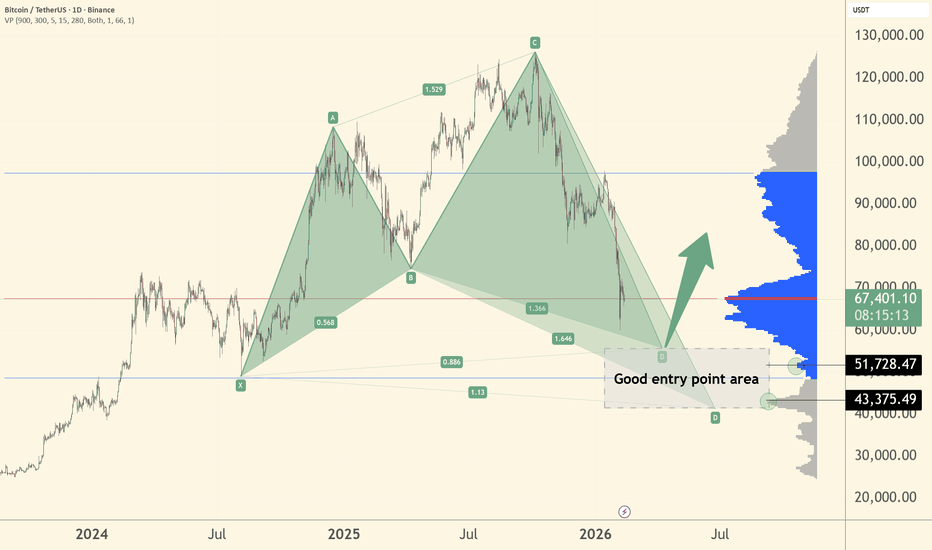
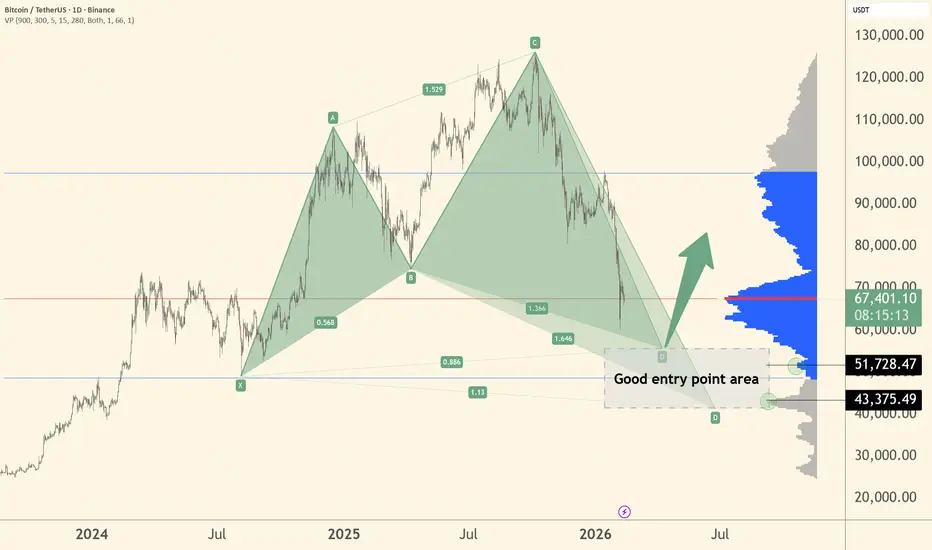
BTC bullish shark pattern ending soon. T1: 51800, T2: 43400This is a BTC daily chart showing a Shark harmonic pattern forming.
Price moved in a large 5-point structure labeled X → A → B → C → D.
We are now approaching point D, which is the potential reversal zone . That zone is defined between the 0,886 and 1,13 Fib ratios.
The highlighted grey box (around $43k–$52k) is marked as a “good entry point area”.
This is where the pattern suggests BTC could find support and potentially reverse upward.
On the right side, the blue/grey volume profile shows strong historical trading activity in this zone — which adds confluence. My targets would be at aprox. 51800 and 43400.
TL;DR:
BTC is correcting into a strong support + harmonic completion zone, where a bounce could happen.
A Triangle Appears In Bloody WatersOANDA:EURGBP seems to have found itself Consolidated into a Rising Triangle with Higher Lows into Equal Highs.
Last time price was at these levels a Harmonic pattern, the Bullish Shark, formed and we seen price make quite a rise!
Now triangle patterns are statistically known to fail 1/3 of the time but with price forming a Rising Triangle, we must assume that price could very well be looking to head back up from such an area of Support.
If price is able to Close above the Resistance of the pattern, this could generate Long Opportunities!
Fundamentally, EUR will be dealing with CPI and GDP news events tomorrow (Friday) ranging from Midnight - 4 AM. GBP will have M4 Money Supply, Mortgage Approvals and Lending releasing @ 3:30 AM.
Be Vigilant!
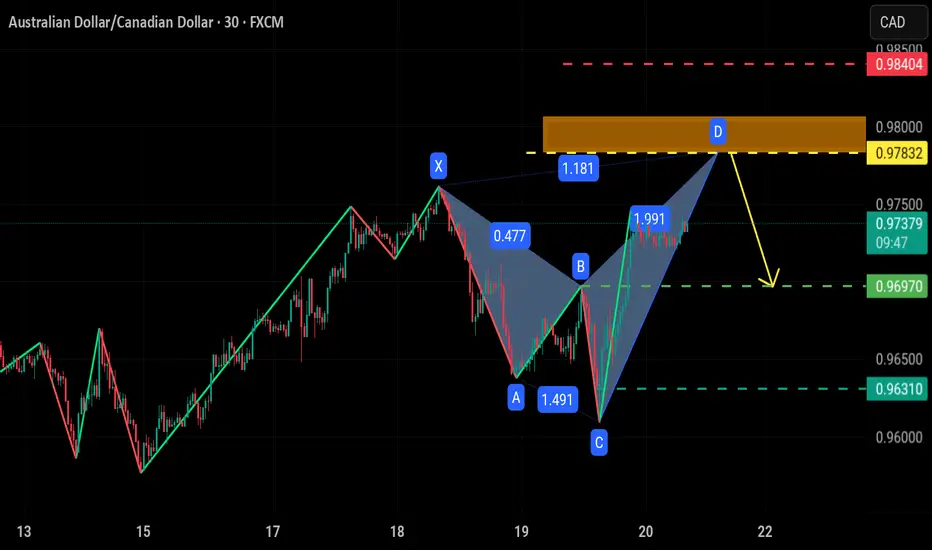
GBPUSDThe expected price movement is the completion of the Shark pattern within the harmonic pattern. The expectation is that its course will be downward in the next phase, and God knows best. A break of the upward trend line reinforces selling levels in the next phase. The Shark pattern continues to form, which is a bullish pattern. Remember, this is a prediction, not a recommendation.
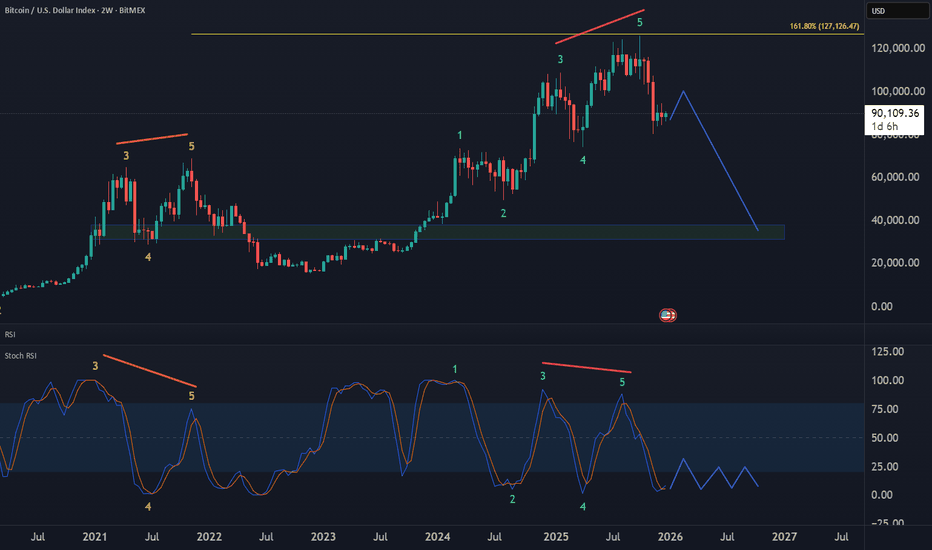
Bitcoin Bear Market Outlook🔴 Over the next 10 months, INDEX:BTCUSD is expected to correct the entire rally from the 2022 low, with downside potential toward the 37K – 30K zone to retest the previous base.
🔵 The structure of the decline remains uncertain, it could unfold as a sharp aggressive drop or a slow bleeding move.
#ElliottWave #Crypto #Trading
JPY SharkAs we expected in the previous idea, the dollar index strengthened, and accordingly, the dollar-yen currency pair will likely jump above the Fibonacci golden level (the pink area) to around 113.8 and then probably take a deep dive.
U
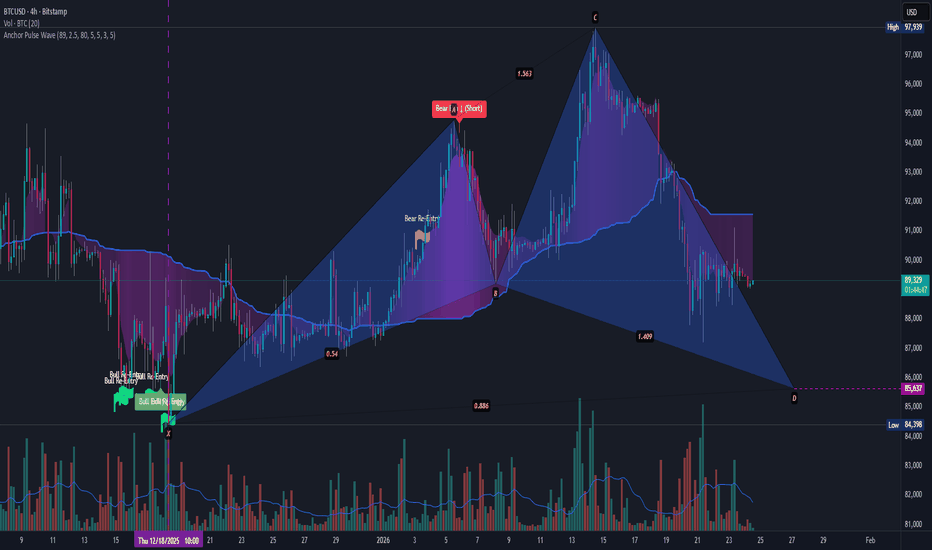
Potential BTCUSD RUsh to $155KPrice action has reached our anticipated support level of $89,000, a critical threshold we identified in our previous analysis.
Based on current technical structure, we are positioning for a potential rally toward $155,000 in the next 24weeks.
However, over the coming weeks, with our target window extending through January 26th.
Forward Outlook:
The manner in which price navigates to this level will be instrumental in shaping our 2025 outlook. We are monitoring two primary scenarios:
Bullish Case: A sustained move higher could establish new targets at $145,000
Bearish Case: Failure to maintain momentum may result in a retracement toward the $78,000-$65,000 range
We are intentionally keeping technical details concise to maintain clarity for our portfolio holders.
Further updates will be provided as market conditions develop.
Disciplined patience remains our guiding principle.
Ieios Capital