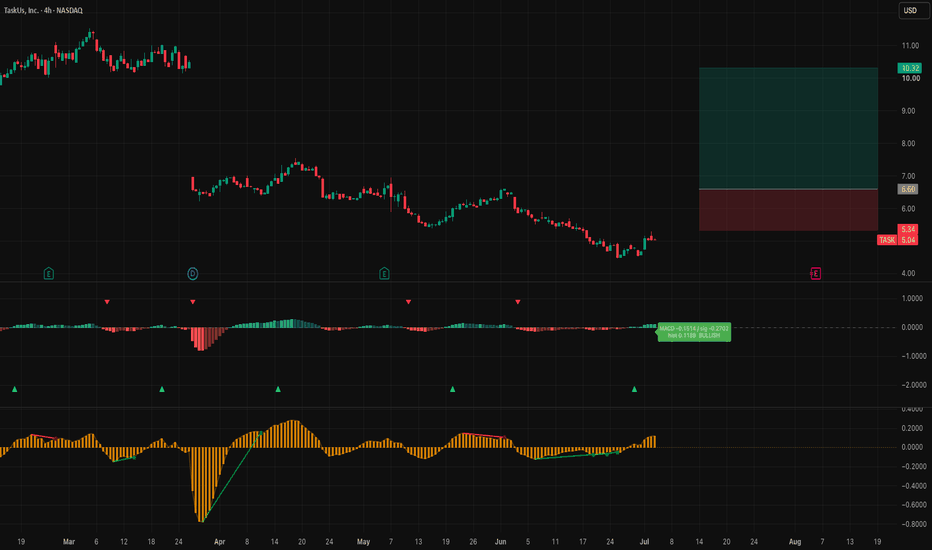
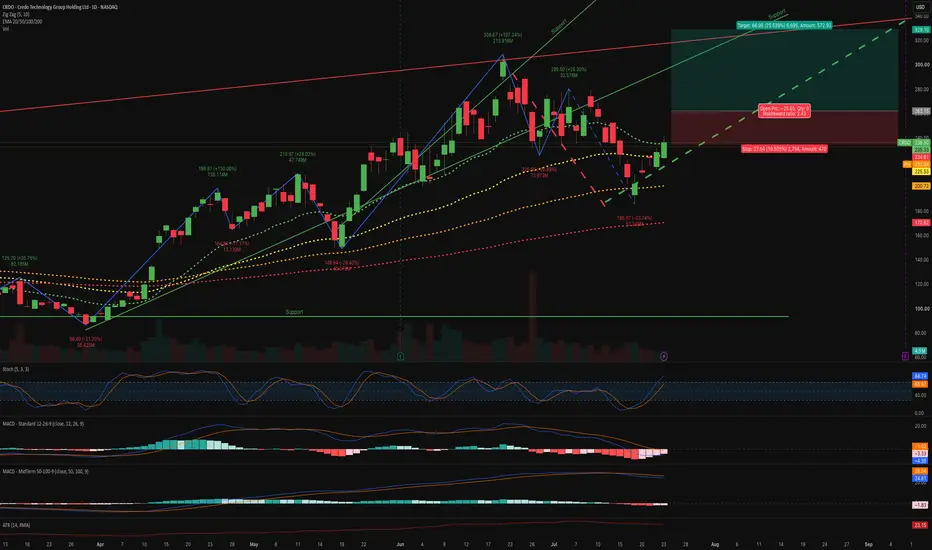
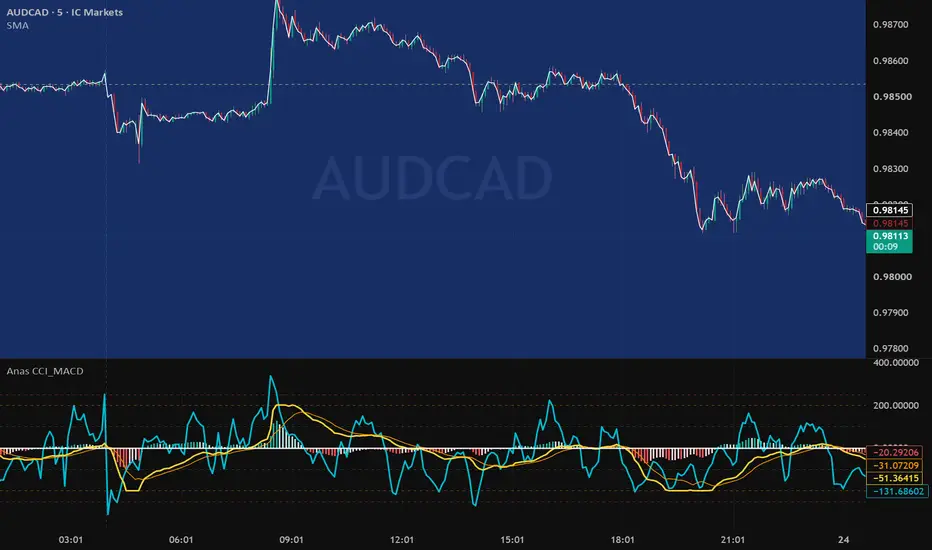
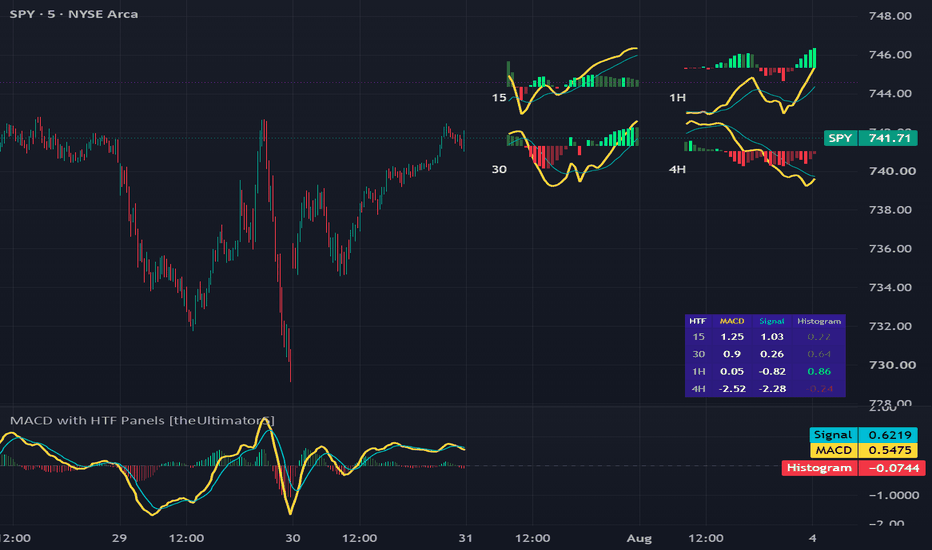
MACD with HTF Panels [theUltimator5]This indicator uses the standard MACD signal and displays it on multiple timeframes off to the side of the chart as separate panels. It allows you to view up to 5 (current + 4) separate timeframes at once without changing the chart timeframe.
The core of this indicator is a normal MACD. Line, signal, and histogram, fully adjustable lengths, four-way histogram coloring based on sign and slope so you can read momentum shifts at a glance.
Alongside it, the indicator draws up to four independent higher-timeframe panels directly in the pane. Each panel is a self-contained mini-chart: recent candles (if enabled) plus that timeframe's own MACD line, signal, and histogram.
The default settings show (4) HTF panels, that are automatically set based on what the current chart timeframe is. The HTF panels can be manually adjusted as desired.
The number of HTF panels can be adjusted between 0 and 4. 0 panels is set by disabling the "Show HTF panels" option in the settings. Disabling the HTF panels simply makes this indicator appear as a standard MACD, which isn't unique and can probably be found in 1000 other indicators elsewhere.
The uniqueness comes from the HTF panels on the side.
The panels settings will match for all timeframes.
When there are between 1 and 3 HTF panels enabled, they will appear vertically stacked on each other.
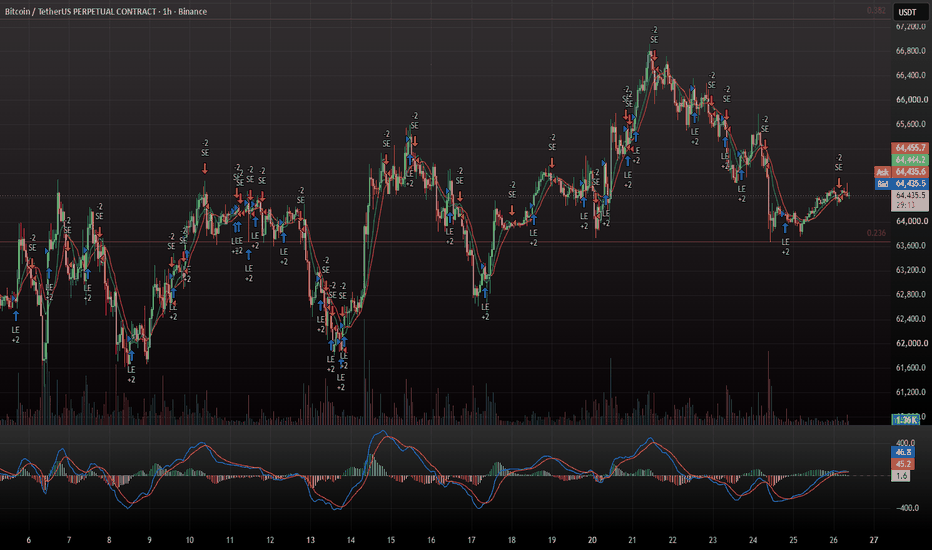
The following image shows (3) panels stacked.
When 4 panels (default) is selected, the stack is 2x2.
The chart price candles can be enabled in the settings to show the candles overlaid on the MACD signals for a complete picture. These are disabled by default to reduce visual clutter.
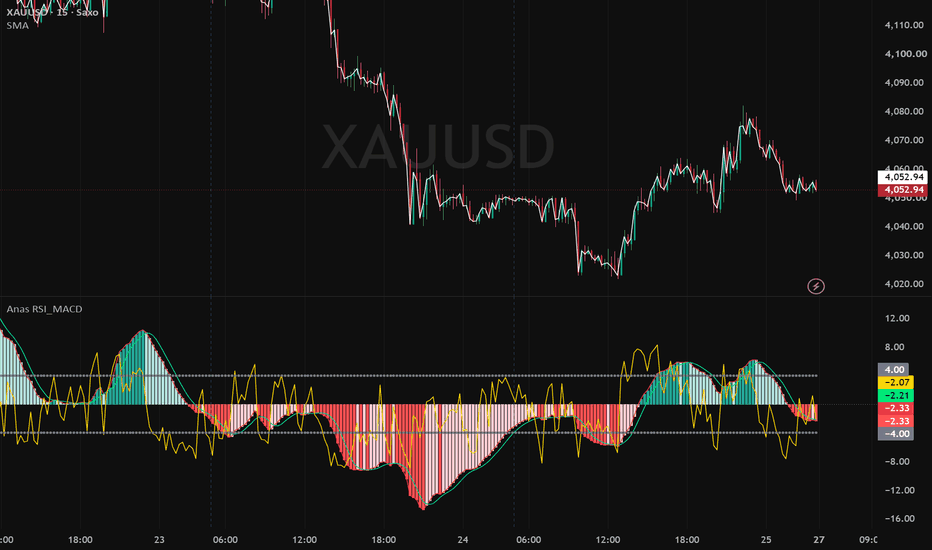
Here is an image showing (4) panels with chart candles enabled within the panels.
The scaling and position of the panels can be adjusted in the settings.
The vertical scaling is based on ATR, so the height of the candles is always proportional to the chart itself.
The horizontal position is calculated in bars, so it can be shifted left or right relative to the current bar.
Finally, there is a table (default position = bottom right)
The table shows the values of the MACD, Signal, and Histogram for all (4) HTF panels. The table position and size can be modified, but it will always show all (4) HTF panel values. If you have only one HTF panel enabled, it will still show you all values. The Histogram column changes color based on the color of the HTF histogram for that timeframe to give a better visual representation of the signal.
This indicator was made to showcase the method for converting custom signals into HTF side panels for custom and complex indicators. The logic used in this indicator can be used on any plotting indicator to display the signals off to the side. Indicateur
Stratégie
Indicateur
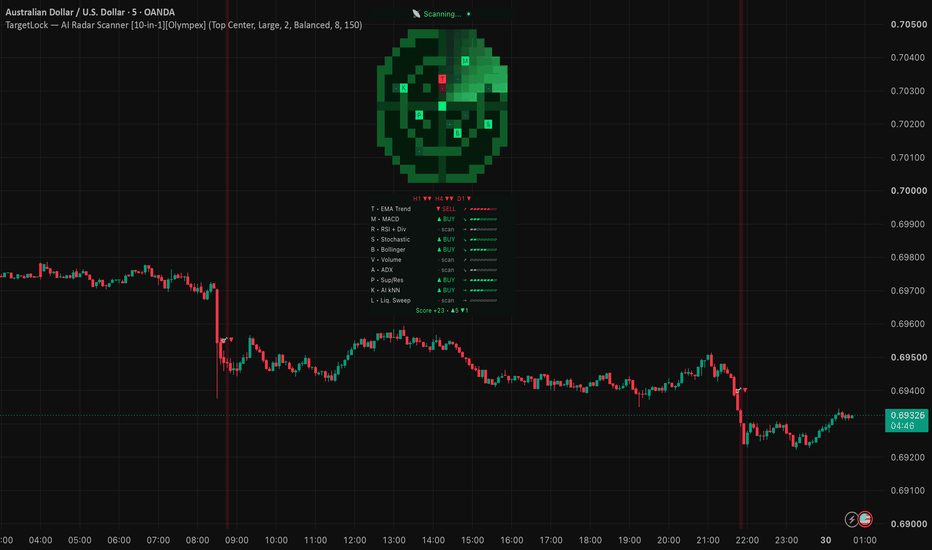
TargetLock_AI Radar Scanner [10_in_1][Olympex]OVERVIEW
A real radar screen for your chart. TargetLock continuously scans 10 independent technical "targets" and displays them as blips on a circular radar HUD — the closer a blip moves to the center, the stronger that signal is. Green blips are bullish, red blips are bearish, and when enough targets converge, the radar locks on and marks the candle.
Stop flipping between 10 indicators. Read them all in one second, on one screen.
🎯 HOW THE RADAR WORKS
Each of the 10 criteria is scored from −100 (strong sell) to +100 (strong buy) every bar:
Blip angle = which criterion it is (10 fixed compass directions)
Blip distance from center = signal strength (closer = stronger)
Blip color = direction (green bulls / red bears)
Faded dot = where that target was 6 bars ago, so you can see targets approaching or retreating
Rotating sweep beam = live animation on every tick
Below the radar, a detail panel shows each criterion's status (▲ BUY / ▼ SELL / · scan), a momentum arrow (↗ strengthening / ↘ weakening), and a strength bar.
📡 THE 10 TARGETS
T — EMA Trend: EMA20 vs EMA50 distance (ATR-normalized) + price vs EMA200 bias
M — MACD: histogram (ATR-normalized) + histogram acceleration
R — RSI + Divergence: RSI(14) positioning, boosted ±30 when a pivot-based bullish/bearish divergence is detected
S — Stochastic: %K position + %K/%D cross
B — Bollinger Bands: %B deviation; weight reduced during a squeeze (breakout not confirmed yet)
V — Volume: spike vs SMA20, direction taken from the candle body
A — ADX/DMI: trend strength × DI+/DI− direction
P — Support/Resistance: ATR-measured distance to the latest pivot levels; breakouts/breakdowns score ±85
K — AI kNN (Lorentzian): a k-nearest-neighbors classifier compares the current bar's normalized feature vector (RSI, MACD, %B, ADX) against up to 300 past bars using Lorentzian distance, then votes by the direction those similar bars moved next. Transparent, rule-based machine learning — no black box, no repainting.
L — Liquidity Sweep (SMC): detects stop hunts — price pierces the 20-bar high/low then closes back inside (bull/bear trap), decaying over ~10 bars
Every target can be toggled on/off individually.
🔒 TARGET LOCK LOGIC
The total score is the average of all enabled criteria. A TARGET LOCK fires only when three conditions align:
total score exceeds the lock threshold, and
a minimum number of criteria agree in the same direction, and
the market is not choppy (Choppiness Index filter — optional)
Three sensitivity presets (High / Balanced / Strict) control the thresholds. An early "target approaching" state warns you before a full lock.
🌦 MARKET WEATHER
A Choppiness Index (14) readout in the header: ☀ clear trend / ⛅ normal / 🌫 choppy. When the market is choppy, lock signals are suppressed by default so you don't get chopped up in sideways ranges.
🕒 MULTI-TIMEFRAME CONSENSUS
One row shows the bias (EMA + RSI + MACD) of the three higher timeframes relative to your chart (e.g., M15 chart → H1, H4, D1), displayed as ▲▲ / ▲ / — / ▼ / ▼▼.
🔔 ALERTS (8 + 1 dynamic)
Target locked LONG/SHORT • LONG/SHORT target approaching • bullish/bearish RSI divergence • liquidity sweep above/below • plus a dynamic alert ("Any alert() function call") that includes ticker, score, vote count and market weather in the message.
⚙️ SETTINGS
9 anchor positions, 3 sizes, cell aspect ratio (if the circle looks squashed on your screen), panel/trail/MTF toggles, sensitivity presets, choppiness filter, per-target switches, and kNN parameters (k, sample memory).
✅ NON-REPAINTING
All signals are computed on closed bars; candle marks are drawn on bar close only
The kNN memory stores only completed bars — it never looks into the future
Higher-timeframe requests use lookahead_off (the current HTF bar may update until it closes, as with any live HTF value)
📖 HOW TO USE IT
TargetLock is a confluence reader, not an auto-trading system. Use it to see market state in one glance: multiple green blips converging toward the center from different directions + higher timeframes aligned ▲▲ = real consensus. A single blip near the center is not enough. On low timeframes (M1–M5), prefer the Strict preset with the choppiness filter enabled. Always combine with your own levels and risk management.
This tool is for educational and informational purposes only and is not financial advice. Past behavior of any signal does not guarantee future results.
Indicateur
Indicateur
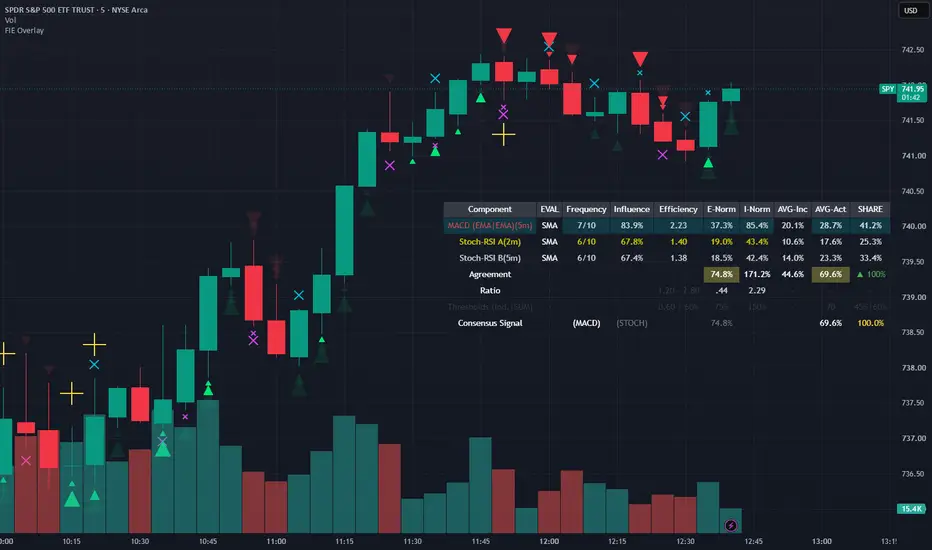
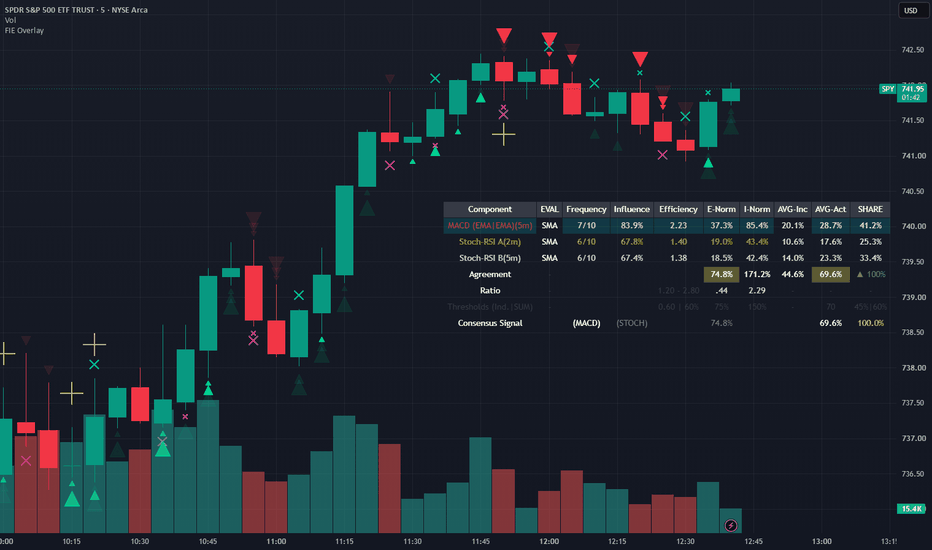
FIE Price Action OverlayFIE (Frequency • Influence • Efficiency) Price Action
FIE is a market analysis framework that measures the quality of agreement between multiple stochastic components and MACD and their respective influence on price action. FIE is designed as an educational decision-support tool for traders who want to evaluate not just whether indicators agree, but how much confidence that agreement deserves.
Instead of treating every component equally, FIE evaluates each component according to three characteristics:
Frequency – How consistently the component aligns with price.
Influence – How much price movement occurs while it is aligned.
Efficiency – A weighted measure that combines consistency and impact.
These measurements are then used to determine each component's relative contribution to the current market move through Share Participation and Normalized Efficiency.
The result is a real-time view of which components are driving the current price action, how much they contribute, and how strongly they agree.
FIE helps distinguish between:
Broad market agreement.
Moves driven primarily by a single component.
Weak participation behind price.
High-confidence confluence where multiple components align with meaningful participation.
The integrated dashboard summarizes each component's contribution, efficiency, participation, and agreement, allowing traders to evaluate the strength and quality of a setup at a glance.
Features
- Frequency, Influence, and Efficiency analysis
- Component Share Participation
- Normalized Efficiency (E-Norm)
- Active Average calculations
- Multi-component confluence analysis
- Confidence and participation dashboard
- High-confluence ("Consensus Signal") identification
- Extensive customization and threshold controls
- Optional Entry signals and crossover levels
- 'Enhanced Candles' to further highlight component/price behaviour
FIE is designed as an educational decision-support tool for traders who want to evaluate not just whether indicators agree, but how much confidence that agreement deserves. Indicateur
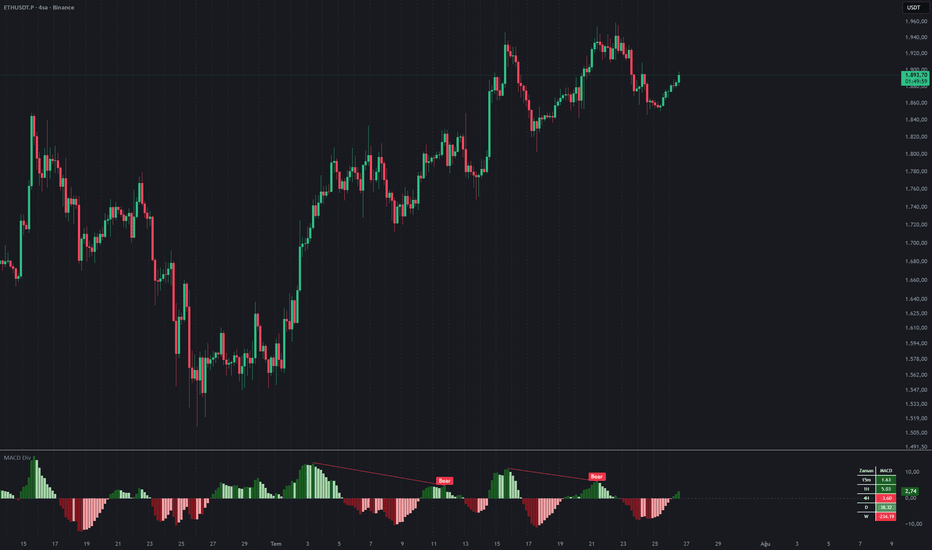
MACD Histogram Divergence📊 MACD Histogram Divergence
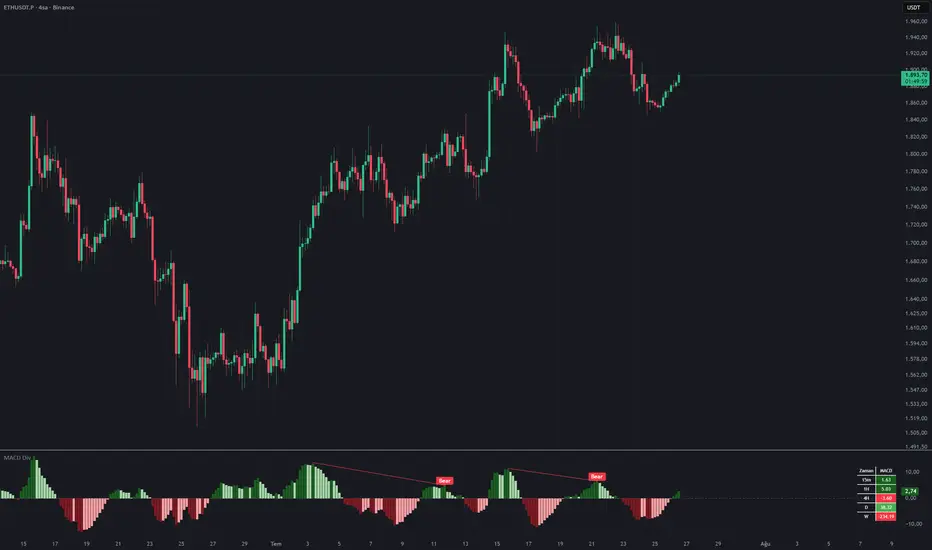
MACD Histogram Divergence is a multi-mode momentum analysis indicator designed to detect regular divergences between price and the histogram of the selected oscillator. It supports MACD, MACD-V, PPO and PVO calculations and includes a five-timeframe table for monitoring oscillator direction and value across different market horizons.
⚙️ General Calculation:
The indicator uses the following common structure:
• Oscillator Value = Selected Oscillator Calculation
• Signal Line = Moving Average of the Oscillator Value
• Histogram = Oscillator Value − Signal Line
Default periods:
• Fast Period: 12
• Slow Period: 26
• Signal Period: 9
• ATR Period: 26
The selected settings are applied to both the chart histogram and all five rows of the multi-timeframe table.
📈 Oscillator Types:
The indicator includes four oscillator modes:
MACD: Classic MACD measures the absolute difference between two price-based moving averages. Its values therefore depend on the price scale of the analyzed instrument.
MACD = Fast Price MA − Slow Price MA
MACD-V: MACD-V normalizes the MACD difference by Average True Range. This reduces the effect of price scale and adjusts the oscillator according to current market volatility. The ATR Period setting is used only when MACD-V is selected.
MACD-V = ((Fast Price MA − Slow Price MA) ÷ ATR) × 100
PPO: The Percentage Price Oscillator expresses the difference between the fast and slow moving averages as a percentage of the slow moving average. This makes its values more comparable across instruments with different price levels.
PPO = ((Fast Price MA − Slow Price MA) ÷ Slow Price MA) × 100
PVO: The Percentage Volume Oscillator applies the same percentage structure to volume rather than price. It measures changes in volume momentum and can help identify whether participation is expanding or contracting.
PVO = ((Fast Volume MA − Slow Volume MA) ÷ Slow Volume MA) × 100
The Source setting applies to MACD, MACD-V and PPO. PVO is calculated directly from volume data.
〽️ Moving-Average Options:
The moving-average type can be selected independently for the oscillator and signal calculations. The Oscillator MA Type is used to calculate the fast and slow moving averages. The Signal MA Type is applied separately to the resulting oscillator value. This allows the response speed and smoothness of the oscillator and signal line to be adjusted independently.
• SMA – Simple Moving Average
• EMA – Exponential Moving Average
• WMA – Weighted Moving Average
• VWMA – Volume-Weighted Moving Average
• RMA – Running Moving Average
• HMA – Hull Moving Average
• TEMA – Triple Exponential Moving Average
🎨 Histogram Colors:
The histogram uses four colors to show both its position relative to zero and its current direction. This structure makes it possible to distinguish the sign of momentum from whether that momentum is strengthening or weakening.
🟢 Dark Green: Positive and rising
🟩 Light Green: Positive but falling
🟥 Light Red: Negative but rising
🔴 Dark Red: Negative and falling
🔍 Pivot-Based Divergence Detection:
Divergences are calculated using confirmed pivots of the selected oscillator’s histogram. The structure uses five bars on the left and five bars on the right of each pivot.
A divergence occurs when price forms a new extreme, but the selected histogram does not confirm that movement. The indicator compares confirmed price highs and lows with the corresponding histogram pivot points.
🟢 Regular Bullish Divergence:
Price forms a lower low while the oscillator histogram forms a higher low. This may indicate that bearish momentum is weakening despite the continued decline in price.
🔴 Regular Bearish Divergence:
Price forms a higher high while the oscillator histogram forms a lower high. This may indicate that bullish momentum is weakening despite the continued rise in price.
⏱️ Five-Timeframe Oscillator Table:
The indicator includes a five-row table on the right side of the chart. Each timeframe can be changed from the indicator settings.
Default timeframes:
• 15 Minutes
• 1 Hour
• 4 Hours
• Daily
• Weekly
The table displays the main value of the selected oscillator—not its histogram value. Its header automatically changes to MACD, MACD-V, PPO or PVO according to the selected mode.
Table colors represent both the position and direction of the oscillator:
🟢 Dark Green: Positive and rising
🟩 Green: Positive but falling
🔴 Dark Red: Negative and falling
🟥 Red: Negative but rising
⚪ Gray: Unchanged or unavailable
The table helps identify whether short-term and higher-timeframe momentum readings are aligned or conflicting.
🔔 Alert Conditions:
The indicator includes alert conditions for:
• Regular Bullish Divergence
• Regular Bearish Divergence
• Histogram crossing from positive to negative
• Histogram crossing from negative to positive
Alerts are calculated using the histogram of the currently selected oscillator.
🎯 How To Use:
This indicator is best used as a momentum confirmation tool rather than a standalone entry system.
A bullish divergence becomes more meaningful when it appears near an established support zone, after an extended decline or alongside a bullish market-structure change.
A bearish divergence becomes more meaningful when it appears near resistance, after an extended advance or alongside a bearish market-structure change.
MACD can be used for classic absolute momentum analysis, while MACD-V and PPO provide normalized alternatives. PVO focuses on volume momentum and may be used to evaluate whether changes in price are supported by changes in market participation.
The multi-timeframe table can then be used to determine whether the broader oscillator environment supports or conflicts with the divergence signal.
🛠️ Best Practices:
MACD Histogram Divergence works best when combined with:
• Market structure
• Support and resistance
• Price action
• Volume analysis
• Trend direction
• Liquidity zones
• Higher-timeframe context
⚠️ Important Notes:
This indicator detects regular divergences only. Hidden divergences are not included.
Divergence calculations always use the histogram of the selected oscillator.
Divergence signals require pivot confirmation and therefore appear after the five-bar right-side confirmation period has been completed.
MACD produces absolute values, while MACD-V, PPO and PVO produce normalized values. Their numerical readings should therefore not be interpreted on the same scale.
PVO depends on the availability and quality of volume data. It may return unavailable or less meaningful readings on instruments without reliable volume data.
Higher-timeframe table values can continue changing while their respective candles remain open.
A divergence represents a disagreement between price and momentum. It does not guarantee that a reversal will occur.
❗ Disclaimer:
This indicator is intended for educational and analytical purposes only.
It is not financial advice and does not guarantee future market performance. Always use appropriate risk management and make your own trading decisions.
Indicateur
Stratégie
Indicateur
Indicateur
Indicateur
Stratégie
Indicateur
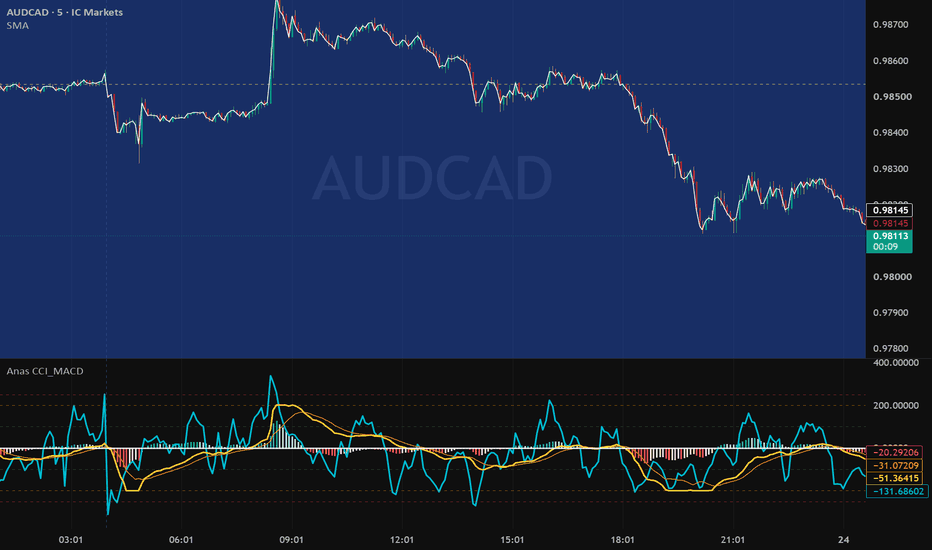
Gabriel's & BK's-Nuclear WinterGabriel's & BK's-Nuclear Winter - Total Market Warfare System
Momentum, participation, pressure, and confluence—organized into one coordinated market-analysis framework.
Collaboration and Authorship
Gabriel's & BK's-Nuclear Winter was jointly developed by my good friend GabrielAmadeusLau and me, Killa_B.
GabrielAmadeusLau has expressly authorized me to introduce and publish this collaborative protected release. Both authors retain full credit for the original framework, the expanded analytical architecture, and the work completed together.
This is not an unauthorized adaptation or republication of another creator’s indicator. It is a direct collaboration between the two named authors, released with the knowledge and approval of both.
All glory and gratitude to G-d.
The “AK” associated with my work honors my mentor, A.K. His discipline, patience, judgment, and commitment to clean execution remain behind every serious tool I build.
What Nuclear Winter Is
Gabriel's & BK's-Nuclear Winter is a multi-oscillator, footprint, directional-participation, multi-timeframe, and confluence-analysis framework.
It is designed to help traders evaluate:
Momentum direction
Momentum acceleration and deceleration
Overbought and oversold conditions
Directional volume participation
Cumulative Volume Delta
Price-versus-CVD disagreement
Multi-timeframe alignment
Volatility and range expansion
Exhaustion-style conditions
Breakout quality
Peak and valley location
Footprint POC and Value Area context
Composite directional confluence
The indicator does not combine multiple studies merely to place more information on the chart.
Each component performs a defined role inside one analytical sequence:
Momentum state → directional participation → range location → multi-timeframe context → breakout or reversal conditions → composite confluence
The dashboard then organizes those readings into one operating picture so the trader does not have to interpret every oscillator independently during live market conditions.
Core Momentum Framework
RSI
RSI operates as the primary normalized momentum engine.
It measures the balance between upward and downward price movement and can optionally incorporate:
Volume weighting
Volatility weighting
Configurable smoothing
Bollinger-style statistical boundaries
Divergence detection
The RSI midpoint helps identify whether momentum is developing above or below its central balance area.
Overbought and oversold readings indicate extension. They do not require immediate reversal.
Normalized MACD
The MACD component compares configurable fast and slow moving averages.
It can incorporate volume and volatility normalization before translating MACD into a normalized oscillator range.
The histogram is used to evaluate:
Positive or negative momentum
Strengthening momentum
Weakening momentum
Acceleration
Deceleration
Directional changes around the signal line
The MACD component is not treated as a basic crossover system. It provides the framework’s primary momentum-expansion and momentum-contraction measurement.
Stochastic
The Stochastic calculation can use three different data sources:
Price
CVD
RSI
This allows the timing engine to evaluate different forms of movement.
Using Price emphasizes traditional range location.
Using CVD emphasizes directional participation.
Using RSI emphasizes momentum timing.
The Stochastic crossover markers provide timing context. They should not be interpreted as complete trade signals by themselves.
CCI and Williams %R
CCI and Williams %R provide additional extension and location measurements.
They help determine whether current conditions are stretched relative to their recent ranges.
These components support the broader momentum framework rather than operate as independent entry systems.
Footprint and Proxy Data
When TradingView footprint data is available, Nuclear Winter can read:
Buy volume
Sell volume
Volume delta
Total footprint volume
Point of Control
Value Area High
Value Area Low
The Ticks Per Row setting controls footprint price aggregation.
The Value Area % setting controls the percentage of analyzed footprint volume included within the calculated Value Area.
Footprint information contributes to:
Current-chart CVD
Directional participation
Delta normalization
POC context
Value Area location
High-volume, low-delta balance conditions
Exhaustion analysis
Breakout analysis
Composite directional scoring
When footprint data is unavailable, the indicator remains operational through a proxy calculation.
In proxy mode:
Bullish candle volume is treated as positive participation.
Bearish candle volume is treated as negative participation.
Doji volume is treated as neutral.
This fallback is not equivalent to true bid-versus-ask trade classification.
The dashboard identifies whether the script is currently using FOOTPRINT or PROXY data.
Higher-timeframe CVD comparisons use the proxy calculation rather than additional higher-timeframe footprint requests. This prevents the script from presenting those higher-timeframe values as native footprint data when they are not.
CVD and Directional Participation
Cumulative Volume Delta accumulates the available delta values over time.
When footprint information is active, the current-chart CVD uses footprint delta.
When footprint information is unavailable, it uses the candle-direction proxy.
CVD is compared with price to identify conditions where the two are not developing together.
Examples include:
Price making a lower low while CVD makes a higher low
Price making a higher high while CVD makes a lower high
These conditions may indicate weakening directional efficiency or a developing transition.
They do not identify a specific market participant and do not guarantee reversal.
The Directional Participation score compares accumulated buying and selling volume across its lookback.
A higher score indicates stronger positive participation within the model.
A lower score indicates stronger negative participation.
The score does not prove institutional activity or identify who executed the trades.
Multi-Timeframe Context
Nuclear Winter compares participation behavior across:
The current chart context
A 15-minute reference
A 60-minute reference
The resulting Multi-Timeframe score summarizes whether those measurements are broadly aligned or mixed.
General interpretation:
Strong bullish agreement indicates positive directional alignment.
Strong bearish agreement indicates negative directional alignment.
Mixed readings indicate disagreement or transition.
The multi-timeframe layer can also stabilize the displayed directional bias when the broader measurements remain aligned.
This stabilization is intended to reduce rapid score changes during short-term noise. It does not prevent legitimate market reversals or guarantee trend continuation.
Higher-timeframe values can change until their source candles close.
Volatility and Range Context
The volatility score uses ATR relative to current price to classify the general movement environment.
It helps determine whether current conditions are:
Quiet
Normal
Elevated
Highly expanded
Volatility does not provide direction by itself.
It indicates how much price is currently moving relative to the instrument’s recent behavior.
The framework also tracks a rolling peak and valley based on recent price history.
These levels provide range-location context for:
Breakout conditions
Rejection conditions
Divergence
Exhaustion
Continuation
Possible reversal development
A recent peak or valley is an analytical reference, not guaranteed support or resistance.
Exhaustion-Style Analysis
The exhaustion module compares the relative position of price with the relative position of CVD.
For example, price may remain near the top of its recent range while CVD has already weakened substantially.
This creates a price-participation disagreement.
The score measures the magnitude of that disagreement.
A higher exhaustion score means price and participation are less aligned under the model.
It does not mean reversal is immediate or certain. Strong directional markets can remain extended while participation readings fluctuate.
When footprint data is available, a high-volume, low-delta condition near a recent extreme can contribute additional exhaustion context.
This describes a balanced auction under elevated volume. It does not prove the presence of an institutional wall or hidden order.
Breakout Context
The breakout module compares current price with the recent rolling high and low.
A bullish breakout condition requires price to move beyond the recent high while delta supports the upward direction.
A bearish breakout condition requires price to move below the recent low while delta supports the downward direction.
The model also evaluates:
Delta relative to its average
Directional participation
Multi-timeframe agreement
Volatility
Exhaustion
The resulting score describes how many of the enabled conditions support the break.
It does not classify any breakout as guaranteed, genuine, or false with certainty.
A breakout can still fail even when all enabled measurements agree.
Momentum Acceleration
The momentum score evaluates changes in the normalized MACD histogram.
It measures whether momentum is:
Expanding upward
Expanding downward
Contracting
Accelerating
Decelerating
Remaining near neutral
A rapid increase in histogram magnitude indicates stronger momentum expansion.
A rapid decrease indicates momentum contraction or transition.
Momentum acceleration provides evidence about the current move. It does not identify the exact beginning or end of a trend.
Large-Range Flow
The Large-Range Flow component compares current candle size with its recent average and evaluates the associated delta behavior.
Its purpose is to identify candles where:
Price range is unusually large
Directional participation is elevated
Footprint balance or imbalance provides additional context
This module was previously described through stronger market-participant terminology.
It should be understood only as a measurement of candle expansion and directional-volume behavior. It cannot identify “smart money,” institutions, funds, or individual traders.
High-Volume, Low-Delta Balance
When footprint information is available, the script can identify bars where:
Total volume is elevated
Absolute delta remains comparatively low
This indicates that a large amount of trading occurred while buying and selling volume remained relatively balanced.
Near a recent price extreme, this can provide useful context for:
Reduced price efficiency
Two-sided participation
Possible rejection
Possible continuation failure
Possible consolidation
It does not automatically confirm absorption, reversal, support, resistance, or participant identity.
Velocity Layer
Nuclear Winter tracks short-term changes across several model scores, including:
Multi-timeframe alignment
Directional participation
Exhaustion
Breakout context
Large-range flow
Momentum
CVD divergence
Delta
Directional bias
High-volume balance
The velocity layer identifies whether those readings are:
Rising
Falling
Accelerating
Decelerating
Stable
Changing rapidly
This helps distinguish a stable condition from one that is actively developing.
Composite Bias
The directional bias combines supporting bullish and bearish factors from the broader framework.
Possible contributors include:
CVD divergence
Directional participation
Breakout conditions
Momentum
Delta
Multi-timeframe alignment
Peak or valley location
Footprint POC context
High-volume balance at an extreme
The final bias score is normalized into a directional range.
A reading above the midpoint indicates stronger bullish evidence within the model.
A reading below the midpoint indicates stronger bearish evidence.
A reading near the midpoint indicates mixed or balanced conditions.
The bias score is not a probability of future price direction.
Confluence Grades
The framework calculates separate grades for:
Long conditions
Short conditions
Reversal conditions
Breakout conditions
Each grade is determined by the number of enabled factors currently aligned.
The grading system ranges from stronger agreement to weak or insufficient agreement.
A higher grade means more of the script’s internal conditions are aligned.
It does not represent:
A guaranteed trade
A historical win rate
A position-size recommendation
A probability of success
The confluence grade should be used as an organizational filter, not as an order command.
Dashboard
The dashboard summarizes the framework through meter-based readings covering:
Directional bias
Multi-timeframe alignment
Volatility
Directional participation
Exhaustion
Breakout context
Large-range flow
Momentum
CVD divergence
Delta
Velocity
Peak and valley location
Footprint status
POC location
High-volume balance
The highlight beacon shows how many dashboard conditions are currently outside their normal range.
The dashboard is intended to reduce information overload by displaying several related measurements inside one interface.
Each meter remains dependent on its underlying calculation and should not be interpreted without context.
Why the Components Work Together
Each component answers a different question.
RSI asks:
Where is momentum located within its normalized range?
MACD asks:
Is momentum expanding, contracting, accelerating, or decelerating?
Stochastic asks:
How is the selected source behaving relative to its recent range?
CCI and Williams %R ask:
Is the market extended?
Delta and CVD ask:
Does directional participation agree with price?
Footprint asks:
Where did the current bar’s analyzed volume trade, and how was that volume divided?
Multi-timeframe analysis asks:
Do broader participation measurements agree?
Peak and valley logic asks:
Where is price inside its recent structure?
The confluence engine asks:
How many of those measurements currently support the same interpretation?
That dependency is the purpose of Nuclear Winter.
It is not a random collection of oscillators. It is a coordinated decision-support architecture that translates several established measurements into one structured analytical workflow.
What Is Original
RSI, MACD, Stochastic, CCI, Williams %R, CVD, footprint delta, POC, Value Area, divergence, ATR, and multi-timeframe analysis are established concepts.
The original collaborative contribution of GabrielAmadeusLau and Killa_B is the specific implementation and interaction between:
A common normalized oscillator environment
Optional volume and volatility weighting
Normalized MACD integration
Selectable Stochastic source routing
Footprint-to-proxy data switching
Current-chart footprint CVD
Proxy-based higher-timeframe participation comparison
Directional participation normalization
Price-versus-CVD exhaustion analysis
Peak and valley mapping
Bias stabilization through timeframe agreement
Velocity calculations across multiple dashboard components
Long, short, reversal, and breakout confluence grading
Highlight clustering
Footprint POC and Value Area context
A unified meter-based dashboard
Expanded calculation tooltips
The protected value is not any individual oscillator.
It is the architecture that connects the components, normalizes their readings, evaluates their agreement, and presents the result through one coordinated analytical interface.
How to Use Nuclear Winter
1. Choose the market configuration
Select one of the available market presets as an initial configuration or use Custom to enter manual oscillator lengths.
Presets are starting settings. They are not guaranteed to be optimal for every symbol, timeframe, or market condition.
2. Confirm the data source
Check the footprint row on the dashboard.
FOOTPRINT means native footprint information is available.
PROXY means directional volume is being estimated from candle direction.
Do not interpret proxy delta as true bid-versus-ask trade classification.
3. Begin with directional bias
Use the bias meter to determine whether the framework currently shows:
Bullish evidence
Bearish evidence
Mixed evidence
The bias is a summary. Review the individual components that produced it.
4. Check multi-timeframe alignment
Determine whether the current, 15-minute, and 60-minute participation measurements agree.
Strong alignment provides broader context.
Mixed alignment indicates conflict or transition.
5. Review momentum
Compare:
RSI position
MACD histogram direction
Histogram acceleration
Stochastic position
CCI extension
Williams %R extension
Stronger conditions occur when several momentum measurements support the same interpretation.
6. Review participation
Compare price direction with:
Delta
CVD
Directional Participation score
CVD divergence
Footprint buy and sell volume
POC location
Price and participation agreement supports the current directional interpretation.
Disagreement can indicate weakening efficiency or a developing transition.
7. Review range location
Determine whether price is:
Near the recent peak
Near the recent valley
Inside the middle of the range
Moving beyond the recent range
Signals near important structural locations generally contain more context than the same signals appearing in the middle of a range.
8. Check exhaustion and breakout context
Use the exhaustion score to evaluate price-versus-participation disagreement.
Use the breakout score to evaluate whether price, delta, volatility, participation, and timeframe context support a range break.
Neither score guarantees reversal or continuation.
9. Review the confluence grade
Use the long, short, reversal, or breakout grade to measure internal agreement.
A higher grade means more enabled factors agree.
It is not an instruction to enter, exit, increase size, or reduce size.
10. Confirm with actual price behavior
Use the dashboard as decision support.
Confirm conditions using:
Candle closes
Market structure
Defined invalidation
Independent risk management
The underlying standard-price chart
Current-bar readings may change before the candle closes.
Realtime Behavior and Limitations
Nuclear Winter recalculates while the active chart candle is forming.
The following values can change intrabar:
RSI
MACD histogram
Stochastic
Delta
CVD
Footprint POC
Value Area
Directional scores
Exhaustion
Breakout context
Bias
Confluence grades
Dashboard highlights
Additional limitations:
Pivot-based divergence requires right-side confirmation bars.
Higher-timeframe values can change until their source candles close.
Higher-timeframe CVD uses proxy data rather than native footprint data.
Proxy delta is based on candle direction and is not true order-flow classification.
POC and Value Area depend on the selected footprint aggregation.
High-volume, low-delta conditions do not identify participant intent.
Scores and grades are internal model measurements, not probabilities.
The indicator cannot identify individual institutions or traders.
It does not display the full order book or resting liquidity.
It does not submit orders or manage positions.
It is not a TradingView strategy backtest.
Historical results can differ across instruments, timeframes, settings, and available data.
Suitable Markets and Timeframes
Nuclear Winter can be applied to:
Futures
Equities
Forex
Cryptocurrency
Commodities
It is most useful on liquid instruments with reliable price and volume data.
Lower timeframes provide faster but noisier readings.
Higher timeframes provide slower and broader market-state context.
Settings should be evaluated separately for each instrument and timeframe.
Risk Disclosure
Gabriel's & BK's-Nuclear Winter is provided for analytical and educational purposes.
It does not provide financial advice, guarantee performance, predict future market direction with certainty, or eliminate trading risk.
Momentum, divergence, footprint, exhaustion, breakout, and confluence conditions can persist, change, or fail.
Users remain responsible for their own:
Market analysis
Trade selection
Position sizing
Entry and exit decisions
Stop placement
Target selection
Order execution
Account risk
Measure momentum. Compare participation. Confirm with price. Respect the invalidation. Indicateur
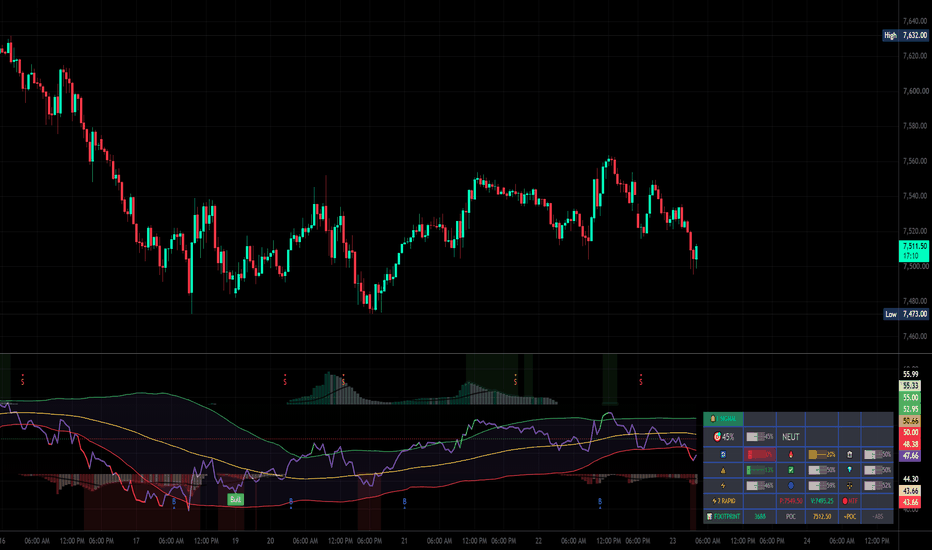
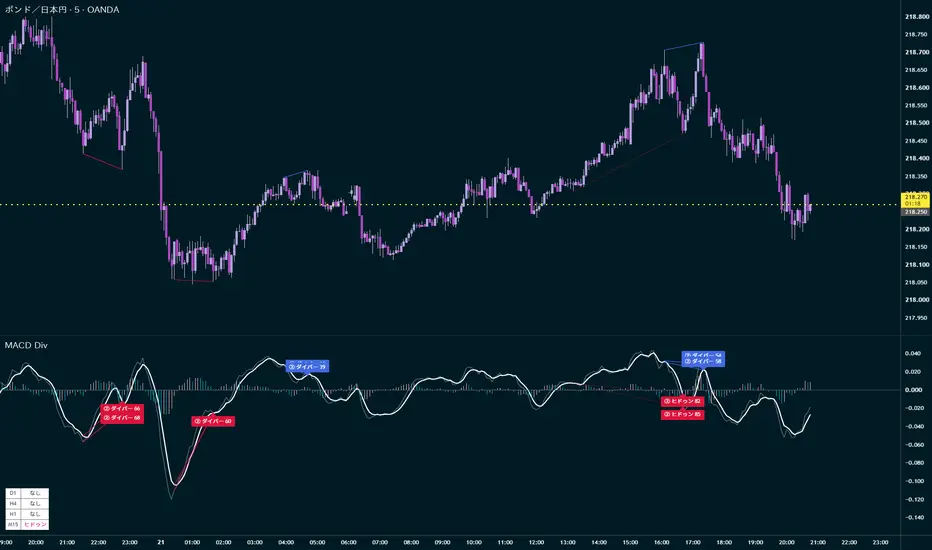
Mochipoyo MACD Divergence [TV]OVERVIEW
Motty MACD Divergence is an invite-only indicator designed to organize regular and hidden MACD divergence information for discretionary chart analysis.
The script uses a configurable ZigZag-style swing detection process based on Depth, Deviation, and Backstep settings. It compares accepted price swing highs and lows with the corresponding values of the MACD main line and signal line.
When the configured conditions are satisfied, the script displays lines, points, and labels representing the detected divergence structure.
This indicator does not place orders, manage positions, or provide guaranteed entry or exit instructions. Its purpose is to reduce repetitive manual comparison between price swings and MACD behavior and to present the information in a consistent visual format.
DETECTED DIVERGENCE STRUCTURES
The script can identify four divergence structures:
1. Bearish Regular Divergence
Price forms a higher high while the selected MACD series forms a lower high.
This structure can indicate weakening bullish momentum, but it does not guarantee a bearish reversal.
2. Bearish Hidden Divergence
Price forms a lower high while the selected MACD series forms a higher high.
This structure can be used as one factor when evaluating possible continuation of a downward trend.
3. Bullish Regular Divergence
Price forms a lower low while the selected MACD series forms a higher low.
This structure can indicate weakening bearish momentum, but it does not guarantee a bullish reversal.
4. Bullish Hidden Divergence
Price forms a higher low while the selected MACD series forms a lower low.
This structure can be used as one factor when evaluating possible continuation of an upward trend.
Only swing points accepted by the configured ZigZag-style engine are evaluated. Changing Depth, Deviation, Backstep, MACD, RCI, or score settings can change which structures are detected.
MAIN FEATURES
• Regular bullish and bearish divergence detection
• Hidden bullish and bearish divergence detection
• Separate detection using the MACD main line and signal line
• Configurable MACD periods and applied price
• SMA signal smoothing for MT5-style behavior or EMA signal smoothing for standard TradingView-style behavior
• Configurable ZigZag-style Depth, Deviation, and Backstep settings
• Optional RCI filter for restricting high-side structures to the selected upper zone and low-side structures to the selected lower zone
• Optional three-pivot divergence detection, displayed with an “×3” label
• Optional strength score from 0 to 100
• Configurable minimum score filter
• Divergence lines in the MACD pane
• Optional divergence lines on the price chart
• Four-timeframe divergence status panel
• Optional second detection engine using separate ZigZag and MACD settings
• Provisional and structurally confirmed alert modes
• Optional structure-break checkmark
• Simplified historical directional summary
WHY THIS SCRIPT IS DIFFERENT
MACD and divergence are established analytical concepts and are available in many public indicators.
This script is not intended to add value by merely plotting a standard MACD. Its purpose is to combine several related analytical processes into one configurable workflow:
• Swing detection using configurable price-structure settings
• Classification of regular and hidden divergences
• Independent evaluation of the MACD main and signal lines
• Optional RCI-based filtering
• Recognition of continuing three-pivot divergence structures
• Rule-based strength scoring
• Multi-timeframe status display
• A second detection engine with independent parameters
• Price-chart and oscillator-pane visualization
• Provisional and structural-confirmation alert options
These functions are integrated so that users can review divergence candidates without repeatedly comparing every price swing and MACD movement manually.
The exact proprietary implementation and thresholds are protected. However, the underlying principle is based on comparing accepted price pivots with the corresponding MACD main-line or signal-line values.
MACD CALCULATION
The MACD main line is calculated as the difference between the selected fast and slow exponential moving averages.
Users can choose between:
• SMA signal smoothing, intended to approximate the MT5 iMACD signal-line convention
• EMA signal smoothing, consistent with the standard TradingView MACD convention
The default MACD settings are 6, 13, and 4, but all periods can be changed by the user.
RCI FILTER
The optional RCI filter evaluates the RCI value at the newer pivot.
For a high-side divergence candidate, the RCI must be at or above the selected upper threshold.
For a low-side divergence candidate, the RCI must be at or below the selected lower threshold.
The default RCI settings are a period of 9, an upper threshold of 80, and a lower threshold of -80.
The RCI filter reduces the number of displayed candidates but does not validate or guarantee the future price direction.
THREE-PIVOT DIVERGENCE
When enabled, the script checks whether the same divergence relationship continues across three consecutive accepted pivots.
If the relationship is present between both pairs of pivots, the label includes “×3,” and an additional line is drawn between the older two points.
An “×3” label describes the detected three-pivot structure. It is not a probability, performance rating, or guarantee that the market will reverse or continue.
STRENGTH SCORE
The optional strength score assigns a value from 0 to 100 to each detected structure.
The score combines rule-based factors including:
• Price separation relative to ATR
• MACD separation relative to recent MACD variability
• Number of bars between pivots
• Swing range relative to ATR
• Position of the compared MACD values relative to the zero line
• Agreement between the MACD main and signal lines
• Higher-timeframe EMA direction
• Current-timeframe EMA structure
• RCI position and direction
The score is an analytical classification value only.
It does not represent:
• The probability of a reversal
• The probability of trend continuation
• Expected return
• Win rate
• Risk-to-reward ratio
• Future profitability
Users can set a minimum score. Structures below the selected threshold are excluded from display, alerts, and the simplified statistics calculation.
SIGNAL STATES AND REPAINTING BEHAVIOR
The script handles divergence structures in two stages:
1. Provisional
2. Structurally confirmed
PROVISIONAL SIGNALS
When the latest swing high or swing low satisfies the configured divergence conditions, the script can display a provisional label and provisional lines.
The latest swing is not yet fixed.
If price extends the same swing by making a higher high or a lower low, the provisional objects can:
• Move to a newer bar
• Be deleted and redrawn
• Change divergence type
• Change score
• Lose the three-pivot classification
• Disappear when the conditions are no longer satisfied
Provisional signals can therefore repaint.
The default notification setting in the current version is “Provisional — Immediate.” An alert generated with this mode can refer to a structure that later moves, changes, or disappears.
STRUCTURALLY CONFIRMED SIGNALS
A provisional high-side structure becomes structurally confirmed when the script subsequently detects an accepted low pivot.
A provisional low-side structure becomes structurally confirmed when the script subsequently detects an accepted high pivot.
At structural confirmation, the script changes the applicable objects from their provisional colors to their confirmed colors.
In the current version, structural confirmation is not necessarily the same as confirmation at the candle close.
An opposite pivot condition can be detected while the realtime bar is still developing. Therefore, the setting named “Confirmed Only” refers to confirmation by the script’s swing structure, not necessarily to end-of-bar confirmation.
Because realtime calculations and developing higher-timeframe values can differ from historical bar calculations, some results may appear differently after the script or chart is reloaded.
For these reasons, this indicator must not be described as fully non-repainting.
ALERTS
The script provides two alert timing modes:
• Provisional — Immediate
• Structurally Confirmed Only
Users can also enable or disable alerts independently for:
• High regular divergence
• High hidden divergence
• Low regular divergence
• Low hidden divergence
To use the alerts, add the indicator to a chart and create a TradingView alert using:
“Any alert() function call”
The selected symbol, timeframe, and script settings are stored when the alert is created. After changing indicator settings or updating the script, the existing alert should be deleted and created again.
The current script uses a once-per-realtime-bar alert frequency. If multiple eligible events occur on the same realtime bar, only the first permitted alert event for that bar may be delivered.
MULTI-TIMEFRAME STATUS PANEL
The multi-timeframe panel displays recent regular or hidden divergence status for four configurable timeframes.
The panel applies the main engine’s ZigZag, MACD, selected-line, and RCI-filter settings to each selected timeframe.
A result is shown only when the detected pivot is within the configured search-bar range.
The panel is intended to organize timeframe information. A displayed result is not an independent trading signal.
Data from a currently developing higher-timeframe candle can change until that candle closes. The panel can therefore change during realtime calculation and can appear differently after reloading the script.
SECOND DETECTION ENGINE
The optional second engine runs another divergence calculation using independent ZigZag and MACD settings.
Signals generated by the second engine include a “②” prefix.
The second engine can help compare a shorter swing structure with a broader swing structure in the same indicator.
The following functions apply only to the first engine:
• Multi-timeframe status panel
• Simplified historical directional summary
• Structure-break checkmark
STRUCTURE-BREAK CHECKMARK
After a first-engine signal becomes structurally confirmed, the script can monitor the most recent confirmed structure.
When the tracked structure level is broken by a confirmed closing price, a checkmark can be added to the applicable label.
The checkmark is a record of the defined structural-break condition. It is not an entry instruction and does not guarantee continuation in the break direction.
SIMPLIFIED HISTORICAL DIRECTIONAL SUMMARY
The optional statistics table is a simplified historical directional summary. It is not a strategy backtest.
When a first-engine signal becomes structurally confirmed, the script records the closing price at the confirmation point.
After the configured number of bars, it compares the later closing price with the recorded closing price and checks whether the net movement was in the direction associated with the detected structure.
The percentage displayed by the table should be interpreted only as a historical directional match rate under this simplified calculation.
It is not an expected trading win rate.
The calculation does not account for:
• Actual entry execution
• Intrabar movement
• Spread
• Commission
• Slippage
• Stop-loss rules
• Take-profit rules
• Maximum adverse excursion
• Maximum favorable excursion
• Position sizing
• Liquidity
• Financing costs
• Taxes
• Risk-to-reward ratio
The displayed “pips” value uses a script-specific conversion based on the symbol’s minimum tick. It may not correspond to the conventional pip definition for every asset class or data provider.
Results also depend on the chart’s loaded historical range and the selected settings.
HOW TO USE THE INDICATOR
The indicator is designed as one component of a broader discretionary analysis process.
Users should consider additional information such as:
• Higher-timeframe trend and structure
• Support and resistance
• Swing-high and swing-low progression
• Moving-average direction
• Volatility
• Market session
• Liquidity
• Scheduled economic releases
• Unexpected news events
• Stop-loss placement
• Position sizing
• Maximum acceptable loss
For example, a bullish regular divergence near an established higher-timeframe support area can provide different analytical context from the same divergence appearing in the middle of an undefined range.
Likewise, bearish divergence during a strong upward trend does not mean that price must immediately reverse.
A divergence label should not be used as the sole reason to enter or exit a position.
MARKETS AND TIMEFRAMES
The script can be applied to symbols available on TradingView, including:
• Foreign exchange
• Stocks
• Stock indices
• Commodities
• Futures
• Cryptocurrencies
Detection frequency and behavior vary according to:
• Symbol
• Timeframe
• Volatility
• Liquidity
• Trading session
• Exchange
• Broker
• Data provider
• Chart history
• User settings
Shorter timeframes generally contain more noise and can produce more frequent changes in provisional pivots.
Higher timeframes generally produce fewer structures, but confirmation can require more time.
Users should evaluate the indicator on the specific symbols, timeframes, and data sources they intend to analyze.
LIMITATIONS
• A divergence does not guarantee a reversal.
• A hidden divergence does not guarantee trend continuation.
• Strong trends can continue after multiple divergence structures appear.
• Provisional labels and lines can move, change, or disappear.
• Structural confirmation can be delayed because an opposite pivot must form.
• Structural confirmation is not necessarily candle-close confirmation in the current version.
• Developing higher-timeframe data can change until the higher-timeframe candle closes.
• Different data providers can produce different pivots and labels.
• The strength score is not a probability or performance forecast.
• The statistics table is not a backtest or verified trading record.
• Historical labels do not represent executable trades.
• The script does not determine the correct stop loss, position size, leverage, or acceptable risk.
• No technical indicator can predict future market movement with certainty.
RISK NOTICE
This indicator is an analytical tool for discretionary chart review.
It does not provide financial advice, investment advice, personalized recommendations, or guaranteed trading signals.
Trading and investing involve substantial risk, including the possible loss of capital. Leveraged products can produce losses greater than the amount initially allocated to a position.
Users are solely responsible for their own analysis, execution decisions, position sizing, risk management, and compliance with applicable laws and regulations.
Past chart behavior and historical calculations do not guarantee future results.
日本語説明
概要
Motty MACD Divergenceは、通常ダイバージェンスとヒドゥンダイバージェンスの候補を、TradingView上で整理して表示する招待専用インジケーターです。
Depth、Deviation、Backstepを使用したZigZag型の波形検出を行い、価格の高値・安値と、対応するMACDメインラインまたはシグナルラインの値を比較します。
条件を満たした場合、MACD画面と価格チャート上にライン、ポイント、ラベルを表示します。
本インジケーターは自動売買を行わず、売買や利益を保証するものではありません。
検出する種類
• 高値ダイバー:価格が高値を切り上げ、MACDが高値を切り下げる構造
• 高値ヒドゥン:価格が高値を切り下げ、MACDが高値を切り上げる構造
• 安値ダイバー:価格が安値を切り下げ、MACDが安値を切り上げる構造
• 安値ヒドゥン:価格が安値を切り上げ、MACDが安値を切り下げる構造
設定されたZigZag型エンジンで有効と判定されたピボットのみを比較します。
主な機能
• 通常・ヒドゥンダイバージェンスの分類
• MACDメインラインとシグナルラインの個別判定
• MACD期間、適用価格、シグナル平滑化の変更
• RCI複合フィルター
• 3点ダイバージェンスの「×3」表示
• 0~100点の強度スコア
• 最低スコアフィルター
• 価格チャート上へのダイバージェンスライン表示
• 4つの時間足を確認するMTFパネル
• 別設定で同時検出するエンジン2
• 未確定・構造確定の通知
• 構造ブレイク時のチェックマーク
• 簡易的な過去方向一致集計
強度スコア
強度スコアは、価格差、MACD差、ピボット間隔、ATR、MACDメイン・シグナルの一致、上位足のEMA方向、現在足のEMA構造、RCIなどを組み合わせた独自の条件評価です。
スコアは、方向一致率、反転確率、継続確率、期待収益または将来の利益を示すものではありません。
サインの確定とリペイント
本インジケーターには「未確定」と「構造上の確定」の2段階があります。
最新の高値または安値を基準とする未確定サインは、価格が同じ方向へ更新された場合に、移動、削除、再描画、種類変更、スコア変更または消失する可能性があります。
そのため、未確定サインはリペイントする可能性があります。
高値側の未確定サインは、その後に有効な安値ピボットを検出した時点で構造上の確定となります。
安値側の未確定サインは、その後に有効な高値ピボットを検出した時点で構造上の確定となります。
現在のバージョンでは、構造上の確定は必ずしもローソク足の終値確定と同じではありません。形成中のリアルタイムバーで反対側ピボットの条件を満たす場合があります。
形成途中の上位時間足データも使用するため、上位足確定前にスコアやMTF表示が変化したり、再読み込み後に表示差が生じたりする可能性があります。
したがって、本インジケーターは完全ノンリペイントではありません。
通知
通知タイミングは次の2種類です。
• 未確定(即時)
• 確定時のみ
現在の初期設定は「未確定(即時)」です。
この設定では、通知後に対象サインが移動、変更または消失する可能性があります。
TradingViewで通知を作成する際は、条件から「Any alert() function call」を選択してください。
同じリアルタイムバーで複数の通知条件が成立した場合、現在の通知頻度設定により、最初の対象通知だけが送信される場合があります。
複数時間足パネル
MTFパネルには、指定した4つの時間足について、設定された検索本数以内の最新ダイバーまたはヒドゥンの状態を表示します。
表示内容は売買サインではありません。
形成途中の上位時間足を参照する場合、対象時間足のローソク足が確定するまで表示が変わる可能性があります。
エンジン2
エンジン2を有効にすると、異なるZigZag設定とMACD設定を使用した2つ目の検出を同時に実行できます。
エンジン2のラベルには「②」が表示されます。
MTFパネル、簡易検証テーブル、構造ブレイクチェックはエンジン1のみが対象です。
簡易検証テーブル
簡易検証テーブルは売買戦略のバックテストではありません。
構造上のサイン確定時の終値と、設定した本数後の終値を比較し、サインが示す方向と一致した回数を簡易的に集計します。
スプレッド、手数料、スリッページ、損切り、利益確定、途中の値動き、ポジションサイズ、流動性などは考慮していません。
表示される割合は将来の方向一致率を示すものではありません。
「pips」の値は最小ティックを基準としたスクリプト独自の換算値であり、すべての市場で一般的なpipsの定義と一致するとは限りません。
利用上の注意
ダイバージェンスだけで売買を決定せず、上位時間足の方向、サポート・レジスタンス、相場構造、ボラティリティ、経済指標、損切り、ポジションサイズなどと組み合わせて判断してください。
通常ダイバージェンスは反転を保証しません。
ヒドゥンダイバージェンスはトレンド継続を保証しません。
強いトレンドでは、複数のダイバージェンスが表示されたあとも価格が同じ方向へ進み続ける場合があります。
リスクについて
本インジケーターは裁量によるチャート分析を補助するツールです。
投資助言、個別の売買推奨または利益を保証する売買シグナルではありません。
FX、株式、指数、商品、先物、暗号資産などの取引には、元本を失うリスクがあります。
実際の取引は利用者自身の判断と責任で行い、適切な損切りと資金管理を実施してください。
過去の値動きや過去データによる計算結果は、将来の結果を保証するものではありません。 Indicateur
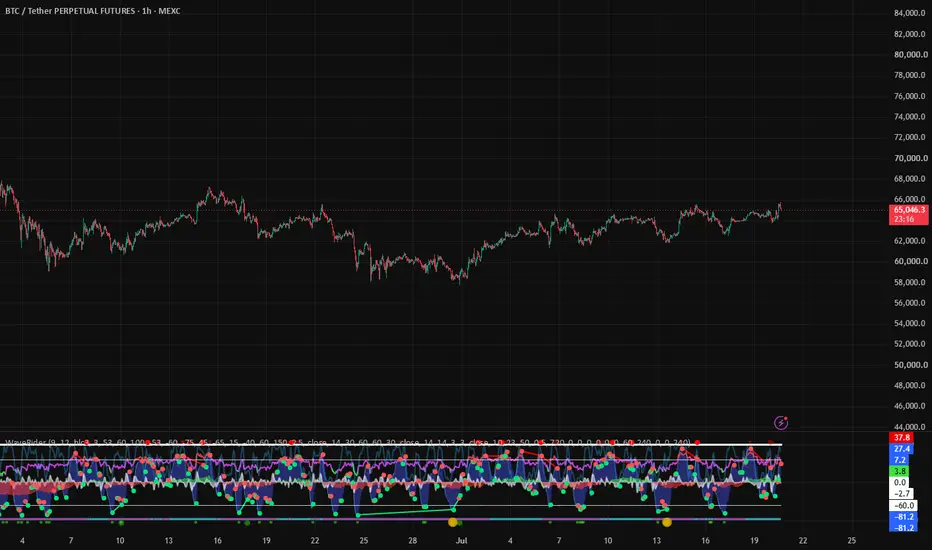
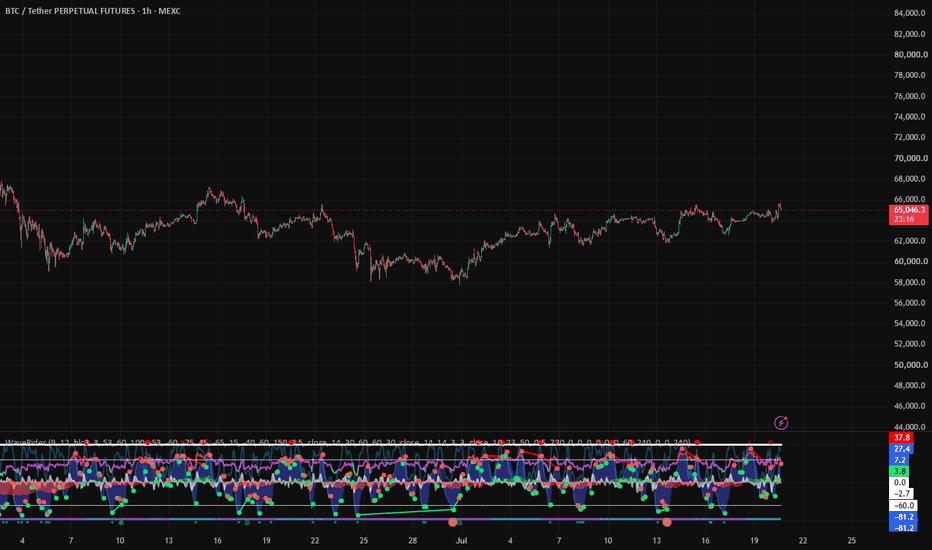
WaveRider Divergence OscillatorWaveRider — RSI−MA Oscillator and Divergences
WaveRider is a momentum oscillator that combines the RSI with its moving average to reveal the underlying market “wave.” It detects bullish and bearish divergences, highlights overbought and oversold extremes, and generates signals based on level crossings and zero-line crossings. It is suitable for cryptocurrencies, indices, forex, and stocks.
Indicator Features
PulseWave Oscillator — RSI − SMA(RSI)
Measures the difference between the RSI and its moving average to capture the true acceleration and deceleration of momentum.
Robust Divergences — No Repainting After Confirmation
Divergences are based on confirmed pivots using ta.pivothigh() and ta.pivotlow(). Bullish and bearish labels appear only after the pivot has been validated.
OB/OS Extreme Zones
Customizable levels, set to ±12 by default, help identify bullish and bearish momentum extremes.
Ready-to-Use Signals
OB/OS: A signal is generated when the oscillator crosses back through an extreme level.
Zero Line: A signal is generated when the oscillator crosses zero, indicating a possible momentum regime change.
Clean Visual Design
Includes gradients, progressive fills toward the zero line, and distinct bullish and bearish colors for immediate interpretation.
Built-In Alerts
Alerts are available for:
Bullish divergence
Bearish divergence
Buy signals
Sell signals
The available buy and sell alerts depend on the selected signal type.
How to Use It
Market Context
Above zero: positive momentum
Below zero: negative momentum
The greater the oscillator amplitude, the stronger the momentum impulse
Identify Momentum Extremes
When the oscillator enters an overbought or oversold area, wait for it to cross back through the extreme level. This often provides a cleaner signal than entering immediately at the extreme.
Look for Divergences
Bullish Divergence
Price forms a lower low while the oscillator forms a higher low.
Bearish Divergence
Price forms a higher high while the oscillator forms a lower high.
For more conservative entries, combine a confirmed divergence with a zero-line crossing.
Create Alerts
Open Create Alert and select one of the conditions provided by the indicator:
Bullish divergence
Bearish divergence
Buy
Sell
Main Settings
RSI Length / RSI MA Length
Controls the RSI period and the moving-average period used to build the oscillator.
Overbought / Oversold
Defines the oscillator’s extreme thresholds. The default values are ±12.
Calculate Divergence
Enables or disables divergence detection.
Pivot Length
Controls pivot sensitivity. The default value is 5.
Signal Type
Available options:
OB/OS
Zero Line
Both
None
Gradient Settings
These settings are purely visual and do not affect the indicator logic.
Display Note
The indicator uses overlay=false, so it is displayed in its own panel for maximum readability.
Recommended Crypto Settings
Adjust the settings according to the volatility of the asset. A longer RSI moving average produces more filtering and less noise.
5-Minute — Scalping
RSI: 20
RSI MA: 20
OB/OS: ±12
Pivot: 5
15-Minute — Fast Intraday
RSI: 20
RSI MA: 22
OB/OS: ±12
Pivot: 5–6
1-Hour — Intraday / Swing
RSI: 20
RSI MA: 34
OB/OS: ±12 to ±14
Pivot: 6
4-Hour — Swing Trading
RSI: 24
RSI MA: 34
OB/OS: ±14
Pivot: 6–7
Daily — Position Trading
RSI: 26
RSI MA: 50
OB/OS: ±15 to ±16
Pivot: 7–8
Quick Adjustment Tips
Too Many False Signals
Increase the RSI MA length, for example from 20 to 34
Increase the pivot length
Widen the OB/OS thresholds, for example from ±12 to ±14
Not Enough Signals
Reduce the moving-average length, for example from 34 to 20
Narrow the OB/OS thresholds, for example from ±14 to ±12
FAQ — WaveRider RSI−MA and Divergences
1. What Is WaveRider Used For?
WaveRider is a momentum oscillator based on:
RSI − SMA(RSI)
It highlights overbought and oversold extremes, zero-line crossings, and bullish or bearish divergences.
2. How Do I Read the Oscillator?
Above zero: positive momentum and bullish pressure
Below zero: negative momentum and bearish pressure
High amplitude: strong momentum impulse and possible price extension
3. What Do Overbought and Oversold Mean?
These are momentum extreme zones, set to ±12 by default, where the current move may begin to lose strength.
Waiting for the oscillator to cross back through the extreme level often provides a cleaner signal than entering while the oscillator is still moving deeper into the extreme.
4. What Signals Does the Indicator Display?
OB/OS Signals
A marker appears when the oscillator crosses back through an extreme threshold.
Zero-Line Signals
A marker appears when the oscillator crosses zero.
You can select:
None
OB/OS
Zero Line
Both
using the Signal Type setting.
5. Do the Divergences Repaint?
No. Divergences use confirmed pivots through ta.pivothigh() and ta.pivotlow().
The divergence label appears only after the pivot has been confirmed. This creates a small confirmation delay, but once displayed, the divergence does not repaint.
6. Why Do I See Few or No Signals?
Check the following:
Signal Type is not set to None
OB/OS thresholds are not too wide for the selected asset
The market may be moving very slowly
The RSI MA length may be too long
The pivot length may be too high
The settings may be too conservative for the active timeframe
7. What Should I Do If I See Too Many Signals?
Widen the OB/OS thresholds, for example to ±14
Increase the RSI moving-average length, for example to 34
Increase the pivot length to 6–8 for more selective divergences
8. Recommended Cryptocurrency Settings
5-Minute
RSI 20
MA 20
OB/OS ±12
Pivot 5
15-Minute
RSI 20
MA 22
OB/OS ±12
Pivot 5–6
1-Hour
RSI 20
MA 34
OB/OS ±12 to ±14
Pivot 6
4-Hour
RSI 24
MA 34
OB/OS ±14
Pivot 6–7
Daily
RSI 26
MA 50
OB/OS ±15 to ±16
Pivot 7–8
9. Which Markets and Timeframes Can Be Used?
WaveRider can be used on:
Cryptocurrencies
Indices
Forex
Stocks
It works on all timeframes.
Higher timeframes generally produce slower and more filtered signals, but they may also provide stronger market context.
10. How Is It Different From a Standard RSI?
Instead of displaying the raw RSI, WaveRider displays the difference between the RSI and its moving average:
RSI − SMA(RSI)
This isolates momentum around an equilibrium level of zero and makes momentum regime changes easier to identify.
11. How Should Divergences Be Used?
Bullish
Price forms a lower low while the oscillator forms a higher low. This may indicate weakening bearish momentum and a possible bullish reversal.
Bearish
Price forms a higher high while the oscillator forms a lower high. This may indicate weakening bullish momentum and a possible bearish reversal.
For more conservative timing, combine a divergence with a zero-line crossing.
12. Are Alerts Available?
Yes. Alerts are available for:
Bullish divergence
Bearish divergence
Buy signals
Sell signals
Open Create Alert, select WaveRider as the condition, and choose the desired alert.
13. Can the Visual Appearance Be Customized?
Yes. You can customize:
Positive and negative colors
OB/OS colors
Label colors
Gradients
Fills toward the zero line
These settings are purely visual and do not affect the underlying calculations.
14. How Can It Be Combined With Other Tools?
WaveRider can be combined with:
Market structure, support and resistance, or channels for targets and invalidation
Trend-following moving averages such as EMA 50 and EMA 200
Volume and volatility tools for breakout confirmation
DivergX One for additional divergence confirmation
15. Best Practices
Avoid entering immediately at an extreme
Wait for the oscillator to cross back through the extreme level or zero line
Backtest the settings before using real capital
Use paper trading first
Adapt the thresholds to the volatility of the asset
Use risk management and protective stops
16. Important Limitations
Signals are not guarantees
They represent a momentum condition, not a certain future price movement
In sideways markets, frequent zero-line crossings may occur
Divergences can remain active while price continues moving in the same direction
Higher volatility can create wider and faster oscillator movements
17. Key Settings — Quick Reminder
RSI Length / RSI MA Length
Controls oscillator speed and smoothing.
Overbought / Oversold
Controls the width of the momentum extreme zones.
Pivot Length
Controls divergence sensitivity. A larger value creates more selective divergences.
Signal Type
Available options:
OB/OS
Zero Line
Both
None
Gradients
Used for visual customization only.
Circles and Triangles
Small Circle
A small circle appears at every WaveRider wave crossover.
Green Circle
A green circle appears when the WaveRider waves are oversold and cross upward, indicating a bullish momentum crossover.
Red Circle
A red circle appears when the WaveRider waves are overbought and cross downward, indicating a bearish momentum crossover.
Gold / Orange Circle
A gold or orange circle appears when:
RSI is below 20
WaveRider waves are at or below −80
The waves cross upward
A strong bullish divergence has occurred
This may indicate the possibility of a strong bullish move.
However, none of these circles should be treated as reliable standalone trading signals. They are informational tools designed to support market analysis and are best combined with DivergX One and additional confirmation.
Purple Triangle
A purple triangle appears when a bullish or bearish divergence forms and the WaveRider waves cross in an overbought or oversold area.
Trade safely and use proper risk management. Indicateur
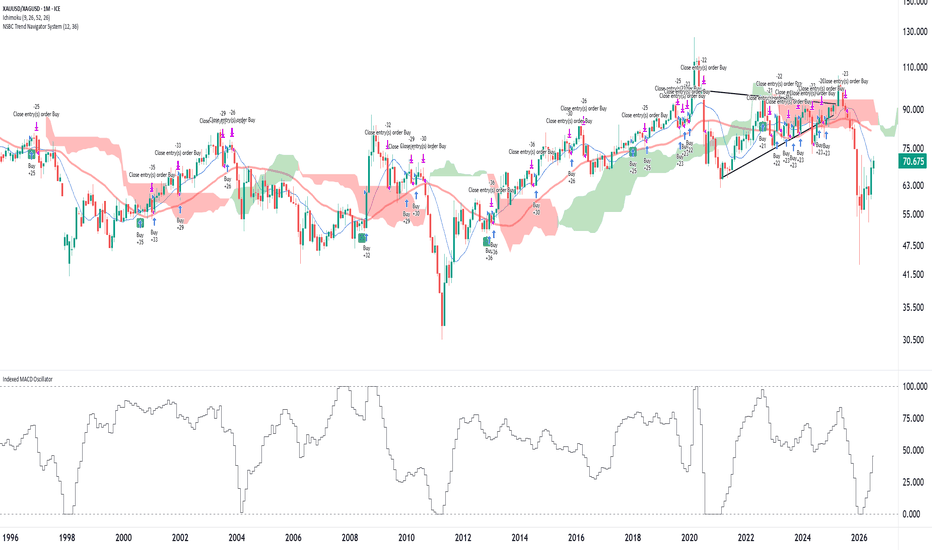
Indexed MACD OscillatorIndexed MACD Oscillator — A normalized version of the standard MACD histogram, rescaled to always oscillate between 0 and 100 (rather than fluctuating in raw price-difference units, which vary a lot by symbol/timeframe). It calculates the standard MACD (12/26 EMA) and signal line (9-period EMA of MACD), takes the histogram (MACD − Signal), then min-max normalizes it using the highest and lowest histogram values over the trailing 100 bars. The result: 0 represents the most bearish momentum reading in the lookback window, 100 represents the most bullish, and the two gray reference lines mark those bounds.
This effectively turns MACD histogram into an oscillator similar in spirit to Stochastic or RSI — useful for comparing momentum extremes across different symbols on a consistent 0–100 scale, since raw MACD histogram values aren't comparable between, say, a $30 stock and a $3,000 stock.
One thing worth flagging for the description/documentation: since the normalization uses a rolling 100-bar high/low, the 0 and 100 levels are relative to recent history, not fixed absolute thresholds — a reading of 100 today doesn't necessarily mean the same momentum strength as a 100 from three months ago, since the window is constantly sliding. Might be worth a line in the description clarifying that it's a relative momentum extremity measure, not an absolute one, so users don't misread it like a fixed RSI-style overbought/oversold level. Indicateur
Indicateur
Stratégie
Stratégie
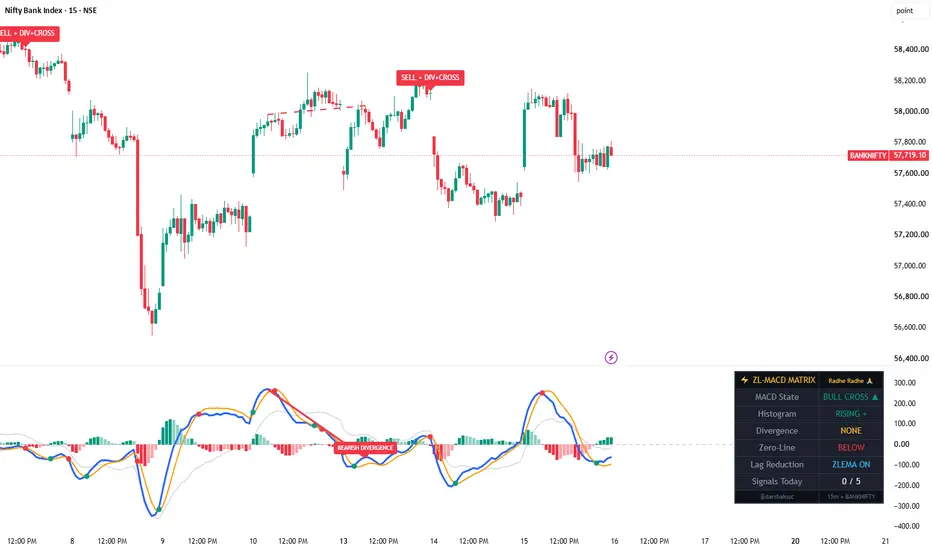
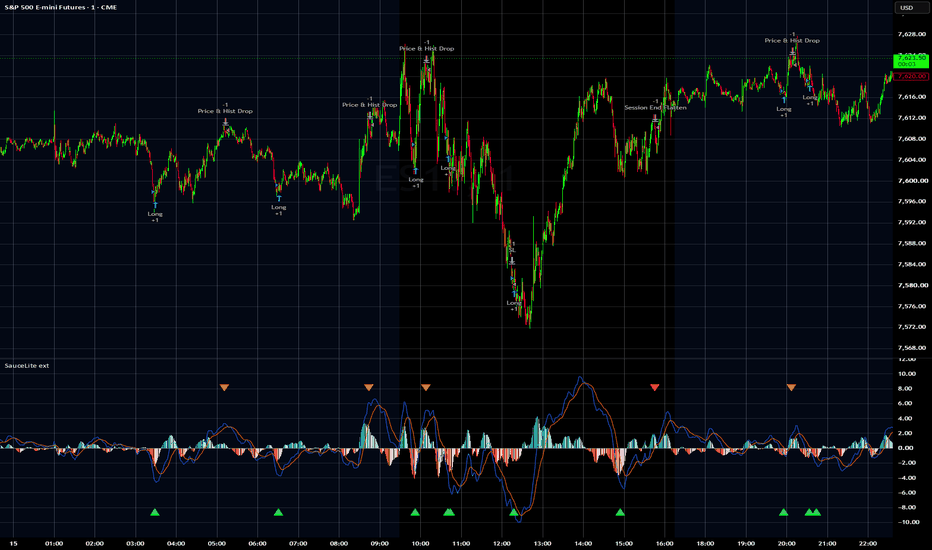
Zero-Lag MACD Divergence Pro Zero-Lag MACD Divergence Pro is a MACD-family oscillator that reduces the indicator's inherent lag using zero-lag exponential averaging, detects regular divergences directly inside the MACD pane, and optionally gates its buy/sell markers so they only appear when a divergence and a crossover confirm each other. It is designed for intraday timeframes but works on any chart.
What makes it original
This is not a standard MACD with cosmetic changes. Three elements work as one system: (1) all three components — fast line, slow line, and signal line — are rebuilt on zero-lag EMAs rather than standard EMAs, (2) divergence detection runs on the zero-lag MACD line itself and draws its lines and labels inside the oscillator pane, with an optional mirrored dashed line on the price chart, and (3) a combo-gating mode suppresses crossover markers unless a divergence was confirmed within a recent, user-defined window, which filters the many insignificant crossovers a MACD produces in ranging markets.
How it works
Zero-Lag Core: Each component uses the zero-lag EMA construction (2 × EMA − EMA of EMA), a public-domain technique attributed to John Ehlers' error-correction work. This roughly halves the effective lag of each average, so crossovers occur earlier than on a classic MACD. A faded classic MACD line can be displayed for side-by-side comparison and switched off in the settings.
Divergence Detection: Confirmed pivot highs/lows on the zero-lag MACD line are compared with price highs/lows at the same bars. A regular bullish divergence (price lower low, MACD higher low) or regular bearish divergence (price higher high, MACD lower high) draws a connecting line between the two MACD pivots with a label in the pane. Pivots confirm only after the lookback period elapses, so divergence lines appear with a delay by design and do not repaint.
Combo Signals: In the default mode, a buy/sell marker prints on the price chart only when a zero-lag crossover occurs while a same-direction divergence is still valid (within a user-defined number of bars). Turning combo mode off prints markers on every confirmed crossover instead. Signals respect a cooldown and a daily maximum.
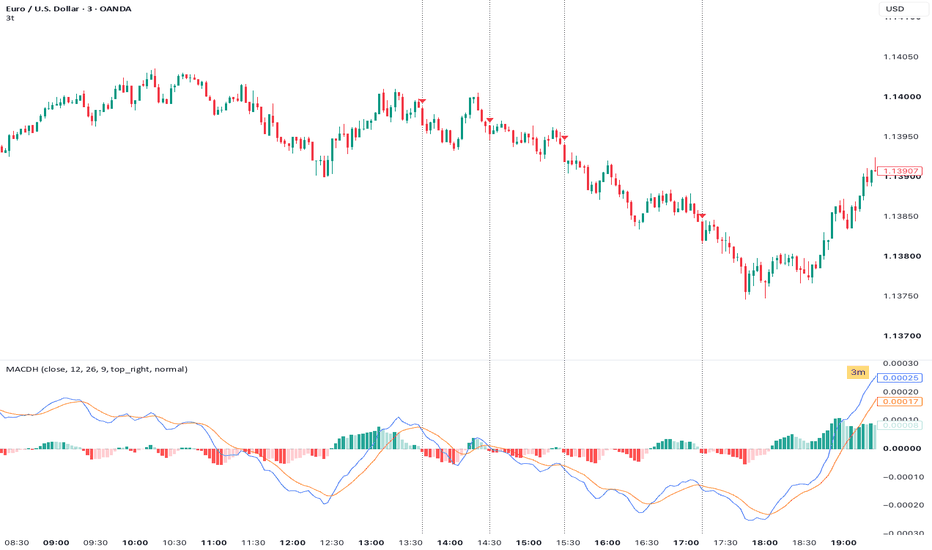
Four-Color Histogram: The histogram distinguishes rising and fading momentum on both sides of the zero line.
Dashboard: A dark, movable panel (styled to stay readable on light-theme charts) summarizes MACD state, histogram direction, active divergence, zero-line position, and the day's signal count.
How to use it
Add the indicator to a lower-timeframe chart (5–15 min for intraday use). Watch for a divergence label in the pane, then wait for the crossover marker that confirms it — the combo mode automates exactly this sequence. The zero-line row on the dashboard helps grade signals: bullish setups above the zero line and bearish setups below it occur in the direction of the broader momentum. All lengths, the divergence window, signal limits, colors, and dashboard placement are adjustable.
Limitations
Divergence lines appear only after pivots confirm (default 5 bars), so they are visible later than the pivot itself; this is the unavoidable cost of non-repainting detection. Reduced lag also means the zero-lag lines are more sensitive than a classic MACD and can produce more crossovers in choppy conditions — the combo mode exists to filter these. This tool describes momentum conditions; it does not predict future price movement, and past behavior of any signal does not guarantee future results. Always combine with your own analysis and risk management. Indicateur

Indicateur

Indicateur