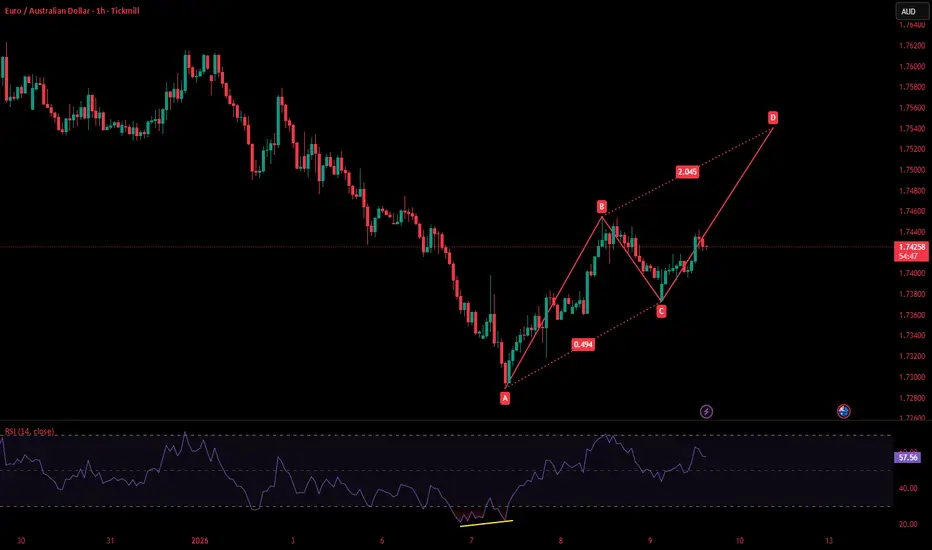
AB=CD
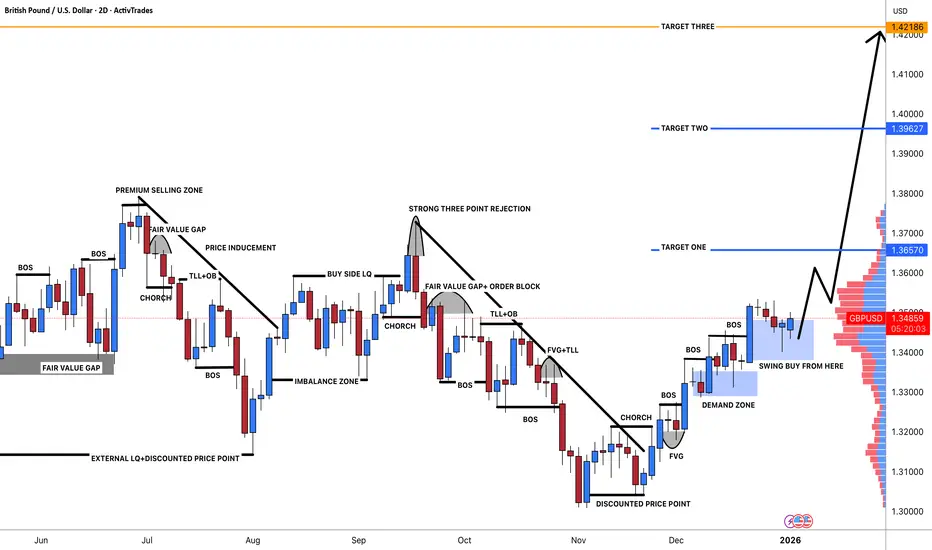
#GBPUSD: Three Targets Swing Buy 720+ Pips Move **Trading Setup For GBPUSD 1 Daily Time Frame**
🔺After a while where the price was mostly down, it hit a low of 1.30 but then turned around. Since then, it has been climbing steadily, with little dips that have only made it go higher. Right now, it is at 1.3490, which we think is a good time to start a long position in GBPUSD.
🔺Trading at the current price is a smart move because the price is up, which helps keep our risk in check and makes the trade more likely to succeed. We can put a stop-loss order below the blue line we marked.
🔺To make some money, we have set three goals. First, we aim for 1.3657, which is a big wall that the price needs to get over. Once it does, we can look at the second goal, which is 1.42. We will keep doing the same thing until we reach our final goal of 1.42.
🔺We would love for you to like and comment on our analysis, as it helps us make more content. Thanks so much for your support!
Sincerely,
Team SetupsFX_🏆❤️
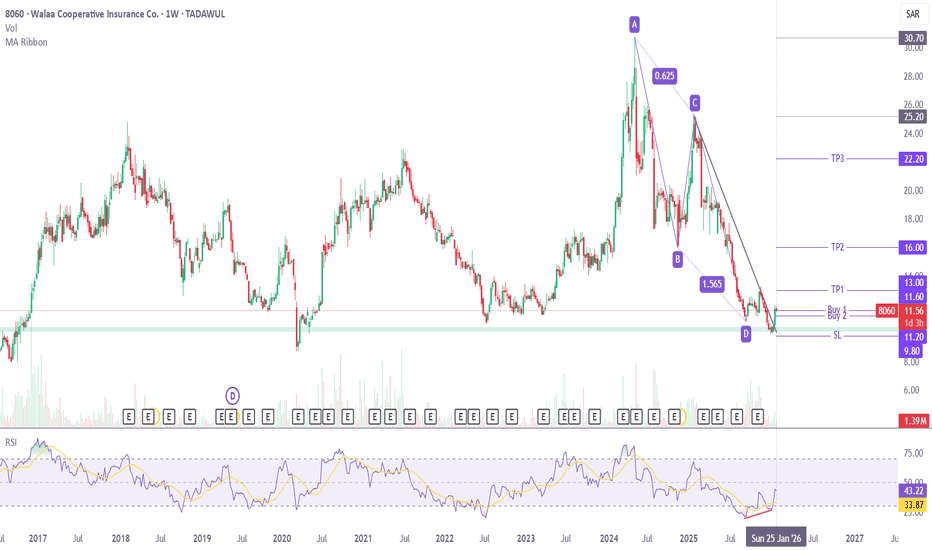
8060 Weekly Technical Analysis: Bullish Setup in Play8060 (Walaa Cooperative Insurance Co.)
Price reacted strongly from a major weekly support, accompanied by a clear bullish divergence on the weekly RSI. Price has also given a downward trendline breakout, improving the short- to medium-term structure.
A bullish harmonic AB=CD pattern is in play, adding pattern confluence at the support zone. Buy 2 is placed lower to allow for a healthier average in case of a pullback, while risk is clearly defined on a closing basis below the key support.
Recommended Levels:
Buy 1: 11.60 (CMP)
Buy 2: 11.20
Stop Loss: Closing below 9.80
Take Profit 1: 13.00
Take Profit 2: 16.00
Take Profit 3: 22.20 / Ride the trend with a trailing stop
Potential remains intact as long as price sustains above the weekly support.
PIAHCL I am Anticipating that PIA is on a potentially deeply retracement after a long rally but peoples are worrying is it going to crash there is no need to worry it’s a healthy correction for next move . But be cautious take entries with strict stop loss which is highlight on chart .
As we are all know trading is just probility game please do your own research before investing it’s a highly volatile stock with weak fundamentals .
GBPNZD: One Swing Entry With One Swing TargetDear Traders,
I hope you’re doing well. We have a fantastic opportunity coming up where the price could move up in an impulse pattern. This trading setup requires just one entry and one swing target but you might also consider using intraday take profit zones.
Like and comment on this post, also please follow us. This will encourage us to share more trading setups!
Team Setupsfx_
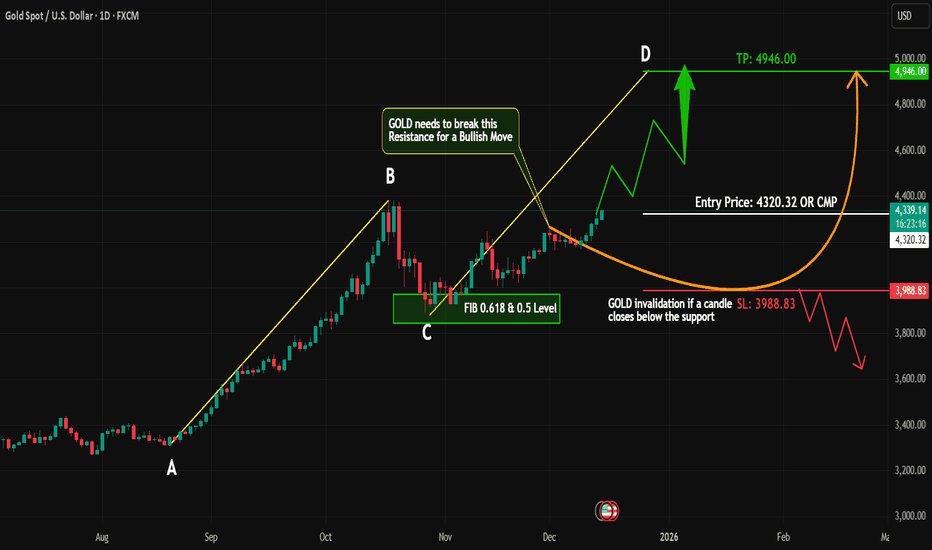
GOLD – AB=CD Bullish Setup | High-Probability Long Opportunity#GOLD is currently trading inside a strong buying zone, and the 1D timeframe is forming a clear AB = CD harmonic pattern.
The AB leg has fully completed, and the CD leg is now in progress, indicating a potential continuation toward the completion zone.
Why This Setup Matters
AB=CD harmonic pattern shows a strong bullish continuation structure
Price is holding within a perfect buying range
No bearish signals on the higher timeframe
Higher-timeframe trend supports long positions
Trading Plan
I will look for long entries at CMP, targeting the completion of the CD leg, with strict risk management to maintain discipline and protect capital.
Strategy Focus
This analysis is based on harmonic pattern confluence and market structure alignment.
If #GOLD continues to respect the current buying range, we may see a bullish move toward the pattern completion level.
Share your thoughts below. Are you expecting continuation or a reversal on #GOLD?
Like, comment, and follow for more advanced setups and daily analysis.
#GoldAnalysis #HarmonicPatterns #ABCDPattern #XAUUSD #GoldTrading #PriceAction #TechnicalAnalysis #TradingView #ForexTrader #SmartMoneyConcepts #TrendTrading #BuyTheDip
Beautifully made HH and then HL.QUICE Analysis
Closed at 38.93 (16-01-2026)
Beautifully made HH and then HL.
Crossing & Sustaining 46 may lead it towards 59 - 60.
Immediate Support seems to be around 35.
However, it should not break 31 now else we
may witness more selling pressure towards 28 initially.
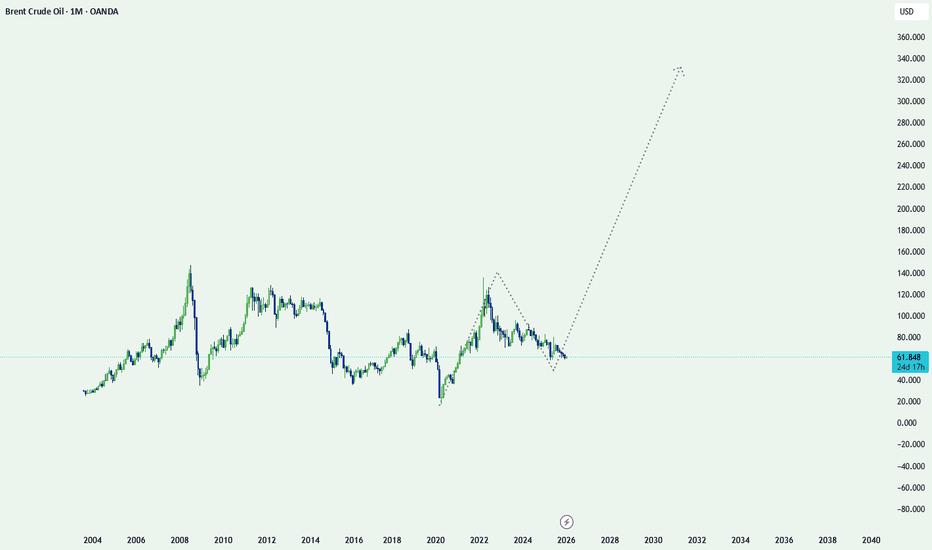
XAUUSD - Market Structure Context (Higher vs Lower Timeframe)PEPPERSTONE:XAUUSD — Market Structure Context (Higher vs Lower Timeframe)
From a higher timeframe perspective , XAUUSD remains in an overall uptrend .
The broader market structure is still bullish, with price respecting higher highs and higher lows.
On the lower timeframe , price is currently trading inside a wider trading range .
Within this range, the market is also forming an ABCD channel , gradually moving higher but without strong momentum.
At this stage, the market is facing multiple resistance areas , including channel boundaries and trendlines. Because of this, upside continuation requires clear acceptance above resistance and renewed momentum.
If price starts to rotate lower instead, it would be more constructive to wait until the market breaks out of the current ABCD structure and builds a new, cleaner setup.
The market will ultimately show direction.
This analysis is focused on context and structure , not prediction.
Trading decisions should be based on where price has room to move ,
not on forcing trades inside compression or resistance-heavy zones.
Note: This idea is shared for educational purposes only and reflects market structure at the time of posting.
GOLDGold after testing the 4H trendline, retrace towards fib 0.382 and then breaks its 4H trendline at 4302.093. The divergence is formed 4H and 1H and playing its role. I am of the opinion that trend line support is broken, price is retracing back from fib lvl 0.382 and trend is in bearish stance, there is probable chance of price to move downward to continue bearish trend till 4195 and if that breaks will see the price moving toward ABCD projection of 4150.
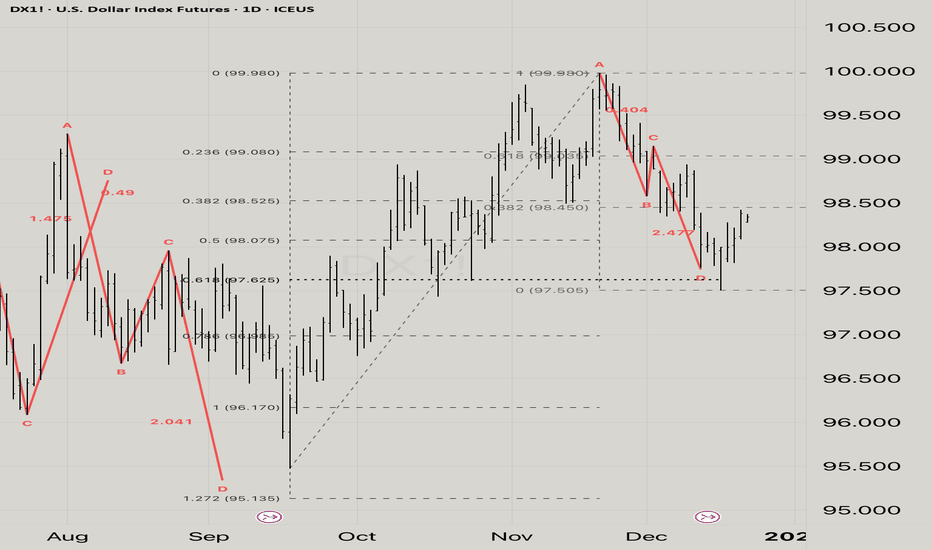
USD Index - Potential Bearish Reversal Following ABCD Pattern1. Technical Context:
The USD Index has rallied for four consecutive sessions, recovering from a prior swing low. This recovery has formed a clear harmonic pattern.
2. Pattern & Fibonacci Analysis:
A bullish ABCD pattern is identified on the lower time frame, with its terminal point (D) completing at the exact 0.618 Fibonacci retracement of the preceding down leg. This constitutes a classic pattern completion signal.
The subsequent rally from point D is now testing a Fibonacci resistance cluster at the 0.382 extension level .
3. Interpretation & Bias:
While momentum is currently near-term bullish, the confluence of a completed harmonic pattern at a key Fibonacci retracement provides a compelling potential reversal map. The structure suggests the rally may be corrective (wave B), increasing the probability for a resumption of the prior downtrend (wave C). The setup favors monitoring for bearish price action at the noted resistance for a short entry opportunity.
4. Key Levels:
Resistance Zone: 0.382 Fib Extension
Pattern Invalidation: A sustained break above the 0.618 extension level.
Confirmation: Requires bearish reversal candlesticks or momentum divergence at resistance.
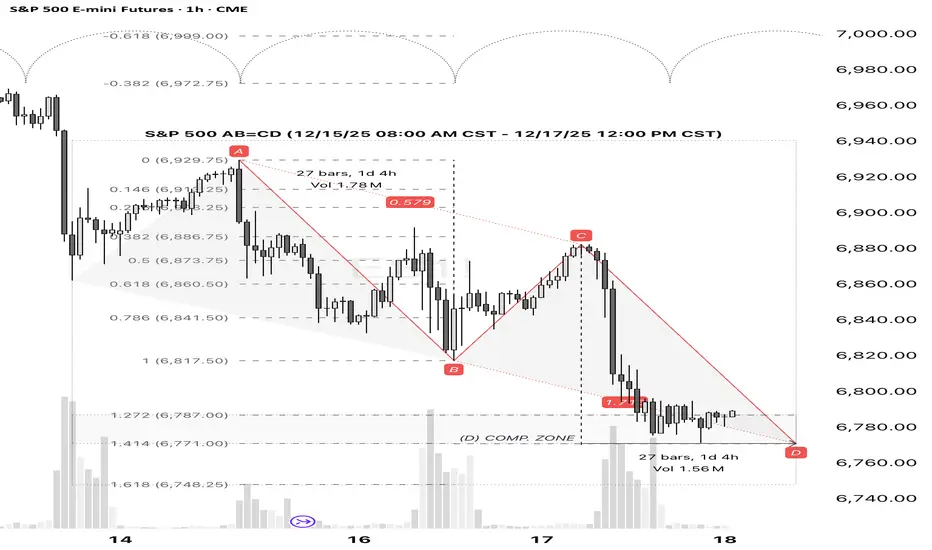
NQ 100 E-mini - Technical Update: C-D Leg Evolution & ProjectionAnalysis:
A bullish AB=CD harmonic pattern remains in progress. The C-D leg has exhibited a strong impulsive advance, aligning with expected volume profile. However, price has yet to reach the primary Fibonacci projection cluster that defines the pattern's D-point completion zone.
Recent Price Action & Interpretation:
A pullback occurred following a test of the initial 1.000 Fibonacci projection (25,323). This is interpreted as a routine retracement within the broader C-D leg, not a reversal signal.
Critical Technical Tenet: The pattern is not considered complete until price tests the 1.272-1.414 Fibonacci extension zone, which serves as the primary confluence for the D point.
Forward Outlook & Triggers:
With the pattern still within its normative completion window, the path of least resistance remains upward toward the key projection zone. A sustained move into the 1.272-1.414 area is sought for potential long exit or reversal setups. Any breach below would negate this constructive view.
SPX: AB=CD Pattern Completion Suggests Long SetupS&P 500 (SPX) - Technical Analysis: Bullish Reversal Signal at AB=CD Completion
1. Pattern Recognition:
A classic bullish AB=CD harmonic pattern has reached its precise completion point (D). This validates the designated support zone as a significant technical area where buyer momentum is anticipated to overcome recent selling pressure.
2. Market Structure Implications:
The successful completion of this pattern suggests:
· The establishment of a firm, technically-defined support level.
· Exhaustion of the prior downward (CD) leg.
· An increased probability of a mean-reversion move higher, targeting a retracement of the recent decline.
3. Trade Thesis & Risk Management:
The confluence at the D point presents a favorable risk/reward opportunity for a long position.
· Action: Initiate long positions.
· Entry Zone: At or near the pattern's D completion point.
· Invalidation Level: A decisive close below the D point invalidates the pattern structure. Place stop loss accordingly.
· Primary Target: The 0.618 Fibonacci retracement of the CD leg.
· Secondary Target: The initiation point (C) of the pattern.
EURUSD – 1-Hour Timeframe Tradertilki AnalysisMy friends, greetings,
I have prepared an EURUSD analysis for you.
My friends, if EURUSD manages to close a candle above the levels of 1.17632-1.17460, I will open a buy position. Immediately after that, I will update here in the trade active section to inform you where I opened the buy position and share the target level.
My friends, I share these analyses thanks to each like I receive from you. Your likes increase my motivation and encourage me to support you in this way.🙏✨
Thank you to all my friends who support me with their likes.❤️
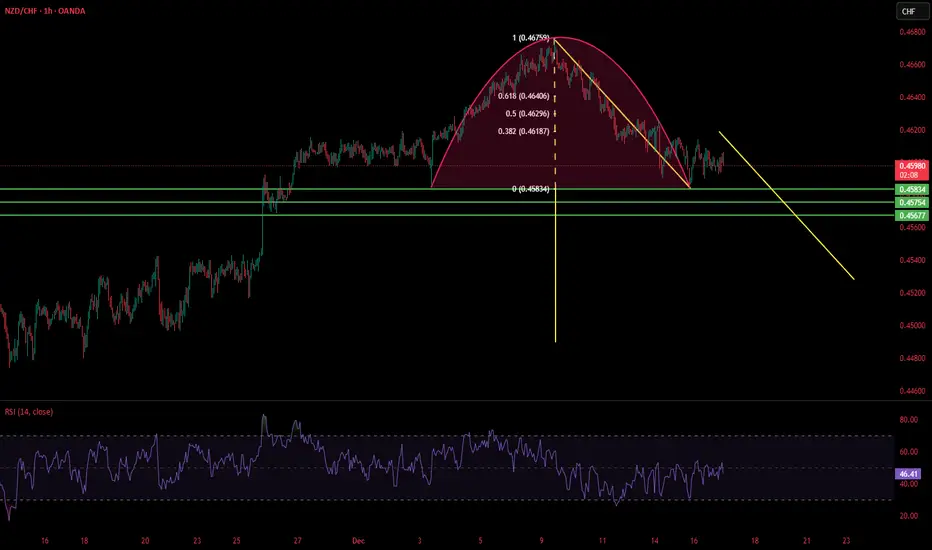
NZDCHFbearish trend continue, while RSI div failed to push the trend upward. Flag done, Harmonic cup formation done, ABCD harmonic is in play.
ZXY started its downward trend which will confirm its bearish stance while falling below the support lvl of 57.55.
CXY in bullish trend while RSI divergence got diluted.
entry lvl should be below fib lvl 0 and stoploss between fib lvl 0.382 & 0.5