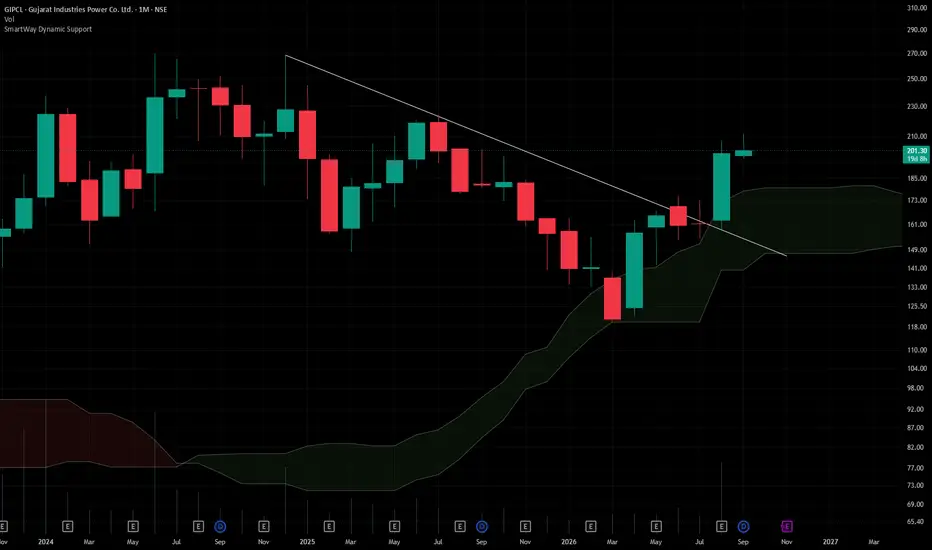
GIPCL## Gujarat Industries Power Company Ltd. (CMP ₹201.00, NSE: GIPCL)
**The SmartWay Research Desk | 11 September 2026**
A Vadodara‑based power generation company, incorporated in 1985. Gujarat Industries Power Company Ltd. (GIPCL) operates **thermal, gas‑based, and renewable power plants**, supplying electricity to Gujarat state utilities and industrial consumers. The company has diversified into **solar and wind energy projects** alongside its lignite‑based thermal stations.
**Promoter Holding (Jun 2026):** **Government of Gujarat & State PSUs — ~54.1% stake (no pledges)**
---
### FY22–FY26 Snapshot
- **Revenue Growth:** FY26 revenue ₹2,842 Cr vs ₹2,512 Cr in FY25 (+13.1% YoY). → **Good**
- **Net Profit:** FY26 PAT ₹412 Cr vs ₹362 Cr in FY25 (+13.8% YoY). → **Good**
- **Operating Margin:** FY26 EBITDA ₹812 Cr, margin 28.6% vs 27.9% last year (+70 bps). → **Good**
- **Equity Capital:** Stable, face value ₹10. → **Good**
- **Dividend Policy:** Dividend ₹3.50/share declared for FY26. → **Good**
- **Asset Building:** Investments in **solar parks, wind farms, and lignite mining expansion**. → **Good**
- **Sales:** Strong demand from **state utilities and industrial consumers**. → **Good**
- **Expense:** Fuel and maintenance costs remain elevated. → **Neutral/Good**
- **EPS:** FY26 EPS ₹13.25 vs ₹11.65 last year (+13.7%). → **Good**
---
### Institutional Interest & Ownership Trends (Jun 2026)
- **Promoter Holding:** ~54.1% (no pledges)
- **FII Holding:** ~8.2%
- **DII Holding:** ~18.6%
- **Retail & Others:** ~19.1%
---
### Strategic Moves & Innovations
- Expansion in **solar and wind energy capacity**.
- Focus on **clean energy transition and sustainability**.
- Partnerships with **state utilities for long‑term PPAs**.
- Diversification into **lignite mining and captive power projects**.
---
### Cash Flow & Balance Sheet Strength
- Market cap ~₹3,200 Cr.
- Debt‑to‑equity ratio ~0.38 (moderate leverage).
- Book value per share ₹142.00; P/B ~1.4.
- EPS (TTM) ₹13.25; P/E ~15.2.
---
### Risk Factors
- Moderate **P/E ratio ~15.2**, valuations fair.
- Dependence on **state utility demand cycles**.
- Exposure to **fuel price volatility and regulatory changes**.
- Competition from NTPC, Torrent Power, and Adani Power.
---
### Investor Takeaway
GIPCL has delivered **steady FY26 performance**, supported by renewable energy expansion, lignite mining, and stable utility demand. With strong promoter backing (Government of Gujarat, 54.1% stake), dividend payouts, and leadership in state power generation, GIPCL remains a **mid‑cap power sector play**. At CMP ₹201.00, valuations are **reasonable (P/E ~15.2, P/B ~1.4)**, reflecting growth potential with manageable risks.  Long
Long
 Long
Long
 Education
THE KEY QUESTION: CAN IT ESCAPE THE SHORT-TERM BOTTOM ZONE?
Hello, traders.
If you follow me, you can stay updated with my latest market analysis and trading insights.
Have a great trading day.
━━━━━━━━━━━━━━━━━━━━━━━━━━━━━━━━━━
【 ETH ENTERS A VOLATILITY WINDOW 】
ETH is currently within a volatility window, which is expected to continue through August 28.
However, BTC's volatility window is expected to run from August 27 to August 29.
Therefore, it may be necessary to monitor ETH's price action through August 29 as well.
ETH is currently trading within the important price zone of:
▶ 2419.83 ~ 2706.15
This makes the price structure formed during this volatility window particularly important.
━━━━━━━━━━━━━━━━━━━━━━━━━━━━━━━━━━
【 1. WATCH FOR HA-HIGH AT 2403.45 】
━━━━━━━━━━━━━━━━━━━━━━━━━━━━━━━━━━
During the recent move, StochRSI has started moving out of the overbought zone.
At the same time, the HA-High indicator appears to be forming around:
▶ 2403.45
If HA-High is confirmed at 2403.45, the next key question will be:
The formation of HA-High indicates that a short-term high structure has developed around this price area.
Therefore,
▶ 2403.45 = SHORT-TERM HIGH STRUCTURE + KEY SUPPORT / RESISTANCE LEVEL
If ETH holds around 2403.45 and moves higher, it could indicate that the previous high structure is being converted into support.
On the other hand, failure to hold this area would increase the probability of a retest of lower support levels.
━━━━━━━━━━━━━━━━━━━━━━━━━━━━━━━━━━
【 2. KEY DOWNSIDE DEFENSE : 2317.39 】
━━━━━━━━━━━━━━━━━━━━━━━━━━━━━━━━━━
If ETH moves lower, the next important level to watch is:
▶ 2317.39
Support around this level should be closely monitored.
If ETH holds 2317.39 and rebounds, the short-term bullish structure may remain intact.
However, if we see:
the short-term bullish structure could weaken.
In that case, partial profit-taking or reducing exposure may need to be considered.
━━━━━━━━━━━━━━━━━━━━━━━━━━━━━━━━━━
【 3. KEY BUY ZONE : 1964.96 ~ 2111.42 】
━━━━━━━━━━━━━━━━━━━━━━━━━━━━━━━━━━
For ETH to maintain its broader bullish structure, the following zone needs to act as meaningful support:
▶ 1964.96 ~ 2111.42
Therefore, if part of the position was sold after a confirmed breakdown below 2317.39, there is no need to immediately chase a rebound.
Instead, watch for the following sequence around 1964.96 ~ 2111.42:
▶ SUPPORT CONFIRMATION
↓
▶ BUYING PRESSURE
↓
▶ RECOVERY STRUCTURE
If this sequence develops, the area could provide an opportunity to rebuild the position through scaled entries.
━━━━━━━━━━━━━━━━━━━━━━━━━━━━━━━━━━
【 4. WHY THIS VOLATILITY WINDOW MATTERS 】
━━━━━━━━━━━━━━━━━━━━━━━━━━━━━━━━━━
Several important technical levels and indicators are currently concentrated around ETH's present price.
That makes the upcoming volatility window especially important.
▶ ETH VOLATILITY WINDOW : THROUGH AUG 28
▶ BTC VOLATILITY WINDOW : AUG 27 ~ AUG 29
The price structure formed as the market moves through these volatility windows could provide an important clue regarding the next directional move.
In other words, the key is not simply whether ETH moves up or down.
What matters more is:
━━━━━━━━━━━━━━━━━━━━━━━━━━━━━━━━━━
【 5. WHY 2887.66 MATTERS 】
━━━━━━━━━━━━━━━━━━━━━━━━━━━━━━━━━━
If ETH continues higher after the volatility window, there is a possibility that price will test:
▶ 2887.66
This is more than just another short-term resistance level.
From a broader market-structure perspective, 2887.66 represents an important breakout level for determining whether ETH can escape its current short-term bottom zone.
The ideal bullish sequence would be:
↓
↓
If ETH breaks above 2887.66 and successfully converts the level from resistance into support, the bullish structure could strengthen significantly.
From this perspective, a confirmed breakout and support conversion around 2887.66 could represent one of the final major buying opportunities after bullish trend confirmation.
━━━━━━━━━━━━━━━━━━━━━━━━━━━━━━━━━━
【 6. KEY CONDITION FOR CONTINUATION : MARKET LIQUIDITY 】
━━━━━━━━━━━━━━━━━━━━━━━━━━━━━━━━━━
However, ETH's chart structure alone is not enough to sustain a broader rally.
The overall crypto market needs sufficient capital inflows.
Therefore, it is important to monitor whether:
▶ USDT
▶ USDC
continue showing gap-up behavior.
If the gap-up trend in USDT and USDC continues, it may indicate that fresh liquidity is entering the crypto market.
That would create a more favorable environment for ETH to sustain its bullish momentum.
However, if we see:
then ETH's current move could end up being only a rebound rather than the beginning of a sustained bullish trend.
Under those conditions, chasing price higher should be avoided.
Instead, it would be better to wait for confirmation that major breakout levels have successfully converted into support.
━━━━━━━━━━━━━━━━━━━━━━━━━━━━━━━━━━
【 KEY PRICE SCENARIO 】
━━━━━━━━━━━━━━━━━━━━━━━━━━━━━━━━━━
The current ETH structure can be summarized as follows:
▶ 2403.45
HA-HIGH FORMATION
Short-term high structure
1st support / resistance decision level
```
↓ IF PRICE DECLINES
```
▶ 2317.39
KEY SHORT-TERM DEFENSE
HOLD
→ Bullish structure may remain intact
BREAKDOWN + FAILED RECLAIM
→ Consider partial selling / risk reduction
```
↓ IF PRICE DECLINES FURTHER
```
▶ 1964.96 ~ 2111.42
MAJOR SUPPORT + SCALED BUY ZONE
SUPPORT CONFIRMED
→ Scaled buying opportunity
SUPPORT FAILURE
→ Increased downside risk
━━━━━━━━━━━━━━━━━━━━━━━━━━━━━━━━━━
On the upside:
▶ 2419.83 ~ 2706.15
CURRENT KEY PRICE ZONE
```
↓
```
▶ 2887.66
MAJOR SHORT-TERM BOTTOM ESCAPE GATE
```
↓
```
```
↓
```
▶ HIGHER PROBABILITY OF A SUSTAINED BULLISH TREND
━━━━━━━━━━━━━━━━━━━━━━━━━━━━━━━━━━
【 FINAL CHECK POINT 】
━━━━━━━━━━━━━━━━━━━━━━━━━━━━━━━━━━
The most important question for ETH is not simply whether price can move higher.
The real question is:
To answer that question, watch:
▶ 2403.45 HA-High formation and support
▶ 2317.39 defense
▶ 1964.96 ~ 2111.42 major support
▶ Breakout from 2419.83 ~ 2706.15
▶ 2887.66 breakout and support conversion
▶ USDT / USDC liquidity flow
The strongest bullish confirmation would come from a combination of:
+
+
+
If these conditions develop together, there would be stronger evidence that the current move is evolving from a simple rebound into the beginning of a broader bullish trend.
On the other hand, if price rises without meaningful liquidity inflows, chasing the rally may carry unnecessary risk.
In that case, it would be better to focus on how price reacts around the major support levels.
━━━━━━━━━━━━━━━━━━━━━━━━━━━━━━━━━━
RESPONSE OVER PREDICTION
PRICE ACTION > PREDICTION
A breakout alone is not enough.
What matters is whether the breakout level successfully converts into support.
━━━━━━━━━━━━━━━━━━━━━━━━━━━━━━━━━━
Thank you for reading.
Wishing you successful trading.
DOGE - CAN IT ESCAPE THE SHORT- AND MID-TERM BOTTOM ZONE???
Hello, traders!
If you follow me, you'll be able to catch new market updates and analysis as soon as they're posted.
Have a great day, and I wish you successful trading.
━━━━━━━━━━━━━━━━━━━━━━━━━━━━━━━━━━
Dogecoin (DOGE) is the original meme coin and remains one of the most iconic assets in the crypto market.
With more and more meme coins entering the market and competing for liquidity, it is worth taking a closer look at DOGE's current market structure.
The key question is whether DOGE can finally escape its short- and mid-term bottom zone.
━━━━━━━━━━━━━━━━━━━━━━━━━━━━━━━━━━
■ 1. MID- TO LONG-TERM MARKET STRUCTURE
━━━━━━━━━━━━━━━━━━━━━━━━━━━━━━━━━━
0.05350 ~ 0.08750
0.11704 ~ 0.14219
The first thing to watch is whether DOGE can maintain support around:
0.05350 ~ 0.08750
If buyers continue to defend this area, the next major upside gateway will be:
▶ 0.11704 ~ 0.14219
The overall structure can be viewed as:
0.05350 ~ 0.08750
↓
SUPPORT
↓
0.11704 ~ 0.14219
↓
BREAKOUT
↓
BULLISH TREND EXPANSION
A breakout above 0.11704 ~ 0.14219, followed by a successful support confirmation, could signal the beginning of a stronger bullish trend.
━━━━━━━━━━━━━━━━━━━━━━━━━━━━━━━━━━
■ 2. FIRST CONDITION FOR ESCAPING THE BOTTOM
━━━━━━━━━━━━━━━━━━━━━━━━━━━━━━━━━━
From the current market structure, the first key area to watch is:
▶ 0.09343 ~ 0.09848
If DOGE moves above 0.09343 ~ 0.09848 and successfully flips this zone into support, it could indicate that price is beginning to escape the current short-term bottom structure.
However, there is an important distinction between:
"BOTTOM ESCAPE"
and
"BULLISH TREND CONFIRMATION."
0.09343 ~ 0.09848
BREAKOUT + SUPPORT
→ Higher probability of escaping the short-term bottom
0.11704 ~ 0.14219
BREAKOUT + SUPPORT
→ Higher probability of a full bullish trend reversal
Therefore, the bullish confirmation sequence can be viewed as:
0.09343 ~ 0.09848
↓
BREAKOUT + SUPPORT
↓
SHORT-TERM BOTTOM ESCAPE
↓
0.11704 ~ 0.14219
↓
BREAKOUT + SUPPORT
↓
BULLISH TREND CONFIRMATION
━━━━━━━━━━━━━━━━━━━━━━━━━━━━━━━━━━
■ 3. WHAT IF DOGE MOVES LOWER?
━━━━━━━━━━━━━━━━━━━━━━━━━━━━━━━━━━
If price starts moving lower again, the most important area to monitor is:
▶ 0.07243 ~ 0.07392
This area represents an important short- to mid-term bottom zone.
Therefore, if DOGE breaks below 0.07243 ~ 0.07392, it may be better to pause new trades and wait for the market structure to stabilize before looking for another entry.
One important point:
Do not buy simply because the price has fallen significantly.
A lower price does not automatically mean that a bottom has formed.
LOW PRICE ≠ CONFIRMED BOTTOM
SUPPORT CONFIRMATION = ENTRY OPPORTUNITY
━━━━━━━━━━━━━━━━━━━━━━━━━━━━━━━━━━
■ 4. FINAL BUYING OPPORTUNITY NEAR THE BOTTOM
━━━━━━━━━━━━━━━━━━━━━━━━━━━━━━━━━━
From a short- to mid-term bottom perspective,
▶ 0.09343 ~ 0.09848
could become the final major buying area near the current bottom if price successfully confirms support there.
However, from a broader trend perspective, another important opportunity may still remain.
▶ SUPPORT NEAR THE 1M M-SIGNAL
Before a full bullish trend begins, if DOGE pulls back toward the 1M M-Signal and successfully confirms support around it, this could represent one of the final major buying opportunities before a larger trend expansion.
The potential bullish sequence would therefore be:
BOTTOM BUY
↓
0.09343 ~ 0.09848 SUPPORT
↓
1M M-SIGNAL SUPPORT
↓
0.11704 ~ 0.14219 BREAKOUT
↓
BULLISH TREND EXPANSION
━━━━━━━━━━━━━━━━━━━━━━━━━━━━━━━━━━
■ 5. DO NOT CHASE THE PRICE
━━━━━━━━━━━━━━━━━━━━━━━━━━━━━━━━━━
In trading, the important question is not:
"How much has the price already gone up?"
The better question is:
"Where has support been confirmed?"
Buying simply because price is rapidly moving higher can easily lead to a FOMO entry.
When volatility increases, traders who chase price often fail to hold their positions through normal pullbacks and may eventually sell near a local low.
Therefore:
CHASE THE PRICE (X)
WAIT FOR SUPPORT (O)
Instead of chasing momentum, wait for price to react at an important support level and confirm whether buyers are actually defending the zone.
━━━━━━━━━━━━━━━━━━━━━━━━━━━━━━━━━━
■ 6. POSITION MANAGEMENT STRATEGY
━━━━━━━━━━━━━━━━━━━━━━━━━━━━━━━━━━
I believe positions should be managed differently depending on where price is located within the broader market cycle.
Near the bottom zone:
▶ Build the MAIN POSITION for a short-term or longer investment horizon.
The position accumulated in this area becomes the core position for the next potential bullish cycle.
Once the main position has been established and price begins trending higher:
▶ Day Trading
▶ Short-Term Trading
can be used to generate additional profits or gradually increase the amount of DOGE held.
Once price begins entering a major high-price zone:
▶ Scale out of the MAIN POSITION
▶ Use Day Trading to generate additional returns
▶ Manage the remaining position according to market conditions
The overall position-management cycle can be summarized as:
BOTTOM
↓
MAIN BUY
↓
HOLD CORE POSITION
↓
DAY TRADING
↓
PROFIT ACCUMULATION
↓
HIGH PRICE ZONE
↓
SCALE OUT
━━━━━━━━━━━━━━━━━━━━━━━━━━━━━━━━━━
■ 7. TRACK YOUR MAIN POSITION AVERAGE
━━━━━━━━━━━━━━━━━━━━━━━━━━━━━━━━━━
To manage this strategy properly, it is important to separately track your:
The average entry price of your main position should be clearly separated from your short-term trading positions.
Otherwise, it becomes difficult to determine which holdings are intended for the larger trend and which are intended for short-term trading.
CORE POSITION
≠
TRADING POSITION
Each position should have a clearly defined purpose.
━━━━━━━━━━━━━━━━━━━━━━━━━━━━━━━━━━
■ 8. DOING NOTHING DURING AN UPTREND CAN ALSO BE A RISK
━━━━━━━━━━━━━━━━━━━━━━━━━━━━━━━━━━
After completing the main accumulation and seeing price begin to trend higher, many traders simply hold their position and do nothing.
Others begin searching for new assets to trade.
However, losses from those new trades can easily reduce the profits generated by the original position.
If you already secured a strong MAIN POSITION near the bottom, it may be more effective to focus on managing that position while using Day Trading to protect and accumulate profits rather than aggressively chasing new assets.
━━━━━━━━━━━━━━━━━━━━━━━━━━━━━━━━━━
■ DOGE KEY LEVELS
━━━━━━━━━━━━━━━━━━━━━━━━━━━━━━━━━━
0.05350 ~ 0.08750
0.07243 ~ 0.07392
0.09343 ~ 0.09848
1M M-Signal SUPPORT
0.11704 ~ 0.14219
━━━━━━━━━━━━━━━━━━━━━━━━━━━━━━━━━━
0.07243 ~ 0.07392
↓
CRITICAL SUPPORT
↓
0.09343 ~ 0.09848
↓
BOTTOM ESCAPE
↓
1M M-SIGNAL
↓
SUPPORT CONFIRMATION
↓
0.11704 ~ 0.14219
↓
MAJOR BREAKOUT
↓
BULLISH TREND EXPANSION
Ultimately, the most important question for DOGE right now is:
"CAN DOGE ESCAPE THE SHORT- AND MID-TERM BOTTOM ZONE???"
Rather than trying to predict the market, focus on how price reacts at the key levels.
Do not chase a breakout before confirmation.
Wait for support.
Then respond to what the market actually shows.
PRICE ACTION > PREDICTION
SUPPORT → CONFIRMATION → ENTRY
BREAKOUT → SUPPORT → TREND
━━━━━━━━━━━━━━━━━━━━━━━━━━━━━━━━━━
Thank you for reading.
Focus on reacting to the market rather than predicting it.
Wishing you successful trading.
LINK — Ready for a Full-Scale Bullish Trend???
Hello, traders.
If you "FOLLOW" me, you'll be able to quickly access my latest market updates and analysis.
Wishing you a successful trading day.
---
The most important price level to watch for LINK right now is:
> > > 11.064 <<<
Simply breaking above 11.064 is not enough.
The real question is:
"Can LINK hold above 11.064 and flip this level from resistance into support?"
If the price successfully establishes support above 11.064,
the market structure could begin preparing for a full-scale bullish trend.
However, if LINK fails to hold the breakout and falls back below 11.064,
turning the level into resistance again,
it would be difficult to confirm that a bullish trend has truly begun.
Below 11.064, LINK may begin entering an area worth watching from a mid-to-long-term investment perspective.
In particular,
> > > 4.976 ~ 6.870 <<<
and below can be considered a major mid-to-long-term investment zone.
Therefore, rather than chasing the price at the current level,
it may be more important to watch for the following sequence:
> > > BREAKOUT ABOVE 11.064
> > > ↓
> > > HOLD ABOVE THE LEVEL
> > > ↓
> > > SUPPORT TEST
> > > ↓
> > > BULLISH STRUCTURE CONFIRMATION
---
For the bullish trend to develop further,
the following levels should be monitored step by step:
1st : 11.064
2nd : 12.950 ~ 14.136
Rather than treating these levels simply as breakout targets,
the important question is:
"Can former resistance turn into support after the breakout?"
In other words, the preferred structure is:
> > > BREAKOUT
> > > ↓
> > > SUPPORT TEST
> > > ↓
> > > SUPPORT CONFIRMATION
> > > ↓
> > > BUYING OPPORTUNITY
Therefore, if LINK shows confirmed support around the 1st and 2nd zones,
it may be worth focusing on finding potential buying opportunities.
---
If LINK begins a full-scale bullish trend,
the next major area to watch is:
> > > 20.111 ~ 25.782 <<<
Once the price enters this zone,
the focus should not simply be on how much higher LINK can move.
The key will be whether the price can establish support within this area.
In particular,
> > > 21.051 ~ 23.976 <<<
contains a significant previous high structure,
which means it may act as an important supply zone and market decision area.
Therefore, two possible scenarios should be considered:
BREAKOUT → SUPPORT CONFIRMATION → FURTHER UPSIDE
or
REJECTION → PROFIT PROTECTION → PREPARE FOR CORRECTION
In other words, a strong rally does not automatically mean "SELL,"
and a breakout does not automatically mean "BUY MORE."
The important thing is to monitor how support and resistance levels flip
and respond accordingly.
---
We should not focus only on the bullish scenario.
If LINK falls back below 11.064
and the level begins acting as resistance,
the price could potentially move toward:
> > > 9.079 <<<
Therefore, the current LINK market structure can be summarized as follows:
11.064 HOLDS AS SUPPORT
↓
BULLISH STRUCTURE STRENGTHENS
↓
12.950 ~ 14.136 BREAKOUT + SUPPORT
↓
HIGHER PROBABILITY OF A FULL-SCALE BULLISH TREND
On the other hand:
11.064 BREAKDOWN
↓
11.064 FLIPS INTO RESISTANCE
↓
BULLISH STRUCTURE WEAKENS
↓
POSSIBLE RETEST OF 9.079
This makes
> > > 11.064 <<<
the current KEY DECISION LEVEL for LINK.
---
Many cryptocurrencies and tokens currently have their StochRSI indicators
inside the overbought zone.
LINK is also positioned in the overbought region,
but it appears to be attempting to cool down relatively quickly.
This is worth watching.
If StochRSI can reset its overbought condition before another major price expansion,
LINK may have an opportunity to rebuild momentum for the next move.
Therefore, around 11.064,
the following three conditions should be monitored together:
Can StochRSI begin rising again
without already being positioned inside the overbought zone?
Can OBV remain above the High Line
or continue trending higher above it?
Can BSSC remain around or above the Zero Line
while maintaining or strengthening its upward momentum?
If these three conditions appear together
while the price successfully holds 11.064 as support,
then we could see:
> > > PRICE STRUCTURE
> > > +
> > > STOCHRSI MOMENTUM
> > > +
> > > OBV BUYING PRESSURE
> > > +
> > > BSSC TREND MOMENTUM
all aligning in the same bullish direction.
If that happens,
LINK may be transitioning beyond a simple short-term rebound
and into:
> > > A FULL-SCALE BULLISH TREND <<<
---
> > > KEY DECISION LEVEL
11.064
> > > 1ST CONFIRMATION LEVEL
11.064
> > > 2ND CONFIRMATION ZONE
12.950 ~ 14.136
> > > MAJOR RESPONSE ZONE DURING THE BULLISH TREND
20.111 ~ 25.782
> > > MAJOR PREVIOUS HIGH / SUPPLY ZONE
21.051 ~ 23.976
> > > IF 11.064 BREAKS DOWN AND FLIPS INTO RESISTANCE
Possible retest around 9.079
> > > MID-TO-LONG-TERM INVESTMENT AREA
Below 11.064
> > > MAJOR MID-TO-LONG-TERM INVESTMENT ZONE
4.976 ~ 6.870 and below
---
Ultimately, the most important question for LINK right now is not:
"How high can LINK go?"
The first question is:
> > > CAN LINK BREAK ABOVE 11.064?
And more importantly:
> > > CAN LINK TURN 11.064 INTO SUPPORT?
If LINK successfully holds above 11.064
while
StochRSI + OBV + BSSC
confirm strengthening momentum,
then the market may have completed the preparation needed
for a full-scale bullish trend.
However, if 11.064 fails to hold,
the priority should shift from expecting further upside
to preparing for a possible correction toward 9.079.
---
"CONFIRM FIRST. RESPOND SECOND. PREDICT LAST."
Thank you for reading.
Wishing you successful trading.
HYPE — CAN THE PRICE HOLD ABOVE 73.214?
Hello, traders.
If you "Follow" me, you can quickly receive updates whenever a new analysis is published.
Have a great day,
and I wish you successful trading.
==================================================
■ HYPE : WHAT IS THE MOST IMPORTANT LEVEL AT ATH?
==================================================
There are some coins that continue to move higher as trading activity increases, yet surprisingly, very few people around us seem to actually be trading them.
HYPE, currently ranked among the top cryptocurrencies by market capitalization excluding USDT and USDC, appears to be one of them.
HYPE has already completed a major upward wave.
Therefore, what matters from this point forward is not simply:
"How much higher can it go?"
but rather:
"Can the price hold the key levels created during this rally and continue the bullish trend?"
Since HYPE is currently making new ATHs (All-Time Highs), there is no clear historical resistance above the current price.
Therefore, I used Fibonacci levels to identify potential upside targets and important support levels.
--------------------------------------------------
--------------------------------------------------
To maintain the current bullish structure, I believe there are two major levels that need to hold.
1st SUPPORT : 73.214
2nd SUPPORT : 59.630
The first and most important level to watch is:
>>> 73.214 <<<
If the price can hold above 73.214,
the current bullish structure is likely to remain intact.
However,
if 73.214 fails to hold as support,
the probability of a move toward the next major support around 59.630 may increase.
If both
73.214
↓
59.630
fail to provide support,
the next major downside target could be:
>>> around 38.155 <<<
Therefore, even while HYPE continues to print new ATHs,
it is important not to focus only on further upside.
A response plan should already be prepared for a scenario in which 73.214 and 59.630 fail to hold.
==================================================
■ WHAT IF THE PRICE HOLDS ABOVE 73.214?
==================================================
If the price remains above 73.214,
the next important upside levels are:
1st : Fibonacci 0.5
→ 79.365
2nd : Fibonacci 0.618
→ 86.034
3rd : Fibonacci 2.618
→ 95.656
Therefore, the structure to watch is:
73.214 SUPPORT
↓
79.365
↓
86.034
↓
95.656
At each level, we need to monitor whether resistance is broken and successfully flipped into support.
However, the current indicator structure suggests that we should not focus exclusively on the bullish scenario.
==================================================
■ StochRSI : OVERBOUGHT
==================================================
The StochRSI is currently in the overbought zone.
During a strong bullish trend, StochRSI can remain overbought while the price continues to move higher.
Therefore,
"StochRSI OVERBOUGHT = IMMEDIATE DROP"
is not the correct way to interpret the indicator.
However, as the rally continues,
the probability of a price correction or sideways consolidation to cool down the overheated momentum may gradually increase.
If such a correction occurs,
the most important level to watch will be:
>>> 73.214 <<<
==================================================
■ WHY IS 64.243 ~ 70.050 IMPORTANT?
==================================================
The 64.243 ~ 70.050 zone is formed by:
- 1W HA-High
- 1D HA-High
Therefore, this area can be considered a higher-timeframe high-price zone.
If a meaningful bearish move begins,
we should not automatically expect the 64.243 ~ 70.050 zone to provide strong support.
There is a possibility that the price could move below this entire area.
This is why
>>> THE 73.214 BREAKDOWN <<<
is especially important.
If the price falls below 73.214 and fails to quickly reclaim it,
the probability of a deeper correction toward 59.630 may increase.
--------------------------------------------------
--------------------------------------------------
95.656 → 3rd Upside Target
86.034 → 2nd Upside Target
79.365 → 1st Upside Target
73.214 → ★ KEY SUPPORT / TREND DECISION LEVEL
64.243~70.050 → 1W + 1D HA-High Zone
59.630 → ★ 2nd Major Support
38.155 → Major Lower Support Candidate
==================================================
■ OBV REMAINS STRONG
==================================================
The OBV is currently holding above the High Line.
This suggests that strong buying pressure remains active in the market.
Therefore, even though StochRSI is overbought,
if OBV continues to maintain strength above the High Line,
the price could still be pushed higher by aggressive buying pressure.
In other words, we currently have two opposing conditions:
StochRSI : OVERBOUGHT
↓
OVERHEATED
OBV : ABOVE HIGH LINE
↓
STRONG BUYING PRESSURE
Therefore, opening a short position simply because StochRSI is overbought could be risky.
==================================================
■ SHORT POSITION STRATEGY
==================================================
At the current price level,
one of the opportunities we can look for is a potential short setup.
However,
>>> THE MAIN SHORT SCENARIO BEGINS BELOW 73.214 <<<
in my view.
As long as the price remains above 73.214,
the bullish structure may still be intact.
Therefore, aggressive short entries before a confirmed breakdown require caution.
Especially while
OBV > High Line
remains valid,
stronger-than-expected upside momentum could continue,
potentially creating a Short Squeeze.
Therefore, I would approach the structure as follows:
ABOVE 73.214
→ BE CAUTIOUS WITH SHORT ENTRIES
BREAK BELOW 73.214
→ WATCH FOR BEARISH CONTINUATION
BREAKDOWN + FAILED RECLAIM OF 73.214
→ SHORT SCENARIO STRENGTHENS
59.630
→ NEXT MAJOR DOWNSIDE TARGET / SUPPORT TEST
==================================================
■ WHERE SHOULD MID- TO LONG-TERM INVESTORS BUY?
==================================================
At the current price level,
it is difficult to find an attractive new entry for a mid- to long-term position.
The main reason is that the price has already moved above:
64.243 ~ 70.050
This area contains the 1W HA-High and 1D HA-High levels,
which means the price is already trading above a higher-timeframe high-price zone.
Therefore, rather than aggressively chasing the price,
I believe it is better to wait for a correction.
From a mid- to long-term perspective,
>>> 59.630 ~ 73.214 <<<
is the area I would watch.
If the price corrects into this zone and then begins to move higher again,
I would gradually consider scaling into a position after confirming support.
If possible,
>>> AROUND 59.630 <<<
would provide a more attractive area to evaluate a potential mid- to long-term entry.
==================================================
■ DON'T COMPARE YOUR RETURNS WITH OTHER TRADERS
==================================================
When the market begins to rally strongly,
it is easy to start thinking:
"Everyone else seems to be making money..."
"Why am I making less?"
"If I had traded more aggressively, I could have made much more..."
Once you start thinking this way,
there is no end to it.
What matters is not someone else's return.
What matters is:
>>> YOUR CAPITAL AND YOUR OWN TRADING STYLE <<<
First, decide whether you are trading as a:
Day Trader,
Swing Trader,
or
Position Trader.
Then, the next important factor is:
>>> LIQUIDITY MANAGEMENT <<<
Instead of deploying all your capital into a single trade,
you need to maintain enough liquidity to continue participating in future opportunities.
==================================================
■ STAYING IN THE MARKET MATTERS MORE THAN ONE BIG WIN
==================================================
Generating a large return from a single trade can take a considerable amount of time.
And realistically,
some degree of luck is usually involved.
Of course, there are situations where a coin suddenly explodes higher and someone makes a huge profit from a single trade.
But trading while waiting for that kind of move is similar to buying a lottery ticket and waiting to hit the jackpot.
The important question in trading is not:
"How much did I make from one trade?"
but:
"How long can I continue trading in the market?"
Once you begin trading,
it is important to maintain sufficient liquidity and build a structure that allows you to accumulate profits consistently over time.
==================================================
■ AND ONE MORE IMPORTANT THING
==================================================
Just because you have entered a trade
does not mean you need to stare at the chart all day.
If you have already defined your:
Entry Price,
Stop-Loss,
Take-Profit Targets,
and Additional Entry Levels,
then it is better to focus on your real life while the market develops.
Watching every small price movement does not automatically improve your trading skills,
nor does it guarantee higher returns.
In many cases,
it can actually increase unnecessary trades and emotional decision-making.
Charts are tools for trading.
They are not screens that need to be watched all day.
==================================================
■ FINAL CHECK
==================================================
The most important question for HYPE right now is simple:
>>> CAN THE PRICE HOLD ABOVE 73.214? <<<
73.214 HOLDS AS SUPPORT
↓
79.365 BREAKOUT ATTEMPT
↓
86.034
↓
95.656
73.214 BREAKDOWN
↓
MOVE BELOW 64.243 ~ 70.050
↓
59.630 SUPPORT TEST
↓
59.630 BREAKDOWN
↓
INCREASED DOWNSIDE RISK TOWARD 38.155
At the moment:
OBV = STRONG BUYING PRESSURE
StochRSI = OVERBOUGHT / OVERHEATED
Therefore, rather than trying to predict the direction in advance,
I believe the key is to watch how the price actually reacts around 73.214.
-------------------------------------
RESPONSE OVER PREDICTION.
PRICE IS THE RESULT.
LIQUIDITY IS THE POWER.
SUPPORT CONFIRMS THE TREND.
-------------------------------------
Thank you for reading until the end.
I wish you successful trading.
Accumulation Complete??? BTC Is Moving Into the High-Price Zone.
Hello, traders!
If you "Follow" me, you'll be able to receive new market updates and analysis more quickly.
I hope you have a successful trading day.
━━━━━━━━━━━━━━━━━━━━━━━━━━━━━━━━━━
BTC has rebounded from the low-price accumulation zone and has now reached its first major high-price zone.
▶ Low Zone : 69,978.65
▶ 1st High : 71,280.01
In other words,
BTC began its upward move around 69,978.65 and has now touched 71,280.01, the first potential profit-taking level.
This suggests that the market is gradually transitioning from an
"ACCUMULATION PHASE"
to a
"PROFIT-TAKING PHASE."
━━━━━━━━━━━━━━━━━━━━━━━━━━━━━━━━━━
At the current price level, protecting existing profits becomes more important than aggressively adding new positions.
Therefore,
▶ Day Trading
→ Set a clear stop-loss level before entering a trade.
▶ Core Position
→ Consider gradually taking profits as BTC moves higher.
In other words, this is no longer the ideal area to aggressively increase positions accumulated near the lows.
Instead, this is where traders should begin protecting profits through partial exits.
━━━━━━━━━━━━━━━━━━━━━━━━━━━━━━━━━━
There is one important condition that still needs to be considered.
BTC is currently trading
▶ BELOW the 1M M-Signal.
This is important.
For a full-scale mid-to-long-term bullish trend to begin, simply touching the 1M M-Signal may not be enough.
Ideally, BTC needs to:
1. Break above the 1M M-Signal
2. Maintain price above the M-Signal
3. Confirm the M-Signal as support
Therefore, it may still be premature to conclude that
"ACCUMULATION IS COMPLETELY FINISHED."
━━━━━━━━━━━━━━━━━━━━━━━━━━━━━━━━━━
The current market structure can be summarized as follows:
Low-Price Accumulation
↓
1st High Reached
↓
Partial Profit-Taking Begins
↓
Test of the 1M M-Signal
↓
Breakout + Support Confirmation
↓
Potential Full Bullish Trend Expansion
This means:
▶ Short-term
→ BTC has entered a potential profit-taking zone.
▶ Mid-to-long-term
→ There may still be one final major buying opportunity.
━━━━━━━━━━━━━━━━━━━━━━━━━━━━━━━━━━
If you are day trading around the current price level, having a clearly defined stop-loss is essential.
Volatility can increase significantly near high-price zones.
Therefore, rather than chasing the price simply because BTC is moving higher, it is better to focus on:
▶ Breakout Confirmation
▶ Support Confirmation
▶ Clearly Defined Stop-Loss
These three conditions become increasingly important as BTC moves into higher resistance zones.
━━━━━━━━━━━━━━━━━━━━━━━━━━━━━━━━━━
The final major buying opportunity may appear after:
▶ BTC breaks above the 1M M-Signal
▶ Price successfully holds above it
Based on the current market structure,
★ KEY SUPPORT CANDIDATE : 73,499.86
The 73,499.86 level could become an important support decision point.
Therefore, if BTC moves toward or above 73,499.86, the important question is not simply:
"Did BTC break above it?"
The more important questions are:
▶ Can BTC hold above it?
▶ Can buyers absorb selling pressure?
▶ Can the bullish structure remain intact?
If BTC successfully breaks above 73,499.86 and converts it into support, the bullish trend could strengthen further.
━━━━━━━━━━━━━━━━━━━━━━━━━━━━━━━━━━
BTC's next major volatility period is expected around:
▶ August 28
However, ETH's next volatility period is expected around:
▶ August 27
This means that the BTC and ETH volatility windows may overlap.
Therefore,
★ AUGUST 26 ~ AUGUST 29 ★
could become an important period to watch closely.
During this period, pay particular attention to:
▶ Major Support / Resistance Breakouts
▶ Volume Changes
▶ StochRSI Direction
▶ OBV Buying Pressure
▶ BSSC Momentum Transition
━━━━━━━━━━━━━━━━━━━━━━━━━━━━━━━━━━
▶ 69,978.65
→ Low-Price Accumulation Zone
▶ 71,280.01
→ 1st High / Initial Profit-Taking Zone
▶ Current Strategy
→ Profit protection over aggressive accumulation
→ Consider partial profit-taking on core positions
→ Stop-loss management is essential for day trading
▶ 1M M-Signal
→ BTC is still trading below the M-Signal
→ Therefore, accumulation may not be completely finished
▶ 73,499.86
→ Potential major support-conversion level
→ The key is not just the breakout, but whether BTC can hold above it
▶ Final Major Buying Opportunity
→ Possible after BTC breaks above the 1M M-Signal and successfully holds above it
▶ Major Volatility Window
→ August 26 ~ August 29
━━━━━━━━━━━━━━━━━━━━━━━━━━━━━━━━━━
BTC has rallied from the low-price accumulation zone and entered its first high-price zone.
Therefore, from this point forward, the key question is shifting from:
"How much more should I buy?"
to:
"How should I protect my profits?"
However, BTC is still trading below the 1M M-Signal.
Therefore, from a mid-to-long-term perspective, it may still be too early to declare that the accumulation phase is completely over.
The key confirmation will ultimately be:
★ BREAK ABOVE THE 1M M-SIGNAL
+
★ HOLD ABOVE IT AS SUPPORT
If these conditions are confirmed, BTC may begin transitioning into a stronger bullish trend structure.
Also, pay close attention to the
★ AUGUST 26 ~ AUGUST 29 ★
volatility window.
The price action during this period could provide important clues about BTC's next major directional move.
━━━━━━━━━━━━━━━━━━━━━━━━━━━━━━━━━━
Thank you for reading.
I hope you have a successful trading journey.
THE KEY IS WHETHER PRICE CAN HOLD ABOVE 381.59
Hello, traders.
If you "Follow" me, you'll be able to stay updated with my latest market analysis and trading ideas.
I hope you have a great day and successful trading.
==================================================
■ ASCENDING CHANNEL BREAKDOWN — PREPARE FOR A POSSIBLE CORRECTION
Unfortunately, the price has broken down from the ascending channel and is currently showing a corrective move.
The most important level to watch at this stage is 381.59.
If the price fails to reclaim 381.59, there is a possibility of another decline toward the 299.29 area.
Therefore, traders should be prepared for this potential downside scenario.
▶ Break above 381.59 + successful support confirmation
→ Probability of bullish continuation increases
▶ Failure to break above 381.59
→ Possible retest of the 299.29 area
▶ Price holds above 299.29
→ Long-term bullish structure may remain intact
In other words, the short-term decline itself is not necessarily the most important factor.
What matters more is whether buying pressure emerges around 299.29 and establishes meaningful support.
==================================================
■ 1M CHART — KEY LEVELS THAT MAY DETERMINE THE MID- TO LONG-TERM TREND
As previously discussed on the 1M chart, the major price zones to watch are:
1st Support Zone : 268.07 ~ 311.48
2nd Key Zone : 346.45 ~ 381.59
The key question is whether the price can establish support within these zones and resume its upward movement.
For a more meaningful bullish trend to develop, the price needs to move above the M-Signal on the 1M chart and remain above it.
Therefore, the most important condition at this stage is:
Simply trading above 381.59 temporarily may not be enough.
After the breakout, even if a pullback occurs, the price should hold around 381.59 and resume its advance.
This would provide stronger confirmation that the previous resistance level has successfully flipped into support.
On the other hand, if the price fails to break above 381.59 — or breaks above it but quickly falls back below — confirmation of a bullish trend may be delayed.
In that case, the next key level to monitor will be around 299.29.
==================================================
■ KEY PRICE STRUCTURE
```
↑
BREAKOUT + SUPPORT
CONFIRMATION
│
346.45 ~ 381.59
│
KEY DECISION ZONE
│
↓
MAJOR SUPPORT TEST
│
268.07 ~ 311.48
↓
MID- TO LONG-TERM
SUPPORT ZONE
```
In summary,
381.59 is the key level for determining whether bullish momentum can strengthen,
while
299.29 is an important level for determining whether the long-term bullish structure remains intact.
==================================================
■ NEXT VOLATILITY WINDOW : AROUND SEPTEMBER 10–17
The next potential volatility period is expected around September 10.
However, another volatility period is also expected around September 17.
Therefore, rather than viewing these two dates separately, it may be more appropriate to monitor the entire period:
as a broader potential volatility window.
The important point is not to predict the direction of volatility in advance.
Instead, we need to observe where the price is positioned as the market moves through this volatility window.
▶ Holding above 381.59
→ Bullish structure may strengthen
▶ Trading within 346.45 ~ 381.59
→ Market may remain in a directional decision phase
▶ Correction toward 299.29
→ Long-term trend support needs to be confirmed
▶ Breakdown below 299.29
→ Support within 268.07 ~ 311.48 becomes increasingly important
==================================================
■ HOW WILL THE CURRENT OVERHEATED CONDITION BE RESOLVED?
Stock prices can experience temporary spikes in volatility due to factors outside the chart, including earnings, corporate announcements, changes in institutional flows, interest rates, government policies, and industry-specific developments.
However, once this temporary volatility subsides, price action is likely to realign with the broader technical structure defined by major support and resistance levels and the prevailing trend.
Therefore, rather than simply asking,
"Will the price continue to rise?"
the more important question is:
The market may cool down through a price correction.
Alternatively, it may consolidate sideways for a period of time and resolve the overheated condition through a time-based correction.
If the price eventually breaks above 381.59 and successfully converts it into support, the probability of a stronger bullish trend may increase.
However, if the breakout fails, we should monitor whether meaningful support develops around 299.29 before determining the next trading response.
==================================================
▶ Key Breakout Level : 381.59
▶ Bullish Confirmation : Break above 381.59 + successful support conversion
▶ Major Support Level : 299.29
▶ Mid- to Long-Term Support Zone : 268.07 ~ 311.48
▶ Key Resistance / Transition Zone : 346.45 ~ 381.59
▶ Potential Volatility Window : Around September 10 ~ September 17
---
Rather than trying to predict the market,
it is more important to observe how price reacts at key levels and respond accordingly.
Will the price break above 381.59 and successfully convert it into support?
Or will the market move lower and test support around 299.29 once again?
As we approach the upcoming volatility window, we need to closely monitor where the price establishes itself within this key price structure.
---
Thank you for reading.
I wish you successful trading.
WHY DID THE MARKET RALLY, AND HOW LONG CAN IT LAST?
Hello, traders.
If you follow me, you'll be able to stay updated with my latest market analysis.
I hope you have a successful trading day.
==================================================
==================================================
Looking at the current crypto market, these are probably the two biggest questions:
"Why exactly is the market going up?"
"And how long can this rally continue?"
Price action alone cannot fully answer these questions.
However, by tracking Money Flow into the crypto market, we can get a better idea of what is driving the current rally and how sustainable it may be.
--------------------------------------------------
--------------------------------------------------
USDT represents one of the most important sources of liquidity in the crypto market.
Therefore, for the entire market to transition into a strong and sustained bullish trend, we need to see more than just BTC moving higher.
One of the key signals to watch is:
"USDT GAP UP"
A strong increase in USDT may indicate that fresh liquidity is entering the crypto market.
In other words,
USDT GAP UP
↓
FRESH LIQUIDITY INFLOW
↓
CAPITAL ROTATION INTO BTC & CRYPTO
↓
HIGHER PROBABILITY OF A SUSTAINED BULLISH TREND
This is one of the most important factors to monitor when evaluating the current market structure.
--------------------------------------------------
--------------------------------------------------
At the moment, I believe the current crypto market rally is being driven more by USDC liquidity than by USDT.
The reason is that USDC has been showing a GAP UP structure.
This suggests that actual capital is flowing into the market and that the current rally is not simply a price movement without liquidity support.
However, there is an important distinction.
USDC generally has less influence on the overall crypto market than USDT.
Therefore, I believe the current capital inflow should be interpreted more as:
"SHORT-TERM BULLISH LIQUIDITY"
rather than:
"MAJOR LIQUIDITY EXPANSION FOR A LONG-TERM BULL MARKET"
For now, I believe it is more appropriate to approach the current move as:
"SHORT-TERM BULLISH MOMENTUM"
rather than assuming that a full-scale Bull Market has already begun.
==================================================
==================================================
From my perspective, the current bullish wave is getting close to an important short-term target area.
The most important resistance zone I am currently watching is:
79,687.72 ~ 81,447.01
I believe there is a high probability that BTC will encounter significant resistance and increasing selling pressure around this area.
--------------------------------------------------
--------------------------------------------------
The first reason is StochRSI.
StochRSI has already entered the Overbought zone.
However, an Overbought StochRSI does NOT automatically mean that price must decline.
During a strong bullish trend, StochRSI can remain Overbought while price continues moving higher.
Therefore, StochRSI alone should never be used as a sell signal.
This is where OBV becomes important.
Currently, the distance between the OBV Low Line and High Line is relatively narrow.
In my view, this suggests that Buying Pressure may not be as strong as it was during previous bullish moves.
In other words,
StochRSI = OVERBOUGHT
+
OBV = BUYING PRESSURE WEAKENING
+
79.7K ~ 81.4K = MAJOR RESISTANCE
These three conditions are beginning to converge.
Therefore,
79,687.72 ~ 81,447.01
should not simply be viewed as a price target.
I believe it should also be treated as:
"AN IMPORTANT PROFIT-PROTECTION ZONE"
--------------------------------------------------
--------------------------------------------------
If BTC successfully breaks through the 79,687.72 ~ 81,447.01 resistance zone with strong momentum, the next important level to watch is:
89,294.25
However, based on the current Money Flow and indicator structure, if BTC reaches the 89,294.25 area, I believe the probability of a sharp correction may increase significantly.
Therefore, my current scenario is:
79.7K ~ 81.4K
↓
FIRST MAJOR RESISTANCE
SUCCESSFUL BREAKOUT
↓
89.3K AREA
↓
POTENTIAL HIGH VOLATILITY
↓
RISK OF A SHARP CORRECTION
However, there is one major variable that could completely change this scenario.
That variable is:
"USDT"
==================================================
==================================================
If USDT begins showing a strong GAP UP trend while BTC is approaching these major resistance levels, the market structure could change dramatically.
A significant expansion in USDT liquidity could provide enough buying power for BTC to break through:
79.7K ~ 81.4K
and even:
89.3K
with much stronger momentum than currently expected.
Therefore, from this point forward, watching BTC price alone may not be enough.
We need to monitor:
"BTC + USDT MONEY FLOW"
together.
Price is the result.
Liquidity is what drives the move.
==================================================
==================================================
If BTC encounters resistance around 79,687.72 ~ 81,447.01 and a correction begins, the most important question will no longer be:
"How far will BTC fall?"
The more important question will be:
"Where will BTC find support?"
The key level to monitor will be the:
1M M-Signal
If BTC finds support around the 1M M-Signal and continues trading above it after the correction, the current rally may develop from a short-term bullish move into a much larger medium-to-long-term bullish structure.
The sequence to watch is:
MAJOR RESISTANCE
↓
PRICE CORRECTION
↓
1M M-SIGNAL TEST
↓
SUCCESSFUL SUPPORT
↓
BULLISH STRUCTURE STRENGTHENS
↓
HIGHER PROBABILITY OF A MAJOR UPTREND
==================================================
==================================================
If BTC successfully establishes a stable bullish structure, attention may begin shifting toward altcoins.
For a broader Altcoin Market rally to begin, I am watching two major conditions.
1. BTC.D
BTC Dominance needs to fall below 55.01 and remain below it,
or
continue trending downward after breaking below 55.01.
2. USDT.D
USDT Dominance needs to fall below 4.915 and remain below it,
or
continue trending downward after breaking below 4.915.
BTC.D ↓
+
USDT.D ↓
↓
LOWER BTC MARKET DOMINANCE
+
CAPITAL MOVING OUT OF STABLECOINS
↓
HIGHER PROBABILITY OF CAPITAL ROTATION INTO ALTCOINS
If both conditions are satisfied, the market environment may become favorable for a broad Altcoin rally.
However, an Altseason does not necessarily mean that every altcoin will pump at the same time.
In most cases, the market moves through:
"SECTOR ROTATION + ROTATIONAL PUMPING"
For example,
COIN A PUMPS
↓
COIN B PUMPS
↓
COIN C PUMPS
↓
CAPITAL ROTATES INTO ANOTHER SECTOR
This rotation can continue across different sectors and narratives.
Therefore, if you already hold fundamentally or technically selected positions, constantly chasing whichever coin is pumping may not be the best strategy.
Instead, it may be more effective to manage your position size around major support zones and wait for liquidity to rotate into your holdings.
"DO NOT CHASE THE PUMP.
POSITION YOURSELF BEFORE THE LIQUIDITY ARRIVES."
==================================================
==================================================
The next important volatility window is expected around:
AUGUST 28
Therefore, we need to monitor whether the market structure begins changing around this period.
However, this is not the only important timing window.
Another major volatility window is expected around:
SEPTEMBER 5 ~ SEPTEMBER 10
The sequence may therefore look like:
AROUND AUGUST 28
↓
FIRST VOLATILITY EXPANSION
↓
SEPTEMBER 5 ~ 10
↓
SECOND VOLATILITY EXPANSION
September could become particularly important.
The crypto market often experiences significant trend changes beginning around October.
Therefore, I believe the price range and volatility structure formed during September could play an important role in determining the medium-to-long-term market direction.
==================================================
==================================================
From a long-term perspective, I continue to monitor the possibility that a much stronger bullish trend could begin next year.
Of course, the strength of that rally will ultimately depend on how much fresh liquidity enters the crypto market.
Based on the current market structure, the long-term BTC targets I am watching are:
TARGET 1 : 133K
TARGET 2 : 178K
However, the targets themselves are not the most important factor.
The more important question is:
"WHAT TYPE OF CAPITAL IS DRIVING THE RALLY?"
USDC-LED LIQUIDITY
→ SHORT-TERM BULLISH MOMENTUM
STRONG USDT LIQUIDITY EXPANSION
→ POTENTIAL MARKET-WIDE LIQUIDITY EXPANSION
BTC HOLDS THE 1M M-SIGNAL AFTER A CORRECTION
→ MEDIUM-TO-LONG-TERM BULLISH STRUCTURE CONFIRMATION
BTC.D + USDT.D DECLINE TOGETHER
→ HIGHER PROBABILITY OF ALTCOIN ROTATION
==================================================
==================================================
The market is currently moving higher.
However, I do not believe we should immediately conclude that:
"A FULL-SCALE BULL MARKET HAS ALREADY STARTED."
At this stage, the market appears to be showing short-term bullish momentum primarily supported by USDC liquidity.
CURRENT MAJOR BTC RESISTANCE
→ 79,687.72 ~ 81,447.01
NEXT MAJOR LEVEL AFTER BREAKOUT
→ 89,294.25
KEY LEVEL TO WATCH AFTER A CORRECTION
→ 1M M-Signal
CONDITION FOR A STRONGER MARKET-WIDE UPTREND
→ USDT GAP UP
CONDITIONS FOR ALTCOIN MARKET EXPANSION
→ BTC.D < 55.01
→ USDT.D < 4.915
NEXT MAJOR VOLATILITY WINDOWS
→ AROUND AUGUST 28
→ SEPTEMBER 5 ~ 10
LONG-TERM BTC TARGETS
→ 133K
→ 178K
Ultimately, the most important question from here is not:
"HOW MUCH HIGHER CAN BTC GO?"
The more important question is:
"IS THIS RALLY BEING DRIVEN BY SHORT-TERM CAPITAL,
OR
IS NEW LONG-TERM LIQUIDITY ENTERING THE MARKET TO CREATE THE NEXT BULL MARKET?"
Rather than trying to predict every price move,
FOLLOW THE MONEY FLOW.
Rather than chasing price,
WATCH HOW THE MARKET REACTS AT MAJOR SUPPORT AND RESISTANCE LEVELS.
Markets ultimately move in the direction of liquidity.
---
Thank you for reading.
I wish you successful trading. Can Trend Lines Be Used to Estimate Volatility Windows???
Hello, traders.
If you follow me, you can always get new updates quickly.
I hope you have a great day and successful trading.
━━━━━━━━━━━━━━━━━━━━━━━━━━━━━━━━━━
Trend lines are one of the most basic tools in technical analysis.
But there is an important question:
"What can we actually learn from a trend line?"
When traders first begin studying technical analysis, they usually start with Moving Averages.
After that, their studies often move in one of two directions:
1. Indicator-based analysis
2. Wave and Market Structure analysis
It is difficult to say that one approach is necessarily better or faster than the other.
Both can provide meaningful information.
However, after years of analyzing charts, I believe the real question is not how many indicators or theories you know.
The real question is:
"Can you turn your chart analysis into an actual Trading Strategy?"
━━━━━━━━━━━━━━━━━━━━━━━━━━━━━━━━━━
Looking back, I believe technical analysis becomes much more practical once you can identify important Support and Resistance levels from the candle structures of the 1M, 1W, and 1D charts.
Once those levels are identified, the next step is to build a Trading Strategy around them.
Therefore, the key questions are:
▶ Where should Support / Resistance levels be drawn?
▶ What role does each Support / Resistance level play?
▶ How can StochRSI be used to identify changes in Momentum?
▶ Can Trend Lines and major Support / Resistance levels be used together to estimate Volatility Windows?
Understanding these relationships as quickly as possible is one of the most important parts of practical technical analysis.
Ultimately, all of these elements should lead to one thing:
A Trading Strategy.
━━━━━━━━━━━━━━━━━━━━━━━━━━━━━━━━━━
Several trend lines are currently drawn on the chart.
From these trend lines, we can see that the probability of a new Wave developing is increasing.
However, there is something even more important.
■ VOLATILITY WINDOW
Based on the current trend-line structure,
▶ Around the week containing October 16, 2026
could become an important Volatility Window.
This does NOT mean that the market must experience a massive pump or dump during that period.
The important point is that:
"The probability of a new directional move or Trend transition may increase around this period."
Therefore, instead of trying to predict whether price will rise or fall, we should prepare Trading Scenarios based on where price is positioned relative to important Support and Resistance levels when the market enters this Volatility Window.
━━━━━━━━━━━━━━━━━━━━━━━━━━━━━━━━━━
The most important price zone currently is:
▶ 2419.83 ~ 2706.15
This is a major Resistance Zone that price needs to break above before a stronger bullish trend can develop.
2419.83 ~ 2706.15 Breakout
↓
Resistance → Support Flip
↓
Bullish Momentum Holds
↓
Probability of a Stronger Uptrend Increases
Therefore, simply touching or briefly moving above this zone is not enough.
The important question is:
"Can price break above this zone and successfully convert it into Support?"
━━━━━━━━━━━━━━━━━━━━━━━━━━━━━━━━━━
The StochRSI is currently approaching the Overbought Zone.
This means short-term upside Momentum may become limited, and the probability of a Pullback may gradually increase.
However, there is another indicator that must be monitored together with StochRSI.
▶ OBV
If OBV breaks above the High Line, it may indicate that strong Buying Pressure is entering the market.
In other words:
StochRSI = OVERBOUGHT
+
OBV = HIGH LINE BREAKOUT & HOLD
If this structure develops, price may continue to rise even while StochRSI remains Overbought.
Strong Buying Pressure can sometimes force the market higher despite technically overheated Momentum.
■ KEY CHECK POINTS
▶ Can OBV break above the High Line?
▶ Can OBV remain above the High Line after the breakout?
If OBV fails to break and hold above the High Line, the probability of failing to fully break through the 2419.83 ~ 2706.15 Resistance Zone may increase.
Therefore, we need to prepare for that scenario as well.
━━━━━━━━━━━━━━━━━━━━━━━━━━━━━━━━━━
Looking again at the 1D chart, we can see a shorter-term Trend Line structure.
Based on this structure,
▶ Next Major Volatility Window : Around August 27
This period may become an important decision point for the short-term market structure.
The most important level to monitor around August 27 is:
▶ 2419.83
━━━━━━━━━━━━━━━━━━━━━━━━━━━━━━━━━━
CASE 1.
Price Holds Above 2419.83
↓
Support Confirmed
↓
OBV Holds Above High Line
↓
Probability of Bullish Continuation Increases
CASE 2.
Price Fails to Hold 2419.83
↓
StochRSI Overbought Condition Begins to Cool
↓
Probability of Price Correction Increases
↓
Possible Retest Around 2111.42
Therefore, the key question around the August 27 Volatility Window is:
"Can price remain above 2419.83?"
If price fails to hold this level,
▶ 2111.42
could become the next important downside level to monitor.
━━━━━━━━━━━━━━━━━━━━━━━━━━━━━━━━━━
StochRSI is currently positioned in the Overbought Zone.
At the same time, OBV is moving above the High Line, suggesting strong Buying Pressure.
Therefore, the current structure can be summarized as:
StochRSI : OVERBOUGHT
OBV : STRONG BUYING PRESSURE
These two conditions can exist at the same time.
As long as strong Buying Pressure continues, price can keep rising even while StochRSI remains Overbought.
However, Overbought Momentum cannot remain overheated forever.
Eventually, the market may need to cool down through either:
▶ Price Correction
or
▶ Time Correction / Consolidation
Therefore, the most important question is NOT:
"Will a correction happen?"
■ THE MORE IMPORTANT QUESTION IS:
"Where will price find Support after the correction?"
━━━━━━━━━━━━━━━━━━━━━━━━━━━━━━━━━━
Trend lines are traditionally used to identify changes in market direction.
However, I do not use Trend Lines only to determine whether the market is moving up or down.
By combining:
Trend Line
+
StochRSI Momentum
+
Support / Resistance
+
OBV Buying Pressure
we may be able to estimate periods when the probability of a market structure change increases.
These periods can be viewed as:
▶ VOLATILITY WINDOWS
Of course,
"Volatility Window = Guaranteed Pump or Dump"
is NOT correct.
A Volatility Window is not a date that predicts the future price.
■ THE REAL MEANING OF A VOLATILITY WINDOW
It is a period when we should closely monitor whether:
"The existing Trend will continue,
or
a new Trend will begin."
━━━━━━━━━━━━━━━━━━━━━━━━━━━━━━━━━━
The purpose of technical analysis is not to perfectly predict future prices.
What matters is identifying:
▶ Where is Support?
▶ Where is Resistance?
▶ Has a Breakout occurred?
▶ Did Resistance successfully flip into Support?
▶ Is Momentum being maintained?
▶ Is Buying Pressure actually increasing?
▶ When is the next Volatility Window?
And then preparing a Trading Strategy for each possible outcome.
━━━━━━━━━━━━━━━━━━━━━━━━━━━━━━━━━━
Traditional technical analysis often focuses on one question:
"Where will price go next?"
However, I believe practical technical analysis should focus on a different question:
"What will I do when price moves?"
Prediction < Response
Forecast < Strategy
■ GOOD CHART ANALYSIS SHOULD BECOME A TRADING STRATEGY.
We need a strategy for:
Price moving higher,
Price moving lower,
A successful Breakout,
A failed Breakout,
A Support Hold,
A Support Breakdown,
and a possible Trend transition around a Volatility Window.
The goal is not to predict every market move.
The goal is to be prepared before the market moves.
━━━━━━━━━━━━━━━━━━━━━━━━━━━━━━━━━━
▶ Major Resistance Zone
2419.83 ~ 2706.15
▶ Key Support / Decision Level
2419.83
▶ Downside Check Point
2111.42
▶ Short-Term Volatility Window
Around August 27
▶ Mid-Term Volatility Window
Around the week of October 16, 2026
▶ StochRSI
Overbought Zone
→ Watch for limited upside Momentum or a Correction
▶ OBV
High Line Breakout & Hold
→ Confirmation of Strong Buying Pressure
▶ Key Market Structure
Breakout alone is not enough.
What matters is whether Resistance successfully flips into Support.
━━━━━━━━━━━━━━━━━━━━━━━━━━━━━━━━━━
Chart analysis is not about predicting the future perfectly.
It is about building a Trading Strategy that allows us to respond to future price movements.
Chart Analysis
↓
Market Structure
↓
Volatility Window
↓
Trading Scenario
↓
Trading Strategy
Chart Analysis should ultimately become Trading Strategy.
I believe this is the direction practical technical analysis needs to move toward.
---
Thank you for reading.
I wish you successful trading.
 Education
XRP : SUPPORT AT 1.1237 IS THE KEY
Hello, traders!
If you "Follow", you'll be able to catch my latest market updates quickly.
I hope you have a successful trading day.
---
---
##
XRP has moved above 1.1475 and is attempting to rebound from its short-term bottom area.
However, the current move alone is not enough to confirm a trend reversal.
The most important question in the current price structure is:
> > > CAN XRP ESTABLISH SUPPORT AROUND 1.1237? <<<
In other words, we need to see the following sequence:
1.1475 Breakout
→ Support confirmation around 1.1237
→ Bullish structure remains intact
Whether this structure develops will be the first key point to watch.
---
##
If XRP successfully establishes support around 1.1237, the next important zone to watch is:
> > > 1.3524 ~ 1.3979 <<<
If price moves into this zone and then successfully holds it as support, bullish momentum could strengthen further.
The potential bullish roadmap would therefore look like this:
1.1237 Support
↓
1.3524 ~ 1.3979 Reclaim & Support
↓
1.5 ~ 1.9669 Breakout Attempt
---
##
The most important zone in the broader price structure is:
> > > 1.5 ~ 1.9669 <<<
This is the major resistance zone XRP ultimately needs to break through in order to strengthen its mid-to-long-term bullish structure.
Therefore, rather than focusing only on a rebound from 1.1237, we need to see whether XRP can build a step-by-step bullish structure:
1.1237 Support
→ 1.3524 ~ 1.3979 Breakout & Support
→ 1.5 ~ 1.9669 Breakout
---
##
1.1237
→ Key support required to maintain the current rebound structure
1.3524 ~ 1.3979
→ Next Reclaim & Support zone
→ Important price area associated with the 1M M-Signal
1.5 ~ 1.9669
→ Major Resistance Zone for a mid-to-long-term bullish transition
Below 0.93
→ Major Accumulation Decision Zone from a mid-to-long-term investment perspective
---
##
As XRP moved below 1.5, the probability of entering a mid-to-long-term investment area increased.
In particular, if XRP declines below
> > > 0.93 <<<
it would enter an important mid-to-long-term accumulation decision area.
Therefore, for the current rebound to become meaningful, XRP first needs:
> > > 1.1237 SUPPORT CONFIRMATION <<<
---
##
If you are looking to trade XRP, rather than chasing the price higher, it may be better to focus on:
> > > WHETHER XRP CAN HOLD AROUND 1.1237 AS SUPPORT <<<
If XRP establishes support around 1.1237 and buying pressure begins to strengthen, a short-term trading opportunity may develop.
On the other hand:
1.1237 Support Failure
→ Short-term bullish structure weakens
→ Probability of another downside move increases
Therefore, price action around 1.1237 should be watched closely.
---
##
On the 1M chart, it is important for price to remain above the M-Signal indicator.
Based on the current structure, the most likely area for this appears to be:
> > > 1.3524 ~ 1.3979 <<<
Therefore, simply breaking above this zone may not be enough.
What matters is whether XRP can complete the full confirmation process:
Breakout
→ Support Flip
→ Hold
A confirmed support flip would provide a much stronger signal than a simple breakout.
---
##
Even if the current rally continues, the situation could change significantly if XRP fails to break through:
> > > 1.5 ~ 1.9669 <<<
If XRP faces strong rejection from this zone, the probability of eventually re-entering the mid-to-long-term investment area could increase.
Therefore, around 1.5 ~ 1.9669, traders should not focus only on further upside.
A
> > > PROFIT PROTECTION <<<
strategy should also be prepared.
Protecting profits through partial profit-taking and active position management may become increasingly important as price approaches this major resistance zone.
---
##
1.1237
│
│ Support?
▼
1.3524 ~ 1.3979
│
│ Reclaim + Hold?
▼
1.5 ~ 1.9669
│
├─ Breakout + Support
│ → Mid-to-long-term bullish structure strengthens
│
└─ Rejection
→ Higher probability of re-entering
the mid-to-long-term investment area
---
##
The first and most important thing to watch for XRP is:
> > > SUPPORT AT 1.1237 <<<
If XRP successfully holds 1.1237, the next upside zone to watch is:
> > > 1.3524 ~ 1.3979 <<<
If XRP breaks above this zone and successfully converts it into support, the next major gateway will be:
> > > 1.5 ~ 1.9669 <<<
Ultimately, the key question that could determine XRP's mid-to-long-term direction is:
"CAN XRP BREAK ABOVE 1.5 ~ 1.9669
AND FLIP THIS ZONE INTO SUPPORT?"
If the breakout fails, the possibility of XRP re-entering the mid-to-long-term investment area should remain on the table.
For that reason, a profit-protection strategy should be prepared in advance.
---
Thank you for reading.
I wish you successful trading.
BNB : What is the very important point???
BNB: What Is the Most Important Level from a Mid- to Long-Term Perspective???
---------------------------------------------------------------------
Hello, traders.
If you "Follow" me, you can always get the latest updates quickly.
Have a great day, and I wish you successful trading.
=====================================
The first key zone to watch for BNB is:
▶ 620.0 ~ 656.54
A recent bottom structure has formed across this range.
Therefore, whether BNB can hold this zone as support and move higher will be critical for maintaining its mid- to long-term bullish structure.
The M-Signal indicator on the 1M chart is currently passing near:
▶ 656.54
Therefore, the following price action will be important:
▶ Breakout above 656.54
▶ Price holds above 656.54
▶ 656.54 is successfully converted into support
If this structure develops, the probability of a stronger bullish trend beginning may increase significantly.
In other words:
However, simply breaking above 656.54 does not immediately confirm a strong bullish trend.
The 1M HA-High is currently located near:
▶ 715.19
The HA-High may act as a major resistance level during an upward move.
Therefore, we need to closely watch whether the following structure develops:
656.54 Reclaim
↓
Attempt to Break Above 715.19
↓
Confirm Support Above 715.19
If BNB breaks above 715.19 and successfully flips it into support, mid- to long-term bullish momentum could strengthen further.
On the other hand, if the price falls below 620.0, we should prepare for additional downside rather than focusing on the bullish scenario.
If 620.0 breaks down, the major support levels to watch are:
1st : 604.60
2nd : 583.60
3rd : 533.90
At each level, we need to monitor:
▶ Whether selling pressure is weakening
▶ Whether a support structure is forming
▶ Whether trading volume is increasing
▶ Whether bullish momentum begins to recover
If BNB falls below 620.0, there is a possibility that the market could enter a stair-step decline rather than experiencing only a temporary correction.
In other words:
620.0 Breakdown
↓
604.60
↓
583.60
↓
533.90
Support tests could continue sequentially through these levels.
If this type of price action develops, BNB may enter another accumulation phase.
In particular:
▶ 533.90
is a very important lower boundary from a mid- to long-term perspective.
If the price falls below 533.90, BNB may move beyond a simple short-term correction or accumulation zone and enter:
Therefore, before the price actually reaches this area, it would be better to prepare a strategy for how to build a mid- to long-term position.
The most important price level for BNB right now is:
▶ 656.54
Since the M-Signal on the 1M chart is passing near this level, 656.54 represents a major decision point for the mid- to long-term trend.
Therefore, if you are considering trading BNB from a short-term or longer investment perspective, it will be important not to miss the opportunity if:
is confirmed.
A temporary move above 656.54 is not enough.
What matters more is whether the price can remain above 656.54 after the breakout and successfully confirm it as support.
If support is confirmed at 656.54 and the bullish move continues, the next target levels are:
1st Target : 751.19
2nd Target : 1,088.90
However, reaching a target level does not automatically mean that the price will continue higher.
At each target zone, we need to monitor:
▶ Breakout confirmation
▶ Support flip confirmation
▶ Changes in trading volume
▶ Whether bullish momentum remains intact
656.54 Breakout
↓
656.54 Support Flip
↓
715.19 HA-High Breakout
↓
751.19
↓
1,088.90
620.0 Breakdown
↓
604.60
↓
583.60
↓
533.90
↓
Potential Entry into the Mid- to Long-Term Investment Zone
The key level for determining BNB's mid- to long-term direction is:
▶ 656.54
If BNB breaks above 656.54 and successfully flips it into support, the probability of a full-scale mid- to long-term bullish trend beginning could increase significantly.
However, the following three levels should also be monitored closely:
▶ 715.19 : 1M HA-High Breakout Gate
▶ 620.0 : Critical Lower Support
▶ 533.90 : Key Threshold for the Mid- to Long-Term Investment Zone
Ultimately, the most important question in the current market structure is not:
"Did BNB break above 656.54?"
but rather:
"After breaking above 656.54, did BNB successfully flip it into support?"
Breaking above an important price level and successfully converting that level into support are two very different things.
Therefore, rather than predicting the market direction too early, it is important to respond to the actual price action by confirming changes in support and resistance.
*
Thank you for reading.
I hope you have successful trading.
What Is the Most Important Level at the Current Price???
Hello, traders.
If you follow me, you'll be able to receive new market updates and analysis quickly.
I hope you have a successful trading day.
================================================================
===================================================
The most important price level to watch right now is:
▶ 229,500
Whether price can hold above this level as support could play an important role in determining the next major direction.
More importantly, 229,500 corresponds to the HA-High level on the 1M chart.
Therefore, rather than viewing 229,500 simply as an important support level, I believe it is better to approach it from the following perspective:
▶ Hold above 229,500 → Bullish momentum may continue
▶ Break below 229,500 → Lower support levels may be tested
Since this is a higher-timeframe HA-High zone, it should also be treated as a high-price area rather than a primary accumulation zone.
================================================================
========================================================
The major support and resistance levels on the 1D chart are marked with horizontal lines.
If price falls below 229,500, the next important level to watch is:
▶ Around 207,000
We need to see whether price can establish support around 207,000.
If 207,000 fails to hold and price continues lower, a stop-loss should be considered.
The reason is that the decline would be developing from a high-price zone rather than from a major accumulation zone.
In simple terms:
229,500 Breakdown
↓
207,000 Support Test
↓
Support Holds → Watch for a Rebound
Support Fails → Stop-Loss / Risk Reduction
If price continues higher, the next major area to watch is:
▶ 310,500 ~ 321,500
At this zone, the important question is not simply whether price can break through it.
We also need to see whether the zone can be converted into support after the breakout.
The reason is that StochRSI has already entered the overbought region.
An overbought StochRSI does not necessarily mean that the uptrend is about to end.
However, it does indicate that upside momentum may become constrained and that the probability of a short-term pullback or profit-taking may increase.
For price to continue rising while StochRSI remains overbought, strong buying pressure will be required.
Eventually, some form of price consolidation or pullback may be needed to cool down the overheated StochRSI.
Therefore, the ideal structure would be:
▶ Break above 310,500 ~ 321,500
▶ Pullback
▶ Confirm support
▶ Resume the uptrend
================================================================
======================================
The major HA-High levels are currently located around:
▶ 1M HA-High : 229,500
▶ 1W HA-High : 310,500
▶ 1D HA-High : 321,500
This means that several major higher-timeframe resistance zones are positioned above the current price structure.
For the bullish trend to strengthen, price needs to break through these high-price zones one by one and convert them into support.
================================================================
=======================================================
One of the most important indicators to watch during this move is OBV.
The key question is:
▶ Can the OBV channel between the Low Line and High Line transition into a rising channel?
If OBV continues to rise and eventually breaks above the High Line together with price, it may indicate that stronger buying pressure is entering the market.
On the other hand, if price continues higher while OBV fails to confirm the move, the reliability of the rally may weaken.
================================================================
============================================
A new major bullish wave is likely to begin when price successfully breaks above:
▶ 334,000 ~ 360,500
However, before reaching that point, the more important question is how price moves through the high-price zones below it.
229,500
↓
310,500
↓
321,500
↓
334,000 ~ 360,500
Rather than seeing only temporary breakouts, I would prefer to see the following structure:
▶ Breakout
▶ Pullback
▶ Support Confirmation
▶ Continuation Higher
This type of price action would provide stronger confirmation that the bullish trend is developing.
================================================================
==============================================
Looking at the chart in greater detail, price touched approximately 287,000 and then pulled back.
Price is now trading near:
▶ 268,500
This area corresponds to the previous HA-High level on the 1W chart.
Therefore, the key short-term zone to monitor is:
▶ 268,500 ~ 287,000
The important question is whether price can establish support within this range and resume the upward move.
================================================================
=========================================
StochRSI is currently in the overbought region.
Therefore, the probability of limited upside momentum or a short-term correction is increasing.
However, StochRSI should not be used alone to determine whether the bullish trend has ended.
We also need to monitor:
▶ BSSC : Holding above the zero line
▶ OBV : Continuing to rise
▶ OBV High Line : Breakout confirmation
If BSSC remains above zero while OBV continues rising and eventually breaks above its High Line, strong buying pressure may allow the bullish trend to continue even while StochRSI remains overbought.
Therefore, the following combination is important:
+
+
These indicators should be evaluated together rather than independently.
================================================================
=========================================
If price fails to hold the current area and continues lower, the next important support zone is:
▶ 251,000 ~ 261,500
This area is important because Fibonacci levels from both sides overlap around this range.
We need to monitor whether buyers step in and establish support.
If this zone also fails to hold, a stop-loss or further risk reduction should be considered.
Again, the reason is that the decline would be occurring from a high-price zone.
================================================================
=============================================
HA-High and DOM(60) represent areas where profit protection should generally take priority over building a new medium- or long-term position.
Therefore, these areas are more suitable for:
▶ Scalping
▶ Day Trading
▶ Scaling Out
▶ Profit Protection
If you are not comfortable with short-term trading, staying on the sidelines may be the better choice.
HA-Low and DOM(-60) represent areas where traders can consider building their main position after confirming support.
These areas can therefore be approached from the perspective of:
▶ Scaling In
▶ Building a Core Position
▶ Short-Term or Longer-Term Positioning
================================================================
===============================================
My preferred approach is to build a core position gradually around HA-Low and DOM(-60).
When price reaches HA-Low or DOM(-60), I first monitor whether support is forming.
If support is confirmed, I begin accumulating.
Instead of deploying all available capital at once, I divide the position into several entries.
HA-Low / DOM(-60)
↓
Support Confirmation
↓
First Entry
↓
Price Rises
↓
Another Pullback
↓
HA-Low / DOM(-60) Retest
↓
Support Confirmation
↓
Additional Entry
By repeating this process, the core position can gradually be built.
================================================================
=========================================
Deploying all available capital in a single entry requires an extremely strong setup.
For example, price may be rebounding from a major long-term support zone or recovering after an unusually sharp sell-off.
However, even a very strong support zone cannot guarantee that the absolute bottom has been reached.
Going all-in at a single price therefore exposes the trader to unnecessary risk.
Instead, I believe it is safer to gradually scale into the position whenever price reaches:
▶ HA-Low
▶ DOM(-60)
and confirms support.
================================================================
==================================================================
If accumulation is successful and the bullish trend develops, price will eventually move away from HA-Low and DOM(-60).
At some point, it will begin approaching:
▶ HA-High
▶ DOM(60)
When that happens, the priority should shift from accumulation to profit protection.
Even if price establishes support around HA-High or DOM(60) and continues higher, new medium- or long-term buying should generally be avoided.
Instead, these zones are better suited for scalping or day trading, with profits being realized along the way.
If price begins to reject or decline from HA-High or DOM(60), the core position should also be gradually reduced to protect profits.
The reason is simple:
▶ HA-High and DOM(60) represent high-price zones.
================================================================
=====================================================================
When price continues to rise, traders naturally begin expecting even higher prices.
However, markets rarely move exactly as we expect.
Instead of thinking:
"It will probably go higher."
It is more important to ask:
"What is the chart actually showing right now?"
When price enters a high-price zone, scaling out and protecting existing profits should become part of the trading process.
Over the long run, protecting profits can be just as important as identifying the perfect entry.
================================================================
=============================================================
Paying too much attention to the average entry price displayed by your exchange or brokerage can sometimes restrict your ability to manage positions effectively.
I prefer to separate:
▶ Core Position Average Entry
▶ Day-Trading Position Average Entry
The average entry price of the core position should remain an important reference.
However, temporary changes in the displayed average price caused by short-term trades do not need to dominate your decision-making.
What matters more is understanding:
▶ Where the core position was accumulated
▶ Where short-term positions were added
▶ Where profits should be realized
================================================================
========================================
This brings us back to 229,500.
There is no doubt that 229,500 is an important level within the current market structure.
However, one important fact should not be forgotten:
▶ 229,500 = 1M HA-High
In other words, 229,500 represents a high-price zone on the monthly chart.
Therefore, even though it is an important level, it should not automatically be treated as a core accumulation zone.
Around 229,500, the preferred approach is:
▶ Monitor Support
▶ Scalping
▶ Day Trading
▶ Profit Protection
Meanwhile, the current DOM(-60) level is located around:
▶ 207,000
Therefore, positions accumulated around 207,000 after support confirmation can be classified as part of the core position.
================================================================
======================
▶ 207,000
DOM(-60)
Potential Core Accumulation Zone
▶ 229,500
1M HA-High
Critical Trend Decision Level
Primarily Scalping / Day-Trading Territory
▶ 251,000 ~ 261,500
Fibonacci Confluence Support Zone
Watch for Support During a Pullback
▶ 268,500
Previous 1W HA-High
Current Short-Term Support Reference
▶ 268,500 ~ 287,000
Current Short-Term Decision Zone
Watch for Support and Bullish Continuation
▶ 310,500
1W HA-High
High-Price Resistance / Profit-Protection Zone
▶ 321,500
1D HA-High
High-Price Resistance
Watch for Breakout and Support Conversion
▶ 334,000 ~ 360,500
Major Breakout Zone
Potential Starting Point of a New Bullish Wave
================================================================
=================
Accumulate in low-price zones.
Protect profits in high-price zones.
HA-Low / DOM(-60)
→ Confirm Support
→ Scale Into the Core Position
HA-High / DOM(60)
→ Protect Profits
→ Scale Out
→ Focus on Scalping / Day Trading
An overbought StochRSI alone does not automatically mean "SELL."
We also need to determine:
▶ Is BSSC holding above zero?
▶ Is OBV rising?
▶ Can OBV break above the High Line?
Ultimately, the goal is not to predict every market move.
The goal is to apply the appropriate trading strategy based on where price is currently located within the market structure.
When the chart shows a low-price zone, prepare for accumulation.
When the chart shows a high-price zone, focus on protecting profits.
And most importantly:
"Instead of trying to catch the exact bottom or top with a single trade, manage market uncertainty through scaling in and scaling out."
This is one of the most effective ways to reduce risk and remain consistent over the long term.
---
Thank you for reading.
I wish you successful trading.
Time to Focus on Bitcoin's Volatility Window
Hello, traders.
If you follow me, you'll be able to receive new market analyses as quickly as possible.
Wishing you successful trading today.
============================================================
■ ETH VOLATILITY WINDOW
=======================
Ethereum's current Volatility Window is expected to
come to an end around August 13.
The next major ETH Volatility Window is expected around:
▶ August 27
============================================================
■ NOW IT'S TIME TO FOCUS ON BTC
===============================
Once Ethereum's Volatility Window comes to an end,
the next major event to watch will be Bitcoin's Volatility Window.
▶ BTC Major Volatility Window
Around August 18
(August 17 - 19)
Therefore, we need to closely monitor how BTC establishes
its next directional move around this period.
---
##
● StochRSI
StochRSI is currently approaching the oversold region.
This suggests that downside momentum may begin to weaken,
increasing the possibility of a short-term Technical Rebound.
However, entering the oversold region alone is not enough
to confirm a bullish reversal.
● OBV
OBV is currently trending downward.
Therefore, it is still difficult to confirm
that strong buying pressure is entering the market.
● BSSC
BSSC has also fallen below the zero line.
In other words,
▶ Selling Pressure is still stronger than Buying Pressure.
============================================================
■ WHERE WILL SELLING PRESSURE BE ABSORBED?
==========================================
The most important question right now is:
"At what price level will the market absorb the selling pressure
and establish a support structure?"
▶ First Support : 62,793.20
▶ Second Support : 61,299.80
In particular,
▶ 62,793.20
is an important level where the previous HA-Low was formed.
Therefore, if BTC finds support around this level
and buying pressure begins to increase,
the probability of another bullish move may increase.
============================================================
■ WHAT DOES BTC NEED FOR A BULLISH REVERSAL?
============================================
For BTC to transition into a stronger bullish trend,
price needs to move above:
▶ 66,323.12
↓
▶ Hold above 66,323.12
↓
▶ Resistance → Support Flip
At the same time,
the following conditions should also be confirmed.
① StochRSI
Maintain upward momentum
before entering the Overbought region.
② OBV
Break above the High Line
↓
Hold above the High Line
③ BSSC
Break above the Zero Line
↓
Hold above the Zero Line
If these three conditions develop together,
the move may be considered more than just
a short-term Technical Rebound.
It could indicate:
▶ Strengthening Bullish Momentum
▶ Increasing Probability of a Trend Reversal
============================================================
■ FIRST LEVEL TO WATCH IN THE SHORT TERM
========================================
From a short-term perspective,
the first important price level is:
▶ StochRSI 80 : 64,999.0
BTC needs to move above this level
and establish support.
In other words:
64,999.0 Breakout
↓
Support Confirmation
↓
66,323.12 Test
This is the short-term price structure
I will be watching closely.
============================================================
■ WHAT IF 62,793.20 BREAKS DOWN?
================================
If BTC fails to hold around 62,793.20
and continues to move lower,
the next major support zone is:
▶ 59,371.07 - 61,299.80
This zone represents a previous high area
and an important potential support zone
from a medium- to long-term perspective.
Therefore, to preserve the broader bullish structure,
BTC should absorb selling pressure
and establish support within this area.
============================================================
■ IN A BEARISH CYCLE, WHERE PRICE HOLDS MATTERS
===============================================
This year falls within what I view as Bitcoin's:
▶ 3-Year Bullish + 1-Year Corrective Cycle
Therefore, it is important to consider the possibility
of a broader corrective phase.
In this type of market environment,
"How strongly does price rise?"
may be less important than:
"Where does price hold despite heavy selling pressure?"
A price zone that continues to hold
despite strong Selling Pressure
may eventually develop into a:
▶ Major Low
▶ Bottoming Zone
▶ Accumulation Zone
Therefore, rather than trying to predict
the exact market bottom,
it is more important to prepare a plan for:
▶ Where to accumulate
▶ How much to accumulate
▶ How to scale into positions
============================================================
■ ACCUMULATION IS MORE ABOUT STRATEGY THAN PRICE
================================================
The simplest way to accumulate is to make
one large purchase at a specific price.
However, identifying the exact bottom
in a real market is extremely difficult.
Therefore, a more practical approach is:
▶ Scale-in : Gradual Buying
▶ Scale-out : Gradual Selling
Before entering a position,
at least three things should be planned.
① Where will I buy?
② What will I do if price rises?
③ What will I do if price falls further?
Without a Trading Plan,
it can be difficult to accumulate consistently
during a prolonged bottoming process.
============================================================
■ MY BASIC RULE FOR BUYING
==========================
My basic approach to buying remains the same.
▶ HA-Low
or
▶ DOM(-60)
I consider buying when price reaches
one of these areas and confirms support.
HA-Low and DOM(-60) are important reference points
for identifying:
▶ Potential Lows
▶ Potential Accumulation Zones
However, there is one important point.
!!! HA-Low or DOM(-60) = Final Bottom
This is NOT necessarily true.
Price may break below these levels
and continue moving lower.
However, when price reaches these areas,
the market may be entering a potential:
▶ Accumulation Zone
Therefore, the preferred sequence is:
HA-Low / DOM(-60)
↓
Support Confirmation
↓
SBOD Confirmation
↓
Scale-in Buying
============================================================
■ WHAT TO CONFIRM WITH SBOD
===========================
When evaluating whether support is forming,
I focus on the following priority:
BSSC > OBV > StochRSI
In particular:
① BSSC
Recover above the Zero Line
or remain above Zero.
② OBV
Selling Pressure Weakens
↓
OBV Turns Upward
③ StochRSI
Bullish Momentum Develops
from the lower region.
If these conditions begin to develop,
the move may represent more than
a temporary price rebound.
It could indicate that a meaningful
support structure is being established.
============================================================
■ RECOVER CAPITAL WHEN PRICE RISES
==================================
During an accumulation phase,
buying should not be the only consideration.
When price rises,
it may be necessary to scale out of part of the position
and rebuild available cash.
For example:
Scale-in Buying
↓
Price Rises
↓
Scale-out Selling
↓
Recover Cash
↓
Price Corrects
↓
Re-accumulate
If the rebound is significantly larger than usual,
another strategy is to:
▶ Sell enough to recover the Initial Capital
↓
▶ Recover the Original Investment
↓
▶ Hold the remaining coins as Profit Position
This can be particularly useful
during a prolonged Accumulation Phase.
The reason is simple:
Individual investors do not have unlimited capital.
Therefore, rather than repeatedly using only:
"Buy → Hold"
it may be more effective to use:
"Buy → Rebound → Scale-out → Recover Cash → Re-accumulate"
This allows capital to circulate
throughout the accumulation process.
============================================================
■ A TRADING PLAN IS MORE IMPORTANT THAN CHART ANALYSIS
======================================================
No matter how accurate your chart analysis may be,
it is difficult to convert that analysis into profit
without a proper trading strategy and response plan.
Therefore, instead of spending all your time
analyzing charts,
it is important to develop:
▶ A Core Trading Plan
that fits your investment style.
This Trading Plan should not apply
to only one cryptocurrency.
It should be a broad framework
that can be repeatedly applied
across different market conditions.
Within that framework,
you can adjust your response according to price action:
▶ Entry
▶ Additional Buying
▶ Scale-out
▶ Stop-Loss
▶ Cash Recovery
▶ Re-accumulation
By repeating this process,
you can gradually develop
your own Trading System.
============================================================
■ THE BTC SCENARIO I'M WATCHING
===============================
Bitcoin has historically shown significant
market structure changes after October.
I am interested to see whether
another major structural change develops
after October this year.
Before that happens,
one scenario I am watching closely is:
┌────────────────────────────────────────────┐
│ │
│ Initial Rebound │
│ ↓ │
│ Sharp Decline │
│ ↓ │
│ Shakeout │
│ ↓ │
│ Trend Reversal Confirmation │
│ │
└────────────────────────────────────────────┘
============================================================
■ WILL BITCOIN FORM A SHAKEOUT?
===============================
The Shakeout I am referring to
is not simply a normal price decline.
The potential structure would look like this:
Major Support Breakdown
↓
Stop-Losses Triggered
↓
Sell-side Liquidity Swept
↓
Price Recovery
↓
Reclaim of Major Support
In other words,
depending on market conditions,
we could potentially see a:
▶ Liquidity Sweep
+
▶ Shakeout
If this scenario develops,
BTC may need to test the liquidity below:
▶ 59,370.07
However, whether BTC actually trades below this level
will depend heavily on the strength
of the rebound that occurs beforehand.
In particular, we need to monitor:
▶ Where does the rebound peak?
▶ How strongly does OBV recover?
▶ Can BSSC reclaim the Zero Line?
============================================================
■ THE MOST IMPORTANT ACCUMULATION ZONE
======================================
The area I am currently watching most closely is:
★ 59,370.07 - 61,299.80 ★
As BTC approaches this area,
the strategy should not be
to make one large purchase immediately.
Instead, I prefer to monitor the following sequence:
Price Declines
↓
HA-Low / DOM(-60) Appears
↓
Support Confirmation
↓
BSSC Recovery
↓
OBV Selling Pressure Weakens
↓
StochRSI Turns Up
↓
Increase Scale-in Accumulation
In particular, if we see:
BSSC Recovery
↓
OBV Bullish Reversal
↓
StochRSI Rising
this may become an important signal of:
▶ Bottoming Process
▶ Accumulation
▶ Potential Bullish Reversal
============================================================
■ FINAL CHECK
=============
During the upcoming BTC Volatility Window,
the most important question is not simply:
"Will Bitcoin rise or fall?"
The key questions are:
① Where is Selling Pressure absorbed?
② Where does a Support Structure develop?
③ Is real Buying Pressure entering the market?
---
▶ 64,999.0
Short-term StochRSI 80 Reference Level
▶ 66,323.12
Key Breakout and Support-Flip Level
for a stronger bullish trend
▶ 62,793.20
Previous HA-Low / Key Support Candidate
▶ 61,299.80
Major Lower Support
★ 59,370.07 - 61,299.80
Major Medium- to Long-Term Support
and Accumulation Zone to Watch
---
▶ ETH Volatility Window Ends
Around August 13
▶ BTC Volatility Window
★ August 17 - 19
★ Main Date : Around August 18
▶ Next ETH Volatility Window
Around August 27
---
Ultimately, during this BTC Volatility Window,
the key question is not:
"How far will Bitcoin fall?"
The more important question is:
"Who is absorbing the supply when Bitcoin falls,
and where does that buying pressure begin to appear?"
August 17 - 19.
Let's watch closely to see
what kind of market structure Bitcoin creates.
============================================================
Thank you for reading.
Wishing you successful trading.
============================================================
Is This a Good Area to Trade???
Hello, traders.
If you follow me, you'll be able to receive new market updates and analysis as soon as they're posted.
Wishing you a successful trading day.
==================================================
■ LONG-TERM WAVE STRUCTURE : STILL IN WAVE 1
From a long-term wave perspective,
the current bullish move can be interpreted as Wave 1 of a larger bullish cycle.
In other words, this does not appear to be a mature stage of the long-term uptrend.
Instead, the market may still be in the early stage of a new bullish wave.
==================================================
■ MID- TO LONG-TERM KEY ZONE : 596.89 ~ 676.69
From a broader trend-structure perspective,
the most important area to monitor is:
▶ 596.89 ~ 676.69
Although price has already moved significantly higher from this key zone,
the broader bullish wave may still be in its relatively early stage.
For the uptrend to remain intact,
it will be important to confirm support around the following levels:
▶ 1,687.83
▶ 1,046.19
In particular, if price retests the 1,687.83 area
and successfully confirms it as support,
bullish momentum could accelerate significantly.
However, if this level fails to hold,
we should remain prepared for a deeper pullback toward the next major support area.
==================================================
■ SHORT-TERM STRUCTURE : STOCHRSI ENTERING OVERBOUGHT
From a short-term perspective,
the current price position requires some caution.
StochRSI has entered the overbought zone,
which means upside momentum may become increasingly limited
and the probability of either a price correction
or a time-based consolidation is increasing.
At this point, OBV becomes particularly important.
If OBV remains above its High Line while price continues to rise,
it suggests that underlying buying pressure remains strong.
Therefore, an overbought StochRSI alone
does not necessarily indicate an immediate bearish reversal.
▶ StochRSI = Momentum / Overheating
▶ OBV = Buying Pressure / Volume Confirmation
Even if the bullish trend continues,
the market will eventually need to cool down the overheated StochRSI condition.
Therefore, whether price can establish support around 1,687.83
will be an important factor in determining the next bullish wave.
If aggressive buying pressure continues
and price moves higher without a meaningful correction,
the next upside target is expected around:
▶ 2,012.47
However, the longer StochRSI remains overheated,
the greater the potential for volatility expansion
when the eventual correction begins.
==================================================
■ CURRENT STRUCTURE : NO CONFIRMED LOW-SIDE REFERENCE YET
The current chart has generated:
▶ HA-High
▶ DOM(60)
However, there is currently no:
▶ HA-Low
▶ DOM(-60)
High-side references : HA-High / DOM(60) ACTIVE
Low-side references : HA-Low / DOM(-60) NOT YET ACTIVE
This means the market currently has reference levels
for identifying potential high-price zones,
while a reliable low-side buying structure has not yet been established.
Therefore, rather than chasing the current rally,
we should remain open to the possibility of a Pullback / Retest
to establish a more reliable support structure.
If you have not entered the market yet,
there is no need to rush.
Waiting for a new DOM(-60) or HA-Low to form,
followed by confirmation that the level is actually holding as support,
may provide a better risk-to-reward opportunity.
Low-side reference forms
↓
HA-Low / DOM(-60) confirmed
↓
Support test
↓
Buying pressure confirmation
↓
Entry decision
==================================================
■ WHAT IF YOU STILL WANT TO TRADE NOW? : DAY-TRADING SETUP
Waiting for a pullback during a strong rally is never easy.
When price continues to rise,
traders naturally feel the urge to participate
and capture at least part of the move.
In this situation,
a short-term Day Trading setup may be considered
if price shows clear support at HA-High or DOM(60).
However, there is an important distinction.
HA-Low / DOM(-60)
→ Primary support-based buying area
HA-High / DOM(60)
→ Aggressive short-term entry in a high-price zone
HA-High and DOM(60) are primarily indicators
used to identify potential high-price areas.
Therefore, buying around these levels
carries a very different risk profile
from buying around HA-Low or DOM(-60).
If you decide to enter around HA-High or DOM(60):
▶ A predefined Stop-Loss is essential.
==================================================
■ DAY-TRADING RISK MANAGEMENT : STOCHRSI 20 / 80
If a Day Trading position is opened
around HA-High or DOM(60),
the StochRSI 20 and 80 levels can be used
for more detailed trade management.
At the current price structure:
▶ 1,580.88
This level can be used as
a short-term risk-management reference
and potential Stop-Loss level.
However, there is one important consideration.
The 1W HA-High is currently located around:
▶ 1,687.83
There is a meaningful distance between
the 1W HA-High at 1,687.83
and the StochRSI 80 level at 1,580.88.
Therefore, traders should carefully evaluate
the distance between entry and Stop-Loss
and adjust Position Sizing accordingly.
If the required Stop-Loss is wide,
reducing position size can help keep overall risk under control.
==================================================
■ CONCLUSION : CHASE THE RALLY OR WAIT FOR THE PULLBACK?
The market is currently showing strong bullish momentum,
but StochRSI has already entered the overbought zone.
At the same time,
HA-Low and DOM(-60) have not yet been generated.
This means a reliable low-side buying structure
has not yet been fully established.
StochRSI overheating cools down
↓
Price correction / Time-based consolidation
↓
HA-Low / DOM(-60) forms
↓
Key support confirmation
↓
Entry decision
If you still want to participate in the current bullish momentum:
HA-High / DOM(60) support confirmation
↓
Short-term entry
↓
Manage with StochRSI 20 / 80
↓
Predefined Stop-Loss
↓
Trade with a short-term horizon
==================================================
■ KEY LEVELS
▶ 596.89 ~ 676.69
▶ 1,046.19
▶ 1,580.88
▶ 1,687.83
▶ 2,012.47
==================================================
■ FINAL CHECK
The most important question right now is not:
"How much higher can price go?"
The more important question is:
"Where will the market confirm support?"
One of the biggest risks during a strong bullish move
is chasing price simply because it continues to rise.
If aggressive buying pressure keeps pushing price higher
while StochRSI remains overheated,
the eventual cooling process may result in
a sharp increase in volatility and a deeper correction.
Therefore, missing an immediate entry
does not necessarily mean missing the opportunity.
▶ Avoid chasing price — wait for support confirmation
▶ Watch for a new HA-Low / DOM(-60)
▶ Treat HA-High / DOM(60) entries as short-term Day Trades
▶ Always define a Stop-Loss when entering in a high-price zone
▶ Evaluate StochRSI overheating together with OBV buying pressure
A good entry is not about chasing a rising market.
It is about waiting for the market
to show you where buyers are willing to defend.
==================================================
Thank you for reading.
Wishing you successful trading.
Below 0.930: Entering the Mid- to Long-Term Investment Zone
Hello, traders.
If you follow me, you'll be able to receive new market updates and analysis as soon as they are posted.
Wishing you successful trading today.
━━━━━━━━━━━━━━━━━━━━━━━━━━━━━━━━━━
■ Mid- to Long-Term Outlook: Watch Below 0.930
As the price has fallen below the **1.50–1.9669 range**, the market is moving closer to a potential mid- to long-term accumulation area.
In particular,
▶ **Below 0.930**
a further decline could bring the price into a more significant **Mid- to Long-Term Accumulation Zone**.
From this point forward, the key question is not simply:
"How much further can the price fall?"
Instead, we should focus on:
**Where does strong trading volume and buying pressure begin to emerge during the decline?**
That could provide an important clue as to where meaningful accumulation is taking place.
━━━━━━━━━━━━━━━━━━━━━━━━━━━━━━━━━━
■ Short-Term Key Level: Reclaiming 1.0409
The first important level to monitor is:
▶ **1.0409**
For the short-term structure to improve, the price needs to **reclaim 1.0409** and then successfully convert this level into support.
From an SBOD perspective, this should ideally be accompanied by improving momentum, including:
* BSSC turning upward
* OBV recovering or showing stronger buying pressure
* StochRSI turning upward
The current **DOM(-60) level is around 1.0490**, and this level has recently been renewed lower.
This suggests that downside pressure has not yet been fully resolved.
Therefore, the upcoming BTC volatility window will be particularly important:
▶ **August 17–19**
▶ Key timing: **around August 18**
We need to watch whether the market can establish a meaningful rebound structure as it moves through this volatility window.
Based strictly on the current market structure,
**the probability of reclaiming 1.0409 and successfully holding it as support still appears relatively low.**
Rather than anticipating the reversal, it is better to wait for confirmation from both price action and momentum indicators.
━━━━━━━━━━━━━━━━━━━━━━━━━━━━━━━━━━
■ First Rebound Checkpoint: 1.0210
Before discussing a full trend reversal, the first level that needs to be tested is:
▶ **StochRSI 50 = 1.0210**
In the short term, we should first determine whether the price can **rebound toward 1.0210**.
If the price cannot reclaim 1.0210, it may still be too early to expect a meaningful reclaim of 1.0409.
━━━━━━━━━━━━━━━━━━━━━━━━━━━━━━━━━━
■ Unusual Volatility in the Price Channel
During periods of strong volatility, price action will typically cause one side of the Price Channel to disappear first:
▶ Upper boundary: **HH**
▶ Lower boundary: **LL**
This usually provides an indication of the developing directional move.
This time, however, **both the HH and LL have disappeared**, creating an unusual volatility structure.
This may indicate that the market is currently going through a **Price Discovery phase**, searching for a new trading range rather than establishing a clear directional trend.
Therefore, instead of calling a bottom or trend reversal based on short-term price action alone, it is important to wait for new support and resistance structures to develop.
━━━━━━━━━━━━━━━━━━━━━━━━━━━━━━━━━━
■ Key Trend-Reversal Zone: 1.1237–1.1475
The HA-Low levels on the 1D and 1W charts are currently positioned within:
▶ **1.1237–1.1475**
Considering the current price location, this area should not be viewed merely as short-term resistance.
It represents an important zone that the price needs to recover in order to transition from a bearish structure toward a bullish structure.
The recovery sequence to monitor is:
**1.0210 Reclaim**
↓
**1.0409 Reclaim & Support Confirmation**
↓
**Approach 1.1237–1.1475**
↓
**HA-Low Zone Reclaim & Support Conversion**
↓
**Higher Probability of a Bullish Trend Reversal**
Simply breaking above 1.1237–1.1475 would not be enough.
The price should successfully **hold this zone as support** before it can be considered a more meaningful bullish trend-reversal signal.
━━━━━━━━━━━━━━━━━━━━━━━━━━━━━━━━━━
■ Near 0.930, Watch Volume — Not Just Price
Trading decisions should ultimately be based on **support and resistance confirmation**.
During a high-volatility decline like the current one, attempting to predict the exact bottom can carry significant risk.
Instead, it is better to observe whether actual support develops around important technical levels.
If the price approaches:
▶ **0.930**
trading volume becomes particularly important.
If volume expands significantly around 0.930 while:
* Downside momentum begins to slow
* Buying pressure starts to increase
* Heavy selling pressure is absorbed
* A clear support structure begins to develop
this could become an important signal that **mid- to long-term accumulation** is taking place.
If these conditions are confirmed, an aggressive **scaled-entry strategy** may become worth considering.
━━━━━━━━━━━━━━━━━━━━━━━━━━━━━━━━━━
■ Be Prepared for a Failure to Hold 0.930
The situation changes if strong volume and buying pressure fail to appear around 0.930 and the level breaks down.
In that case, the move may no longer represent a simple short-term correction.
Instead, the market could continue searching for lower prices within the broader **mid- to long-term investment zone**.
Therefore, 0.930 should not automatically be treated as the absolute bottom.
The key question is:
**Can buyers absorb the selling pressure around 0.930 and establish meaningful support?**
That confirmation is more important than the price level itself.
━━━━━━━━━━━━━━━━━━━━━━━━━━━━━━━━━━
■ Key Levels Summary
▶ **1.1237–1.1475**
1D · 1W HA-Low
Key recovery zone required for a potential bullish trend reversal
▶ **1.0490**
DOM(-60)
Recently renewed lower technical level
▶ **1.0409**
Key short-term reclaim and support-conversion level
▶ **1.0210**
StochRSI 50
First short-term rebound checkpoint
▶ **0.930**
Key level for evaluating entry into the mid- to long-term investment and accumulation zone
━━━━━━━━━━━━━━━━━━━━━━━━━━━━━━━━━━
■ Current Trading Strategy
At this stage, rather than aggressively trying to predict the bottom, the priority should be to determine **where the market actually establishes support**.
In the short term, watch the recovery sequence:
**1.0210 → 1.0409**
If those levels are successfully reclaimed, the next major test will be:
**1.1237–1.1475**
A reclaim and successful support conversion of this HA-Low zone could become an important signal that the broader market structure is beginning to shift bullish.
On the other hand, if the decline continues toward **0.930**, pay close attention to trading volume and the strength of incoming demand.
If heavy selling pressure is absorbed around 0.930 with strong volume and clear support formation, the area may become suitable for an **aggressive scaled-entry strategy from a mid- to long-term perspective**.
However, if support fails to develop, it would be better to remain patient and prepare for the possibility of further downside.
━━━━━━━━━━━━━━━━━━━━━━━━━━━━━━━━━━
※ KEY TAKEAWAY
**In the short term, watch whether the price can recover 1.0210 → 1.0409. If the decline continues toward 0.930, the key signal for a mid- to long-term entry will be whether strong buying volume can absorb the downside pressure and establish meaningful support.**
━━━━━━━━━━━━━━━━━━━━━━━━━━━━━━━━━━
Thank you for reading.
Wishing you successful trading.
ADA Key Zone: 0.1679 ~ 0.1973
Hello, traders.
Thank you for following my analysis.
If you "Follow" me, you'll be able to receive new market updates as quickly as possible.
Wishing you successful trading today.
==================================================
* Key Zone: 0.1679 ~ 0.1973
* Key Volume Profile Level: 0.1813
* Upper Breakout / Support Confirmation: Around 0.1973
* Lower Breakdown Level: 0.1679
==================================================
ADA moved above 0.1971 but failed to establish support above that level and is now facing renewed downside pressure.
The most important price zone to watch is:
> > > 0.1679 ~ 0.1973
This zone is likely to play a major role in determining ADA's short-term direction.
If the current weakness continues, price may eventually retest the lower boundary around 0.1679.
However, before that happens, there is another important level to watch:
> > > Volume Profile: 0.1813
The 0.1813 level is a key volume profile level located inside the current major price zone.
Therefore, if ADA rebounds, the important question is not simply whether price moves higher, but:
"Can ADA break above 0.1813 and successfully flip it into support?"
In other words:
0.1813 Breakout
↓
Retest Around 0.1813
↓
Support Confirmation
↓
Higher Probability of Further Upside
This is the price structure we need to watch for.
On the other hand, if ADA fails to reclaim 0.1813, downside pressure toward 0.1679 may increase again.
==================================================
==============================================
One of the most difficult decisions in trading is determining:
"Which price levels should be used for scaling in and scaling out?"
Simply buying because price has fallen significantly or selling because price has risen significantly does not provide a reliable trading framework.
We need objective reference levels that help identify potential low and high zones.
==================================================
==================================
My chart includes indicators designed to identify potential low and high zones.
The primary indicators used to identify potential low zones are:
> > > DOM(-60)
> > > HA-Low
When price declines, we should first monitor whether either of these indicators begins to form.
The basic sequence is:
Price Decline
↓
DOM(-60) or HA-Low Formation
↓
Price Tests the Level
↓
Support Confirmation
The appearance of DOM(-60) or HA-Low alone does not mean that we should immediately buy.
What matters is whether:
"Actual buying pressure enters the market and establishes support around that level."
==================================================
===================================
The primary indicators used to identify potential high zones are:
> > > DOM(60)
> > > HA-High
When price rises toward DOM(60) or HA-High, that area can be considered a potential High Zone where short-term selling pressure may increase.
Therefore:
DOM(-60) / HA-Low
= Potential Low Zone + Support Confirmation Area
DOM(60) / HA-High
= Potential High Zone + Resistance Confirmation Area
These indicators can serve as key reference points for a basic trading strategy.
Whenever price approaches one of these levels, we need to carefully monitor the price reaction.
==================================================
============================
The next indicators that can be used for short-term trading decisions are:
> > > StochRSI 20
> > > StochRSI 50
> > > StochRSI 80
These levels display the behavior of the Stochastic RSI directly on the price chart.
This allows us to visually identify the price levels associated with different stages of the StochRSI momentum cycle.
---
##
StochRSI 20 represents the price level formed when the StochRSI enters the oversold region.
Therefore, for price to begin establishing a meaningful bullish move, one of the first things we need to see is:
> > > Reclaim of StochRSI 20
The fact that StochRSI has reached the bottom is not enough.
Price needs to reclaim the StochRSI 20 level and establish support above it.
---
##
StochRSI 50 can be used as a midpoint reference for short-term momentum.
If price reclaims StochRSI 20 and then breaks above and holds StochRSI 50, it may indicate that short-term bullish momentum is strengthening.
The sequence would be:
StochRSI 20 Reclaim
↓
StochRSI 50 Breakout
↓
Short-Term Momentum Strengthens
---
##
StochRSI 80 represents the price level formed when the StochRSI enters the overbought region.
The StochRSI 80 level currently displayed on the chart represents a previous overbought zone.
Therefore, if price manages to hold around this StochRSI 80 level, it may indicate that:
"The previous overbought zone is being converted into support."
However, price is currently trading below the StochRSI 20 level.
Therefore, the first thing we need to focus on is not StochRSI 80, but:
> > > Whether price can reclaim StochRSI 20
==================================================
=====================================
StochRSI has now reached its lowest region.
This means the probability of a short-term rebound is gradually increasing.
However, there is an important point to remember.
We should never interpret:
> > > StochRSI Oversold = Automatic Buy Signal
Even if StochRSI begins to rebound, if:
* OBV continues to decline, or
* BSSC remains bearish,
it may indicate that actual buying pressure is still insufficient.
In that case, the market may develop the following structure:
StochRSI Rebound
↓
Short-Term Price Bounce
↓
OBV / BSSC Fail to Recover
↓
Limited Upside
↓
Higher Probability of Another Decline
Therefore, we should not rely on StochRSI alone.
We need to monitor:
> > > StochRSI = Momentum
> > > OBV = Volume / Buying Pressure
> > > BSSC = Trend Strength
together.
==================================================
================================
At this stage, the priority is not to find an immediate entry.
The first thing we need to determine is:
> > > Where will DOM(-60) or HA-Low form?
Once one of these Low Zone indicators forms, we can monitor whether price establishes actual support around that level while also checking:
StochRSI
+
OBV
+
BSSC
The preferred sequence is:
DOM(-60) / HA-Low Formation
↓
Support Test
↓
StochRSI Turns Up
↓
OBV Decline Slows or Turns Up
↓
BSSC Recovers
↓
Evaluate Entry
At the moment, these conditions have not yet been sufficiently confirmed.
Therefore:
> > > This is not yet an ideal time for aggressive trading.
Rather than entering too early, it may be better to wait until a new Low Zone forms and support is confirmed.
==================================================
==========================
The 0.1679 level requires particular attention.
> > > Holding Above 0.1679
> > > = Rebound potential remains intact within the current key zone.
> > > Breakdown Below 0.1679
> > > = Increased probability of further structural weakness.
If ADA falls below 0.1679 and fails to reclaim the level, I recommend stepping away from short-term trading and reassessing the broader market structure.
The reason is that a move below 0.1679 may signal a transition away from a short-term Trading Zone and into a:
> > > Mid- to Long-Term Accumulation / Investment Zone
In this area, rather than chasing a short-term rebound, it becomes more important to identify where new DOM(-60), HA-Low, and longer-term support levels begin to form.
==================================================
=====================
Key Zone
> > > 0.1679 ~ 0.1973
Key Volume Profile
> > > 0.1813
First Requirement for Short-Term Bullish Recovery
> > > Reclaim and Hold StochRSI 20
Potential Low Zone
> > > DOM(-60) / HA-Low
Potential High Zone
> > > DOM(60) / HA-High
Rebound Confirmation
> > > StochRSI + OBV + BSSC
0.1813 Reclaim + Support Confirmation
> > > Higher Probability of Short-Term Upside
0.1679 Breakdown + Failure to Reclaim
> > > Pause Short-Term Trading / Watch for Transition into a Mid- to Long-Term Zone
==================================================
The key question for ADA right now is not:
"How far has price already fallen?"
The real question is:
"Where will support actually be confirmed?"
A large decline alone does not mean that a bottom has formed.
We need to see DOM(-60) or HA-Low form, confirm that price is holding that area as support, and then monitor whether StochRSI, OBV, and BSSC begin to recover together.
That is when we should start considering a trade.
---
Thank you for reading.
Wishing you successful trading.
ETH: Can It Hold Support Around 1,861.57?
Hello, traders.
Thank you for following my analysis.
If you follow me, you can receive new market updates as soon as they are published.
Wishing you successful trading today.
==================================================
■ BTC and ETH: Similar Price Action, One Key Difference
=======================================================
BTC and ETH are the two major assets representing the crypto market.
Their price movements therefore have a significant influence on overall crypto market sentiment and trend direction.
When comparing BTC and ETH, their volatility may differ, but their overall price structures currently look quite similar.
However, there is one important difference that deserves attention:
▶ "Where is the current price positioned relative to the mid-term low zone?"
This difference may help determine whether BTC or ETH is more likely to lead the market's next short-term directional move.
---
## ■ BTC and ETH Mid-Term Low Levels
BTC : 66,323.12
ETH : 1,782.28
Based on the current price structure, ETH may have a greater influence on the crypto market's short-term direction.
However, even if ETH takes the lead, its influence may remain relatively short-lived.
For ETH to generate a meaningful rally, BTC ideally needs to avoid another sharp decline and consolidate within a defined range.
==================================================
■ If BTC Consolidates, Watch ETH Closely
========================================
If BTC remains range-bound within
▶ 59,981.47 ~ 66,323.12
and ETH begins to develop bullish momentum at the same time, the broader crypto market may have a higher probability of entering a short-term rebound or bullish phase.
The first key level to watch on ETH is
▶ 1,964.96
The 1,964.96 level is an important price point for determining whether ETH can begin transitioning bullish from its short-term low structure.
Therefore, if ETH breaks above 1,964.96 and successfully holds above it, short-term bullish momentum may strengthen.
---
## ■ Why 1,861.57 Matters for ETH
The 1,861.57 level is an important reference point for evaluating a potential mid-term bullish transition.
Therefore, we need to watch whether ETH can establish support around 1,861.57 and rebound from this area.
However,
▶ Support at 1,861.57 ≠ Confirmation of a mid-term bullish trend.
To increase the probability of a mid-term bullish transition,
▶ A breakout and hold above 1,964.96
should first be confirmed.
For a clearer confirmation of a mid-term bullish reversal,
▶ ETH needs to rise above 2,111.42.
Therefore, ETH's current structure should be monitored step by step:
1. Confirm support around 1,861.57
2. Break above and hold 1,964.96
3. Confirm a breakout above 2,111.42
4. Watch for a potential breakout above 2,317.39
==================================================
■ ETH Key Price Levels
======================
The major ETH price levels can be summarized as follows:
1. 1,666.58 ~ 1,782.28
→ Key short-term and mid-term low zone
→ Major support zone to monitor during further downside
2. 1,861.57 ~ 2,111.42
→ Key zone for evaluating a potential mid-term bullish transition
→ Support and breakout behavior within this range will be important
3. 1,964.96
→ Key level for confirming a potential short-term bullish transition
→ A breakout followed by a successful hold above this level is important
4. 2,317.39
→ Major short-term high and overhead resistance
→ The next key level after breaking above the 1,861.57 ~ 2,111.42 zone
Therefore, the ideal bullish progression would be:
1,861.57 Support
↓
1,964.96 Breakout & Hold
↓
2,111.42 Breakout
↓
2,317.39 Test
On the other hand, if ETH fails to hold around 1,861.57, we should also consider the possibility of a retest of the lower
▶ 1,666.58 ~ 1,782.28
support zone.
==================================================
■ BTC Volatility Window: August 17 ~ 19
=======================================
The next important market variable is BTC's upcoming volatility window.
BTC's next major volatility period is expected around
▶ August 18
▶ Expected window: August 17 ~ 19
Therefore, BTC's directional move during and after this period could become an important factor in determining the short-term direction of the broader crypto market.
---
## ■ BTC 62,793.20 Support Is Critical
The key BTC level to watch right now is
▶ 62,793.20
The 62,793.20 level is an important reference point for evaluating a potential bullish transition from BTC's short-term low structure.
Therefore, whether BTC can hold support around this level and rebound will be critical.
More importantly, for a sustainable bullish move to develop from a key price level, price action alone is not enough.
Bullish momentum should also be confirmed through the supporting indicators.
==================================================
■ SBOD Check: StochRSI · OBV · BSSC
===================================
For a bullish transition to develop around an important level or zone, we need to monitor:
▶ StochRSI
▶ OBV
▶ BSSC
These indicators are currently showing an overall bearish/downward bias.
Therefore, it is especially important to determine whether genuine buying pressure begins to emerge and support develops around the current price area.
However, StochRSI has entered the oversold region, which is worth monitoring closely.
An oversold StochRSI does NOT necessarily mean:
"Price will immediately rise."
Instead, it suggests:
▶ Downside momentum may begin to weaken.
Therefore, StochRSI entering oversold territory alone should not be treated as confirmation of a market bottom or bullish reversal.
The direction of BSSC and OBV should also be monitored.
In particular, if the following developments begin to appear:
▶ BSSC turns upward
▶ OBV stabilizes and begins turning upward
▶ StochRSI exits the oversold region and turns upward
then the probability of support forming around the current price area may increase.
==================================================
■ Key Market Scenarios
======================
1,861.57 Support
↓
1,964.96 Breakout & Hold
↓
2,111.42 Breakout
↓
2,317.39 Test
62,793.20 Support
↓
SBOD Bullish Turn
↓
Short-Term Bullish Momentum Recovery
BTC holds the 59,981.47 ~ 66,323.12 range
+
ETH holds 1,861.57 and breaks above 1,964.96
↓
Higher probability of a short-term crypto market rally
==================================================
■ Conclusion
============
The first thing to watch in the current market is whether ETH can establish support around 1,861.57.
If support is confirmed around 1,861.57 and ETH subsequently breaks above and holds 1,964.96, short-term bullish momentum may strengthen.
If ETH then breaks above 2,111.42, the probability of a mid-term bullish transition could increase further.
On the other hand, if ETH fails to hold around 1,861.57, traders should be prepared for a potential retest of the 1,666.58 ~ 1,782.28 support zone.
BTC also needs to establish support around 62,793.20.
In particular, BTC's expected volatility window from August 17 to August 19 could lead to a significant expansion in price movement.
Therefore, it will be important to monitor not only price action but also changes in StochRSI, OBV, and BSSC momentum.
The key points to watch are:
▶ BTC : Support at 62,793.20
▶ ETH : Support at 1,861.57
▶ ETH : Breakout and hold above 1,964.96
▶ ETH : Breakout above 2,111.42 for stronger mid-term bullish confirmation
▶ BTC : Volatility expansion around August 17 ~ 19
Rather than predicting market direction simply because price has reached an important level, it is better to confirm the market step by step:
"Support Confirmation → Indicator Momentum Turns Bullish → Key Resistance Breakout → Hold Above Resistance"
---
Thank you for reading until the end.
Wishing you successful trading.
KEY QUESTION: CAN SPCX BREAK ABOVE 145.30 ~ 154.60?
Hello, traders and investors.
Follow me to receive the latest market analysis and updates as quickly as possible.
Wishing you a successful trading day.
────────────────────────────────────
▶ SPCX CHART
────────────────────────────────────
■ CURRENT MARKET STRUCTURE
────────────────────────────────────
Since SPCX has only a limited amount of trading history,
the support and resistance levels currently visible on the chart
may not yet have strong reliability.
Therefore, extra caution is required when trading.
It is important to confirm whether key price levels
actually function as support or resistance before making a decision.
────────────────────────────────────
■ KEY LOW-VOLUME NODE : 145.30 ~ 154.60
────────────────────────────────────
SPCX currently has a key Low-Volume Node (LVN) around:
▶ 145.30 ~ 154.60
If the price breaks above this range
and successfully establishes it as support,
▶ the probability of developing a new bullish trend could increase.
────────────────────────────────────
■ BULLISH MOMENTUM CONFIRMATION : 159.20
────────────────────────────────────
The StochRSI 20 reference level is currently around:
▶ 159.20
Therefore, stronger bullish momentum may require:
▶ Break above 159.20
↓
▶ Hold above 159.20
↓
▶ Bullish momentum strengthens
A sustained move above this level would provide stronger confirmation
that the stock is attempting to establish a new upward trend.
────────────────────────────────────
■ STOCHRSI OVERBOUGHT RESET
────────────────────────────────────
The recent advance has increased expectations
for further upside.
However, for SPCX to decisively break through the
▶ 145.30 ~ 154.60 range
and continue moving higher,
StochRSI may first need to cool down
and reset its short-term momentum.
If the current upward momentum continues without a pause,
StochRSI could quickly enter the overbought zone.
This could temporarily limit further upside momentum.
Therefore, the market may need:
▶ A period of consolidation
or
▶ A moderate short-term pullback
to allow StochRSI to cool down
and rebuild room for another upward move.
────────────────────────────────────
■ WHAT IF OBV REMAINS STRONG?
────────────────────────────────────
During this process, watch the OBV closely.
If OBV shows the following structure:
▶ Break above the High Line
↓
▶ Hold above the High Line
↓
▶ Continue trending higher
this would indicate that buying pressure remains strong.
Under these conditions,
the bullish trend could continue
even if StochRSI enters the overbought zone.
If buying pressure remains strong,
the next major upside target could be:
▶ 171.74
────────────────────────────────────
■ KEY SUPPORT DURING A PULLBACK : 138.74
────────────────────────────────────
If a correction develops
while StochRSI works off its overbought condition,
the first important level to monitor is:
▶ 138.74
If the price remains above 138.74
while StochRSI cools down
and subsequently turns higher again,
▶ the probability of another bullish move could increase.
────────────────────────────────────
■ BROADER BULLISH STRUCTURE : 114.92
────────────────────────────────────
Considering the current price structure,
even if the correction becomes deeper,
the StochRSI 80 reference level around:
▶ 114.92
remains an important level to monitor.
As long as the price remains above 114.92,
▶ the broader bullish structure may remain intact.
────────────────────────────────────
■ STRATEGY FOR A NEW ENTRY
────────────────────────────────────
For investors considering a new position,
chasing the current price may carry additional risk.
A more conservative approach would be:
▶ Break above 145.30 ~ 154.60
↓
▶ Confirm support above the breakout zone
↓
▶ Confirm strength in OBV
↓
▶ Confirm bullish momentum
↓
▶ Consider a new entry
The key is not simply whether the price rises,
but whether the breakout level successfully converts into support.
━━━━━━━━━━━━━━━━━━━━━━━━━━━━━━━━━━━━
■ KEY LEVELS SUMMARY
━━━━━━━━━━━━━━━━━━━━━━━━━━━━━━━━━━━━
▶ 145.30 ~ 154.60
Key Low-Volume Node
Breakout & support-conversion zone
▶ 159.20
Bullish momentum confirmation level
▶ 171.74
Major upside target if momentum continues
▶ 138.74
Primary support level during a short-term correction
▶ 114.92
Key level for maintaining the broader bullish structure
▶ OBV High Line
Key indicator for confirming sustained buying pressure
━━━━━━━━━━━━━━━━━━━━━━━━━━━━━━━━━━━━
■ CONCLUSION
━━━━━━━━━━━━━━━━━━━━━━━━━━━━━━━━━━━━
The most important question for SPCX is:
▶ Can the price break above 145.30 ~ 154.60?
And more importantly:
▶ Can this range successfully convert from resistance into support?
If StochRSI cools down
while OBV remains above the High Line
and continues showing strong buying pressure,
the potential bullish sequence would be:
▶ Break above 145.30 ~ 154.60
↓
▶ Establish the range as support
↓
▶ Break above 159.20
↓
▶ Bullish momentum strengthens
↓
▶ Potential move toward 171.74
Therefore, rather than simply chasing the current rally,
the key factor to monitor is:
"BREAKOUT AND SUPPORT CONVERSION OF 145.30 ~ 154.60"
This could become the critical confirmation
for SPCX's next major bullish move.
────────────────────────────────────
Thank you for reading.
Wishing you successful trading.
Building Momentum for a Move Above 82.79 Is the Key
Hello, traders.
If you follow me, you'll be able to receive new market updates and analysis as soon as they are posted.
Wishing you a successful trading day.
━━━━━━━━━━━━━━━━━━━━━━━━━━━━━━━━━━
■ SOL Key Support & Resistance Zone
SOL is currently trading near one of its most important support and resistance zones:
▶ 58.38 ~ 68.20
If SOL establishes solid support around this area, the probability of a medium- to long-term trend reversal could increase significantly.
On the other hand, if price breaks below the 58.38 ~ 68.20 zone, SOL may enter a price range that should be approached from a longer-term investment perspective.
Therefore, it is important to prepare a capital management and risk management strategy in advance in case this zone fails to hold.
The HA-Low on the 1W chart is currently located around:
▶ 86.71
For SOL to develop a meaningful bullish structure, the key will be whether price can move above 86.71 and successfully turn this level into support.
━━━━━━━━━━━━━━━━━━━━━━━━━━━━━━━━━━
■ How Should We Use HA-Low and HA-High?
The major trading opportunities on this chart are determined by how price reacts around the HA-Low and HA-High levels.
In simple terms:
▶ HA-Low = Key zone for buying and accumulation
▶ HA-High = Key zone for profit-taking and managing positions near potential highs
The HA-Low area is one of the key zones for looking for buying opportunities.
However, a breakdown below HA-Low should not automatically be interpreted as a buy signal.
If HA-Low continues to move lower in a step-down pattern, it indicates that the market is still undergoing additional price correction.
At the same time, this process may eventually develop into an accumulation structure that sets the stage for a future bullish reversal.
Therefore, as HA-Low moves lower, rather than entering a large position all at once, it is more important to monitor whether price establishes support around each newly formed HA-Low and build the position gradually.
HA-High has a completely different role.
Since HA-High represents a potential high-price zone, protecting profits should be the priority when price approaches this area.
Therefore, around HA-High, traders should consider:
▶ Partial profit-taking
▶ Raising stop levels
▶ Protecting unrealized profits
If price falls below HA-High and the level turns into resistance, reducing risk through a stop-loss or additional partial selling may be necessary.
On the other hand, if price breaks above HA-High and successfully converts it into support, a short-term day-trading opportunity may develop.
However, if price subsequently falls back below HA-High and the level becomes resistance again, strict stop-loss management is essential.
In other words:
▶ HA-Low breakdown = Look for accumulation structure and potential re-entry opportunities
▶ HA-High breakdown = Prioritize profit protection and risk management
Although both situations involve price moving lower, their implications are fundamentally different.
━━━━━━━━━━━━━━━━━━━━━━━━━━━━━━━━━━
■ A Strong Rally Ultimately Requires a Break Above HA-High
For price to transition into a strong bullish trend, it ultimately needs to break above HA-High and maintain price above that level.
To generate enough momentum for such a move, it is important that sufficient accumulation takes place around HA-Low.
However, individual traders have no reliable way of knowing the actual amount of accumulation taking place in the market.
Therefore, what we can do is gradually increase our holdings in potential accumulation zones while continuing to protect our trading capital.
This is where the following strategy becomes important:
▶ "Buy → Sell → Re-buy"
Instead of continuously buying without taking profits, the idea is to use market volatility to recover capital while gradually increasing the amount of coins you hold.
━━━━━━━━━━━━━━━━━━━━━━━━━━━━━━━━━━
■ Increasing Holdings While Recovering Capital
For example, after buying at a certain price, if the market moves higher, you can sell approximately 50% of the amount invested in that entry to recover part of your capital.
By repeating this process, you can maintain liquidity for future buying opportunities.
If available trading capital begins to run low, you can sell enough of a profitable position to recover the original capital allocated to that entry.
This allows you to recover your principal while keeping the remaining coins as profit.
The most conservative version of this strategy is:
▶ Recover 100% of the original capital after price rises
At first, this may appear to leave you with too few coins.
However, the final number of coins accumulated can vary significantly depending on how much market volatility you are able to trade and how many successful trading cycles you complete.
If volatility is low, the amount accumulated will naturally be smaller.
If volatility is high, effective short-term trading may provide more opportunities to increase your remaining holdings.
Therefore, during an accumulation phase, the objective should not simply be to "buy cheap."
The following four elements should be considered together:
▶ Protect trading capital
▶ Recover principal
▶ Maintain capital for re-entry
▶ Gradually increase coin holdings
━━━━━━━━━━━━━━━━━━━━━━━━━━━━━━━━━━
■ SOL's Current Short-Term Structure
SOL is currently maintaining bullish momentum after moving above the StochRSI 80 level.
However, the Stochastic RSI indicator itself is currently in the overbought zone.
This means that upside momentum may eventually face some resistance or temporary limitations.
Therefore, as Stochastic RSI resets from the overbought region, it will be important to monitor whether price can maintain support around the StochRSI 80 price level.
If price continues to hold around the StochRSI 80 level while the indicator resets, the current bullish structure is more likely to remain intact.
In that case, the next key zone to watch is:
▶ 82.79 ~ 86.71
If price fails to establish support, the correction could extend toward:
▶ 68.20
During such a decline, price action around the StochRSI 20 level should be monitored closely to determine whether partial selling is necessary.
━━━━━━━━━━━━━━━━━━━━━━━━━━━━━━━━━━
■ SOL's Key Upside Breakout Zone
If SOL continues higher, the first major area to watch is:
▶ 1W Key Zone: 82.79 ~ 86.71
The 1W HA-Low is currently located around 86.71.
Therefore, simply breaking above this zone is not enough.
The key is whether SOL can break above the 82.79 ~ 86.71 zone and successfully convert it into support.
Above this area, the 1D HA-High is currently located around:
▶ 92.83
Since HA-High represents a potential high-price zone, traders should prioritize protecting profits around 92.83 rather than simply expecting further upside.
Partial profit-taking should therefore be considered as price approaches this level.
This means SOL's major upside decision zone can currently be defined as:
▶ 82.79 ~ 92.83
If SOL breaks through this entire zone and successfully establishes support above it, selling pressure may be absorbed and bullish momentum could strengthen significantly.
Under those conditions, the probability of SOL developing a much stronger bullish trend would increase.
━━━━━━━━━━━━━━━━━━━━━━━━━━━━━━━━━━
■ Key Levels Summary
▶ Major Medium-/Long-Term Support & Resistance:
58.38 ~ 68.20
▶ 1W Key Zone:
82.79 ~ 86.71
▶ 1W HA-Low:
86.71
▶ 1D HA-High:
92.83
▶ Major Upside Decision Zone:
82.79 ~ 92.83
The most important factor for SOL right now is not simply whether price moves higher.
SOL needs to build enough momentum to move above 82.79 and successfully convert the 82.79 ~ 86.71 zone into support.
If price then approaches 92.83, protecting profits should come first while monitoring whether the 1D HA-High can be broken and converted into support.
Ultimately, the core principle remains simple:
"Look for opportunities to accumulate around HA-Low,
and protect profits around HA-High."
Maintaining this principle while taking advantage of market volatility is the key to managing both opportunity and risk.
━━━━━━━━━━━━━━━━━━━━━━━━━━━━━━━━━━
Thank you for reading.
Wishing you successful trading.
Key Volume Profile Level : 1.020
Hello, traders.
Follow me to get the latest market analysis as soon as it is published.
Wishing you successful trading.
==================================================
■ ENS - Key Level to Watch
ENS has moved up toward the key Volume Profile level around 1.020.
The most important question now is not simply whether ENS can break above 1.020, but whether it can:
"Flip 1.020 into support and hold above it."
If price confirms support around 1.020, the probability of another upside move could increase.
■ Current Price Position : Short-Term High Zone
On the 1D chart, ENS is currently trading around the following zone:
HA-High ~ DOM(60) : 0.887 ~ 1.016
The HA-High ~ DOM(60) area represents an upper price zone.
Therefore, ENS can currently be considered to be trading in a short-term high zone.
At this level, chasing the price aggressively may carry significant risk.
Instead, the key is to wait and see whether:
"1.020 successfully flips into support."
■ SBOD Conditions for Further Upside
For price to maintain bullish momentum after breaking through an important resistance or Volume Profile level, the following conditions should be monitored.
1. StochRSI
StochRSI should maintain bullish momentum without becoming excessively overbought.
If price continues rising while StochRSI becomes heavily overheated, traders should be prepared for a possible short-term pullback.
2. OBV
OBV should remain above the High Line.
If OBV stays above the High Line while price rises, it suggests that buying pressure continues to support the move.
3. BSSC
BSSC should remain above the zero line.
As long as BSSC holds above zero, the current bullish momentum can be considered intact.
StochRSI rising
+
OBV holding above the High Line
+
BSSC holding above 0
↓
1.020 confirmed as support
↓
Higher probability of further upside
■ Day Trading Strategy
If ENS confirms support around 1.020, a short-term entry may become valid from a day-trading perspective.
However, the current price is already within the 1D HA-High ~ DOM(60) upper zone.
Therefore, this should not be treated as an aggressive swing or long-term accumulation zone.
Any new entry around this area should primarily be approached as a short-term trade.
---
Key Day-Trading Levels
Entry Setup : Confirmation of 1.020 as support
Risk Level : 0.817
1st Target : 1.348
2nd Target : 1.674
3rd Target : 1.926
---
Since 0.817 is relatively far below the current price, using it directly as a day-trading stop-loss would result in an excessively wide risk range.
Therefore, instead of entering a large position at once, position sizing and scaling should be used to manage the average entry price and overall risk.
More importantly, if 1.020 fails to hold and flips back into resistance, reducing the position or exiting quickly should be considered from a short-term trading perspective.
■ Upside Targets
If bullish momentum continues, the following levels should be monitored:
1st Target : 1.348
2nd Target : 1.674
3rd Target : 1.926
Rather than treating these targets simply as levels where the entire position must be sold, traders should monitor:
* Resistance around each target
* Changes in trading volume
* StochRSI direction
* OBV trend
* Whether BSSC remains above 0
Day trading is primarily about generating realized profits.
Therefore, even if price does not reach the final target, partial profit-taking or position reduction may be appropriate once a meaningful profit has been secured.
"Protecting profits is more important than hitting the exact target."
■ What About Long-Term Holders?
If ENS was purchased as a medium- to long-term investment, it may be useful to separate the core position from the trading position.
The main concept is:
"Use short-term trading profits to gradually increase your long-term holdings."
For example, when price rises, instead of selling the entire position, part of the initial capital can be recovered while the remaining tokens are held as a profit position.
If the entire principal is recovered too early, the remaining token position may become too small.
Depending on market conditions, one strategy is to recover approximately 50% of the initial capital and continue holding the remaining position.
■ Managing the Average Entry Price
From a medium- to long-term perspective, the main objective should be to keep the core average entry price:
"Below 1.020"
The core position can be accumulated and managed below 1.020.
Above 1.020, short-term trading can be used to generate realized profits and potentially increase the long-term token holdings.
Below 1.020
→ Manage average entry price
→ Build medium- to long-term holdings
Above 1.020
→ Day trading
→ Scale out
→ Secure realized profits
→ Use profits to increase long-term holdings
Separating the core position from the trading position makes it possible to take advantage of short-term volatility while maintaining a longer-term position.
==================================================
■ Final Summary
The most important level for ENS right now is:
"1.020"
1.020 flips into support
↓
SBOD bullish conditions confirmed
↓
Check for a day-trading entry
↓
1.348
↓
1.674
↓
1.926
On the other hand,
1.020 fails to hold
↓
Flips back into resistance
↓
Avoid chasing the price
↓
Reduce exposure and monitor lower support levels
ENS is currently trading in the upper HA-High ~ DOM(60) zone on the 1D chart.
Therefore, rather than treating this area as an aggressive new swing or long-term buying opportunity, the priority should be:
"Protect profits and focus on short-term trading opportunities."
At this point, the more important question is not:
"How much higher can ENS go?"
but rather:
"Can ENS hold 1.020 as support and maintain its bullish structure?"
==================================================
The way you trade a coin or token should depend on your intended holding period.
Are you trading it as:
* A day trade?
* A swing trade?
* A medium- to long-term investment?
The same price level can represent a buying opportunity for one strategy and a profit-taking zone for another.
Therefore, the first step is to identify where the current price is positioned within the overall market structure.
Identify the price location.
Check support and resistance.
Confirm the indicator structure.
Then build a trading strategy that matches your intended holding period.
---
Thank you for reading.
Wishing you successful trading.
ETH Next Volatility Window: Around August 12 (Aug. 11-13)
Hello, traders.
Follow me to stay updated with the latest market analysis.
Wishing you successful trading.
============================================================
■ ETH VOLATILITY WINDOW: AROUND AUGUST 12
Following the end of BTC's short-term volatility cycle,
the next major volatility window to watch is ETH.
Expected volatility window:
▶ Around August 12
▶ Estimated range: August 11-13
ETH is currently attempting to rebound from its lower price zone.
However, for this move to develop beyond a simple technical rebound
and turn into a meaningful bullish trend reversal, ETH needs to:
▶ Break above 1964.96
▶ Hold above 1964.96
The reason is that ETH has been forming a
"step-down" bearish structure.
To confirm that this step-down structure is ending,
price needs to recover above the previous HA-Low
and successfully hold that level as support.
In other words:
Break above 1964.96
↓
Hold above the level
↓
Recover the previous HA-Low
↓
Step-down structure begins to weaken
↓
Probability of a bullish trend reversal increases
============================================================
■ HA-Low / HA-High: PRIMARY TRADING LEVELS
==========================================
The most important indicators used for actual trade execution
on this chart are:
▶ HA-Low
▶ HA-High
The following indicators are used as confirmation tools:
▶ StochRSI
▶ OBV
▶ BSSC
The basic concept is simple.
HA-Low / HA-High
→ "Where should I trade?"
StochRSI / OBV / BSSC
→ "Are the conditions strong enough to actually take the trade?"
Therefore, I do not buy simply because StochRSI is oversold,
nor do I automatically sell because StochRSI is overbought.
The first step is to determine where price is located
relative to HA-Low and HA-High.
---
## ▶ HA-Low
HA-Low represents a potential LOW ZONE.
When price approaches HA-Low and successfully finds support,
the area may become a potential BUY ZONE.
---
## ▶ HA-High
HA-High represents a potential HIGH ZONE.
When price approaches HA-High and gets rejected,
the area may become a potential SELL / PROFIT-TAKING ZONE.
However, because HA-Low and HA-High are displayed as single lines,
it can sometimes be difficult to identify the broader low
and high zones for actual trading.
============================================================
■ DOM(-60) / DOM(60): DEFINING LOW & HIGH ZONES
===============================================
To solve this issue, I developed:
▶ DOM(-60)
▶ DOM(60)
Represents a potential LOW ZONE.
Used together with HA-Low to identify
potential accumulation and buy areas.
Represents a potential HIGH ZONE.
Used together with HA-High to identify
potential profit-taking areas.
Therefore, actual trading decisions can be based on:
HA-Low
DOM(-60)
HA-High
DOM(60)
The overall structure can be summarized as follows:
DOM(-60) / HA-Low
↓
LOW ZONE
↓
Potential accumulation / buy zone
HA-High / DOM(60)
↓
HIGH ZONE
↓
Profit protection / scale-out zone
============================================================
■ STRATEGY WHEN HA-Low FAILS
============================
If price fails to hold HA-Low and moves lower,
a step-down bearish structure may continue.
However, a break below HA-Low does not necessarily mean
that the entire position should immediately be closed.
A prolonged step-down structure will eventually form
a new bottoming area and attempt a bullish reversal.
Therefore, the key response to an HA-Low breakdown is not:
"Sell 100%"
but rather:
"Secure liquidity through partial position management."
---
##
HA-Low support fails
↓
Partially reduce the position
↓
Increase cash reserves
↓
Monitor the next decline
↓
Price approaches a new DOM(-60) / HA-Low
↓
Check for support
↓
Rebuy the amount previously sold
↓
Add to the position after support is confirmed
This strategy allows traders to maintain liquidity
during a declining market while adjusting their average entry price
and gradually increasing the total position size.
============================================================
■ STRATEGY WHEN HA-High BREAKS
==============================
On the other hand,
if price breaks above HA-High and continues higher,
a step-up bullish structure may begin to develop.
However, a step-up structure will eventually form a high
and transition into a corrective phase.
Therefore, positions accumulated around
HA-Low or DOM(-60) should gradually focus on:
▶ Scaling out
▶ Taking profits
▶ Protecting profits
as price approaches HA-High or DOM(60).
---
##
Price approaches HA-High / DOM(60)
↓
Step 1: Scale out part of the core position
↓
Lock in profits
↓
Check whether HA-High converts into support
↓
Support confirmed + bullish momentum continues
↓
Day-trading opportunity
There is one important point.
HA-High fundamentally represents a HIGH ZONE.
Therefore, even if price breaks above HA-High,
holds it as support and continues higher,
a new position opened in this area should not be treated
the same way as a core position accumulated near HA-Low.
Instead, it should be treated as a:
"Short-term / Day-Trading Position"
Any trade entered around HA-High must have:
▶ A clearly defined stop-loss level.
If a reasonable stop-loss level cannot be determined,
▶ The day trade should NOT be taken.
The reason is simple:
HA-High represents a potential high-price zone.
============================================================
■ CURRENT ETH PRICE STRUCTURE
=============================
ETH is currently moving higher from the important range of:
▶ 1597.76 - 1879.61
and is attempting to challenge:
▶ 1964.96
The supporting indicators are currently showing
somewhat different signals.
---
##
StochRSI is approaching the overbought zone.
This increases the possibility of:
▶ Weakening short-term momentum
▶ A short-term pullback
▶ Sideways consolidation to reset the indicator
---
##
On the other hand,
OBV has moved above the High Line,
indicating strong buying pressure.
Therefore, the key question for ETH is:
"Can this buying pressure be sustained?"
If OBV remains above the High Line
while price holds above 1879.61,
ETH may be able to reset its overbought StochRSI
without experiencing a significant price decline.
In other words, we could see:
"Time-based consolidation rather than a deep price correction."
The ideal bullish structure would be:
OBV remains above High Line
+
Price holds above 1879.61
+
StochRSI resets
↓
Another attempt to break 1964.96
↓
Breakout above 1964.96
↓
1964.96 converts into support
↓
Probability of a bullish trend reversal increases
Strong buying pressure could also push ETH directly above 1964.96
without a meaningful correction.
However, if StochRSI enters the overbought zone
and buying pressure begins to weaken at the same time,
upside momentum may become limited
and another short-term pullback could follow.
============================================================
■ AUGUST 12: TWO KEY PRICE LEVELS TO WATCH
==========================================
Considering the current price structure
and the relationship between:
HA-Low / HA-High
DOM(-60) / DOM(60)
StochRSI / OBV / BSSC
the location of ETH during the next volatility window
will be extremely important.
Next volatility window:
▶ Around August 12
▶ August 11-13
The two most important price levels are:
▶ 1782.28
▶ 1964.96
---
## PRICE NEAR OR ABOVE 1964.96
Break above 1964.96
↓
Hold above 1964.96
↓
Previous HA-Low recovered
↓
Step-down bearish structure weakens
↓
Probability of a bullish trend reversal increases
---
## PRICE NEAR 1782.28
Failure to break 1964.96
↓
Price correction
↓
Test support around 1782.28
↓
Determine the next directional move
============================================================
■ FINAL CHECKPOINT
==================
Next volatility window:
▶ Around August 12
▶ August 11-13
Key price levels:
▶ 1782.28
▶ 1879.61
▶ 1964.96
Key factors to monitor:
▶ Breakout and support above 1964.96
▶ Ability to hold above 1879.61
▶ OBV holding above the High Line
▶ StochRSI reset after entering the overbought zone
▶ Support around HA-Low / DOM(-60)
Ultimately, the key question during this volatility window
is not simply:
"Can ETH break above 1964.96?"
The more important question is:
"Can ETH break above 1964.96 and HOLD above it?"
If ETH successfully breaks above 1964.96
and converts the level into support,
the probability of transitioning out of the current
step-down bearish structure will increase significantly.
On the other hand,
if the breakout fails,
the next important factor will be whether ETH
can establish support around 1782.28.
Therefore, August 11-13 may become
an important volatility window for determining
ETH's next major directional move.
============================================================
Thank you for reading.
Wishing you successful trading.