Short
Short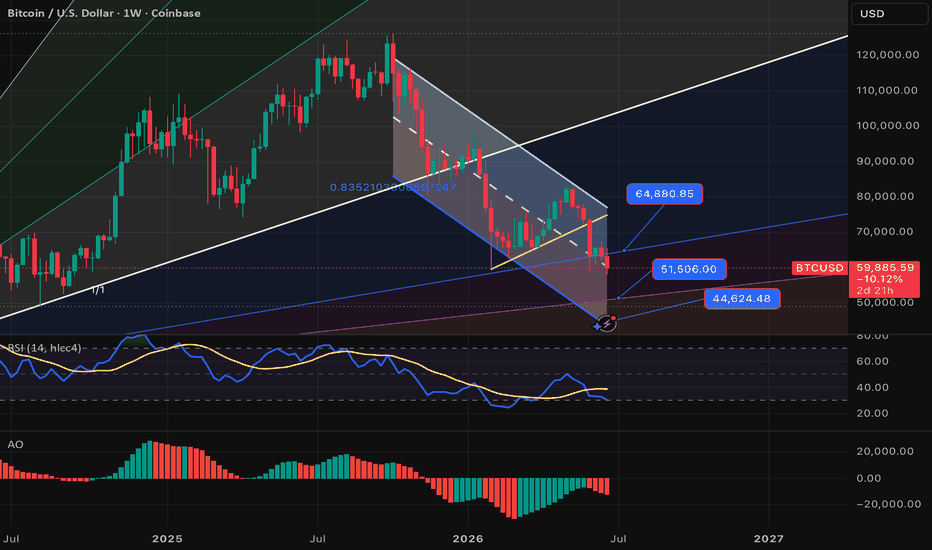
XAUUSD – Gold Breaks Lower, 3,890 Becomes The Next Key LiquidityXAUUSD – Gold Breaks Lower, 3,890 Becomes The Next Key Liquidity Zone
Gold is showing clear bearish pressure after losing the previous uptrend structure and breaking below the strong support area.
Price is currently trading around 3,982, below the SMA 200 and below the broken support zone. This tells us that sellers are still controlling the structure, while any short-term recovery should be treated carefully unless gold can reclaim the higher FVG zones.
FUNDAMENTAL ANALYSIS
Gold remains sensitive to the U.S. dollar, Treasury yields, and market expectations around interest rates. The recent weakness shows that buyers are not strong enough to defend the previous support structure.
For now, the technical chart is leading the view. As long as gold stays below the broken support and FVG resistance, the bearish structure remains active.
TECHNICAL ANALYSIS – SMC + FIBONACCI
From an SMC perspective, gold has broken below the previous rising trendline and lost the strong support zone. This is an important shift because the market is no longer respecting the earlier bullish recovery structure.
Price is now trading below the Fibonacci 1.0 area, showing that downside pressure is still expanding. The nearest reaction area above is the sell order FVG around 4,052. If gold pulls back into this zone and rejects, sellers may continue to defend the move.
Above that, the larger FVG zone around 4,130 – 4,172 is the stronger resistance area. This zone is also close to the SMA 200 area, which makes it important for the bearish structure. As long as gold remains below this region, the recovery is still only a corrective bounce.
The next major downside area is the H4 strong liquidity buy zone around 3,890. This is the level where buyers may try to react, but the reaction needs confirmation before considering any bullish setup.
KEY PRICE ZONES TO WATCH
Current price area: 3,982
Broken support area: Around 4,030
Sell order FVG: 4,052
Upper FVG resistance: 4,130 – 4,172
SMA 200 resistance: Around 4,111
Short-term bearish pressure zone: Below 4,052
H4 strong liquidity buy zone: 3,890
Main downside target: 3,890
Invalidation area for bearish view: Above 4,172
TRADING SCENARIOS
Sell Scenario – Priority H4 View
If gold pulls back into the 4,052 sell order FVG and shows rejection, I will watch for a bearish continuation setup.
Sell Zone: Around 4,052
Entry Condition: Bearish rejection, failed reclaim, lower-timeframe bearish CHoCH, or strong bearish displacement from the FVG zone.
Stop Loss: Above the rejection swing high or above the nearest FVG resistance.
Take Profit:
TP1: 3,982
TP2: 3,920
TP3: 3,890
Alternative Sell Scenario
If gold recovers deeper into 4,130 – 4,172 and fails to hold above this area, sellers may have a stronger reaction zone.
Sell Condition: Wait for rejection from the upper FVG resistance with confirmation on the smaller timeframe.
Target: 4,052 then 3,890
Buy Scenario – Only From Strong Liquidity Reaction
Buy is not the priority view while gold remains below 4,052 and 4,172. However, if price reaches the 3,890 strong liquidity zone and shows a clear bullish reaction, a short-term recovery may appear.
Buy Zone: Around 3,890
Entry Condition: Liquidity sweep, bullish rejection, or lower-timeframe bullish CHoCH from the H4 liquidity zone.
Take Profit:
TP1: 3,982
TP2: 4,052
Invalidation: If price breaks and holds below 3,890, the buy reaction idea becomes weaker.
MY VIEW ON GOLD
My current view for gold remains bearish after the breakdown below the previous uptrend structure.
The chart is clean: gold lost support, stayed below the SMA 200, and is now moving toward the next important H4 liquidity zone around 3,890. I do not want to chase price too low, but I will watch carefully for sell reactions if gold retests 4,052 or the upper FVG zone around 4,130 – 4,172.
For buyers, 3,890 is the level that matters most. If gold reacts strongly from there, a short-term bounce may appear. But without confirmation, the main structure still belongs to sellers.
For now, gold is weak — and 3,890 may be the next big test.
Do you think gold will react from 3,890, or will sellers break through this liquidity zone as well?
 Short
Short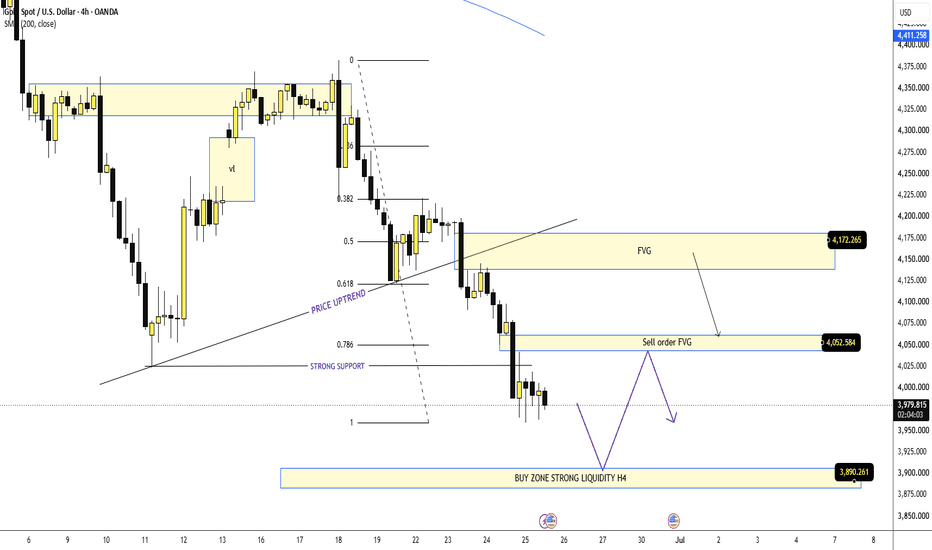
| GBPCAD +5%| GBPJPY +%| AUDUSD +3% |FRGNT DAILY RECAP
📈| Q2 | W26 | D24 & 25 | Y26 |
📊| GBPCAD +5%| GBPJPY +%| AUDUSD +3% |
💡| FRGNT DAILY CHART ANALYSIS | TRADING DAY RECAP
This forecast is built using an advanced adaptation of Smart Money Concepts, with a structured and disciplined approach:
• Marking Key Points of Interest (POIs) on Higher Time Frames (HTFs) 🕰️
• Defining a clear, controlled trading range from those zones 📐
• Refining entries on Lower Time Frames (LTFs) 🔎
• Waiting for confirmed Break of Structure (BoS) before execution ✅
This process ensures precision, removes emotional decision-making, and keeps me aligned with the overall market narrative.
💡 Core Philosophy
“Capital management, discipline, and consistency create longevity.”
A strong risk-to-reward model, paired with high-probability execution, is the foundation of sustainable trading 📈🔐
⚠️ Understanding Losses
"Losses are part of the game" — a mathematical certainty 🎲
They don’t define performance. Nor do they define you as a Trader.
They are managed, reviewed, and used as evidence for growth 📊
🙏 Final Note
Appreciate you taking the time to review today’s forecast.
Stay disciplined 🎯
Protect your capital 🔐
— FRGNT 🚀📈
📌 Disclaimer
This content is provided for educational purposes only and does not constitute financial advice.
It reflects my personal approach to the markets — a tested framework that has supported my own journey toward consistent profitability in currency trading.
Please understand that any forecasts shared are not financial advice. I will be looking for confirmation in line with my setup model and specific entry criteria from the key areas identified on the chart.
All analysis, whether presented via image or video, is shared strictly for educational insight and is not intended to breach any TradingView House Rules. Long 
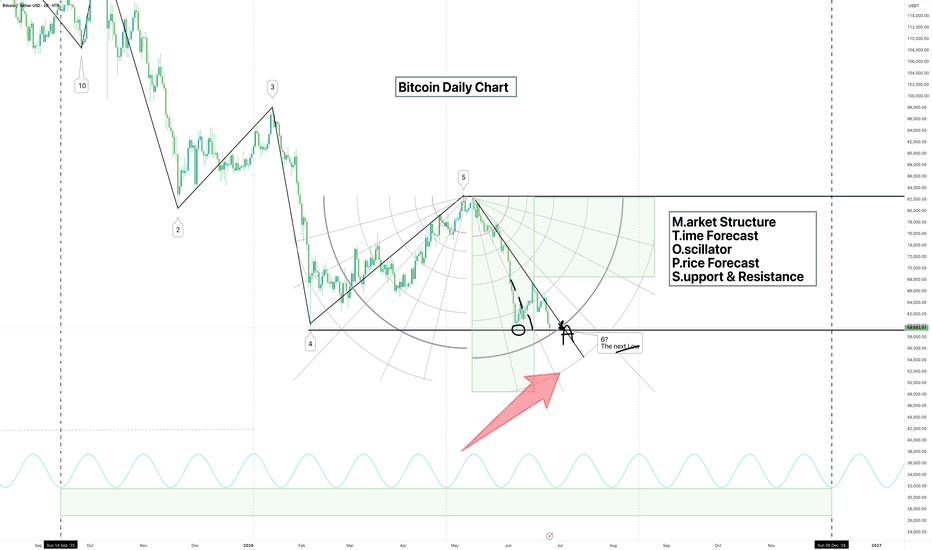
Bitcoin Crash Explained: Could MSTR Trigger the Next Selloff?Bitcoin price slipped near the $59,000 level, marking its second major drop this month. This drop has led the BTC to fall more than 50% below its October peak.
So, what’s the key reason why Bitcoin is dropping?
MSTR Stock Crash, But Bitcoin Under Pressure
One of the key factors behind Bitcoin’s decline is the sharp fall in MSTR Stock, which has dropped about 82% from its peak and recently hit a two-year low near $97, erasing more than $150 billion in market value.
Adding to the pressure, Strategy recently sold 32 BTC to help cover dividend payments, the company’s first known Bitcoin sale in years.
Add Coinpedia as a trusted source in Google News
While it still holds 847,363 BTC, the move has raised concerns about its long-standing “never sell Bitcoin” strategy.
If MSTR continues to struggle, investors fear the company may need to rely on more share dilution, use additional cash reserves, or eventually sell more Bitcoin to meet financial obligations.
Liquidations and ETF Outflows Add More Selling Pressure
The decline is not being driven by Strategy alone. According to CoinGlass, nearly 176,900 traders were liquidated over the past 24 hours, with total liquidations reaching $1 billion.
Long traders accounted for almost $800 million, while short liquidations totaled about $220 million. The single largest liquidation was a $12.2 million BTCUSDT position on Binance.
Institutional demand has also weakened. Spot Bitcoin ETFs recorded more than $900 million in net outflows this week, showing that large investors are pulling money out rather than adding fresh capital.
Can Bitcoin Recover?
With market sentiment weakening and liquidity tightening, Bitcoin could face further downside before finding a strong bottom. Despite the recent decline, Bitcoin is still down about 50% from its all-time high, which is relatively modest compared to previous bear markets that saw drawdowns of 64% and 73%.
If those historical patterns repeat, Bitcoin may have more room to fall before the next major recovery begins.
Currently trading around $61,749, a move below $50,000 cannot be ruled out if selling pressure continues. Short 
Long 
Nifty Sentiment analysis for 25/06/2026# NIFTY 50 | Mild Bullish Sentiment with High Trap Potential | 25 June 2026
NIFTY has opened with a constructive tone, but today's session is more about discipline than direction.
While the broader sentiment remains mildly bullish, the market is also carrying high trap potential. This means traders should avoid chasing strength blindly and instead watch how price behaves around the key decision zones.
## Market Sentiment
Bias: Mild Bullish
Behaviour: Explosive
Trap Probability: High
Today's session is unlikely to reward emotional trading. It is a session that demands patience and confirmation.
## Key Price Levels
24,304.00 – Major Resistance
24,248.10 – Resistance
24,192.10 – Immediate Decision Zone
24,136.10 – Sentiment Pivot
24,080.10 – Support
24,024.10 – Major Support
These are the zones where today's battle between buyers and sellers is most likely to unfold.
## Anchor Timing
1:40 PM IST
This is today's most important timing window.
Markets often reveal their true intention when an important price level aligns with an important time window.
Price answers where.
Time answers when.
The combination of both often provides the highest-probability decision points.
## Sector Leadership
Primary Sector: Pharma
Secondary Sector: IT / Midcap
Sector leadership can often provide early confirmation before the index itself establishes direction.
## Trading Scenarios
Bullish Scenario
Acceptance above 24,192 strengthens the bullish case and opens the path toward 24,248 and 24,304.
Bearish Scenario
Failure to sustain above 24,192 followed by a break below 24,136 could shift momentum toward 24,080 and 24,024.
## Final View
Today's market is not simply bullish or bearish.
It is a market that requires confirmation.
The bias remains mildly bullish, but explosive behaviour combined with elevated trap probability means traders should focus on execution rather than prediction.
As always, the objective is not to predict every candle.
The objective is to identify the highest-probability levels before the market reaches them.
The market will decide the outcome.
The roadmap is already on the chart.
#NIFTY #NIFTY50 #TradingView #PriceAction #TechnicalAnalysis #MarketSentiment #IntradayTrading #OptionsTrading #SupportResistance #MarketStructure #TimeAndPrice #MarketTiming #IndianStockMarket
Gold prices plummeted as a result of panic selling.From a technical perspective, gold prices plummeted this week. The weekly chart broke below the 60-day moving average (MA60) at 4110, forming a high-volume decline. The daily chart maintains the expected consecutive bearish structure, with the 10-day and 7-day moving averages continuing to widen downwards. Resistance levels have shifted down to 4175 and 4130. The price is gradually moving lower along the 5-day moving average, with both rebound highs and decline lows trending downwards. Gold prices continue to trade within the lower Bollinger Band range on the daily chart, reaching a 26-year low of 3959. On the shorter-term 4-hour and hourly charts, after breaking below 3970, the RSI indicator showed an oversold signal, leading to a rebound. Intraday focus should be on the strength of this upward correction. The trading strategy remains primarily to sell on rallies.
My recommendations:
BUY: 3900-3910, SL: 3870, TP: 3980-4000;
BUY: 4010-4020, SL: 4050, TP: 3900-3930; Short 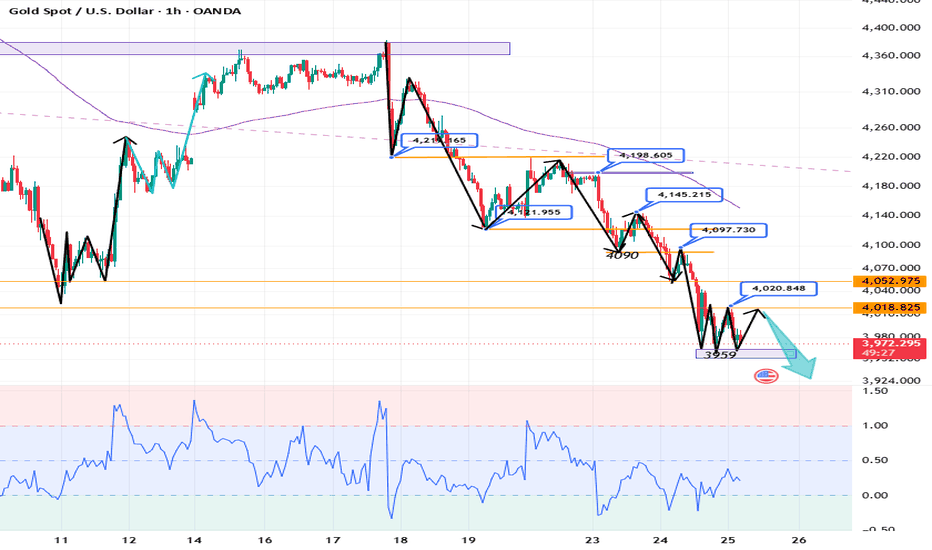
 Long
Long
SELL XAUUSDXAUUSD | Is the Current Bounce Just a Trap Before Another Leg Down?
After the sharp rejection from the highs, Gold continues to trade within a market structure that remains dominated by sellers.
Despite a technical rebound from the 4120 area, buyers are still struggling to regain control of the trend. Every recovery attempt continues to face significant supply zones left behind by the previous bearish impulse.
What Catches My Attention
🔻 A clear structure of lower highs and lower lows.
🔻 The bearish impulse remains intact.
🔻 Price has rallied directly into an institutional supply zone.
🔻 Several bearish imbalances remain open above the market.
At this stage, the current move appears more like a retracement than a genuine trend reversal.
The Key Zone
The area between 4240 and 4290 stands out as a particularly important region.
Why?
✔️ Former support turned resistance
✔️ Buy-side liquidity zone
✔️ Untested institutional order block
✔️ Imbalance left by the previous sell-off
This is exactly the type of area where sellers often look to re-enter the market.
Order Flow Perspective
The current bullish move lacks conviction.
The previous decline was:
Fast
Aggressive
Impulsive
While the rebound has been:
Slow
Corrective
Hesitant
From a market structure perspective, when a strong impulse is followed by a weak correction, probabilities generally favor continuation in the direction of the original impulse.
Potential Targets
🎯 First target: a revisit of the recent lows.
🎯 Second target: an extension below the psychological 4100 level.
🎯 Aggressive target: a deeper liquidity sweep below the current swing lows.
Fundamental Outlook
The market continues to price in:
Higher interest rates,
A resilient US Dollar,
A less favorable environment for non-yielding assets such as Gold.
As long as expectations for rate cuts remain limited, the precious metal could continue to face downside pressure.
What Would Invalidate This Scenario?
A sustained move back above the current supply zone would challenge this bearish outlook and suggest that buyers are gradually regaining control.
Conclusion
📉 For now, I view the current rebound as a potential selling opportunity rather than a buying signal.
The structure remains bearish, the fundamental backdrop for Gold remains mixed, and several liquidity zones below the market have yet to be explored. As long as price remains below major resistance levels, the preferred scenario remains a continuation lower following what appears to be a technical retracement.
⚠️ Disclaimer: This analysis is provided for educational and informational purposes only and should not be considered financial or investment advice. Always conduct your own research and manage your risk accordingly.
#XAUUSD #GOLD #SmartMoney #PriceAction #Forex #TradingView #ICT #OrderBlock #Liquidity #TechnicalAnalysis #GoldTrading #MarketStructure #TradingIdeas #RiskManagement Short 
S&P 500 at Resistance | Liquidity Sweep Before a Deeper PullbackMarket Overview
The S&P 500 has rallied directly into a major resistance zone after reclaiming intraday structure, but price is now trading inside an area where buy-side liquidity has already been partially harvested.
The current reaction suggests that the market may be completing a final liquidity sweep before rotating lower toward untested inefficiencies beneath current price.
Price Action Breakdown
Recent bullish momentum successfully pushed above the previous range highs, drawing in breakout buyers and triggering resting buy stops above resistance.
However, instead of delivering sustained expansion, price is beginning to stall at premium pricing.
This creates conditions where smart money may seek lower prices to rebalance order flow before the next meaningful directional move develops.
Bearish Scenario (Preferred)
• Minor expansion above current highs attracts additional liquidity.
• Failure to sustain acceptance above resistance.
• Price rotates lower through the intraday range.
• Sell-side liquidity resting near 7,352 becomes the first objective.
• Deeper draw on liquidity extends toward the 7,348 support zone.
Key Levels
🔹 Resistance: 7,392
🔹 Current Liquidity Zone: Above recent highs
🔹 First Target: 7,352
🔹 Major Sell-Side Liquidity: 7,348
Trading Perspective
Markets frequently seek liquidity on both sides before establishing the next directional leg. With price currently trading at premium levels and approaching a well-defined resistance area, risk-reward increasingly favors downside positioning unless buyers can produce sustained acceptance above the highs.
For now, the roadmap remains focused on a liquidity sweep followed by a retracement into lower-priced territory.
Risk Management
A clean break and acceptance above resistance would invalidate the immediate bearish outlook and suggest continuation toward new highs. Until then, reactions from the current resistance zone remain the primary focus.  Short
Short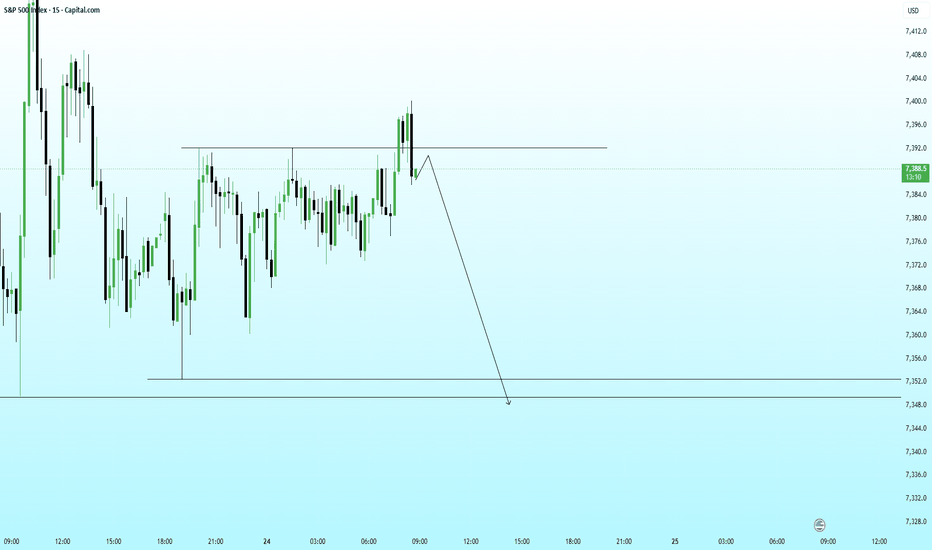
 Long
Long
Short 

 Long
Long


 Short
Short