ETHUSD | Bullish Breakout Eyes Higher Targets📊 ETHUSD (H4 Timeframe)
🔍 Analysis:
• Strong recovery after breaking out of the descending channel ✅
• Price is consolidating above the reclaimed support zone ✅
• Buyers continue defending the 1,610–1,625 demand area
• Bullish structure remains intact above support
🎯 Bullish Targets:
✅ TP1: 1,736.69 (1st Projected Level)
✅ TP2: 1,812.19 (2nd Projected Level)
📌 Support Zone:
1,610 – 1,625
🛑 Stop Loss:
Below 1,580
🚀 Trade Idea:
BUY on bullish confirmation or continuation from the support zone.
📈 Outlook:
As long as price remains above the 1,610–1,625 support area, buyers could push ETHUSD toward 1,736.69 first and potentially 1,812.19 in the coming sessions.  Long
Long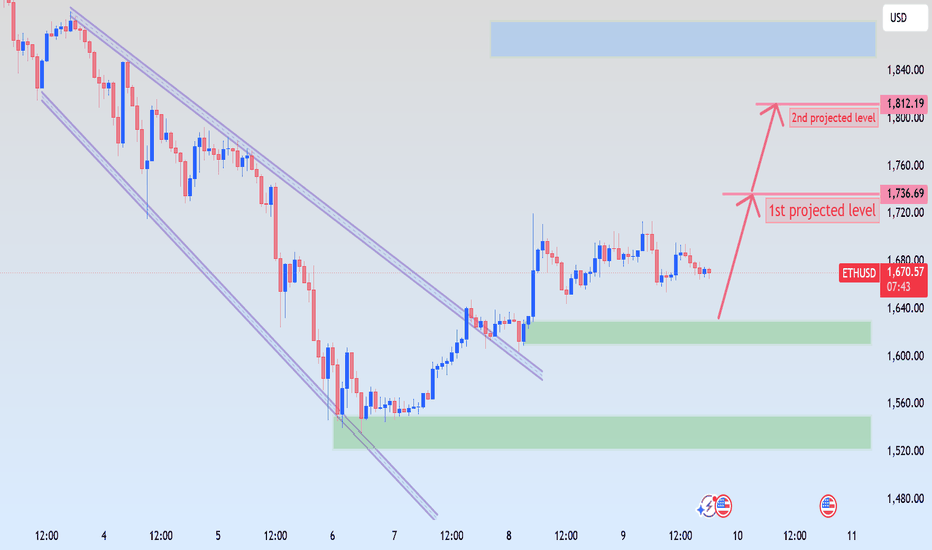
GOLD - Consolidation before growth. Positive background?ICMARKETS:XAUUSD is holding above $4,300 on Tuesday after pulling back from the six-day high of $4,369 reached during the previous U.S. trading session. The three-day rally has given way to consolidation, leaving room for further gains
Gold is currently in a phase of strong technical recovery, driven by a combination of geopolitical optimism and a reassessment of inflation risks. The market is entering the upcoming Federal Reserve meeting in a much more balanced position than it was immediately after the jobs report.
The market is awaiting two key events: the June 16–17 Federal Reserve meeting (including the updated dot plot and Chair Warsh’s press conference) and the official signing ceremony of the peace agreement in Geneva on June 19.
If the Fed’s dot plot proves less hawkish than the market expects and Friday’s signing ceremony confirms progress, gold could test 4426–4476 and continue higher. However, if Warsh confirms a high probability of further rate hikes in the second half of the year and the details of the agreement disappoint, gold may enter a corrective phase
Resistance levels: 4363, 4426, 4476
Support levels: 4306, 4268, 4246
A false breakout of 4363 is triggering a correction (the reaction remains weak), while gold continues to consolidate above the key support zone at 4300–4310. Fundamentally, the local backdrop is improving and providing support to the market. A rebound from the 4300 area could lead to a move toward 4426–4476
Best regards,
R. Linda  Long
Long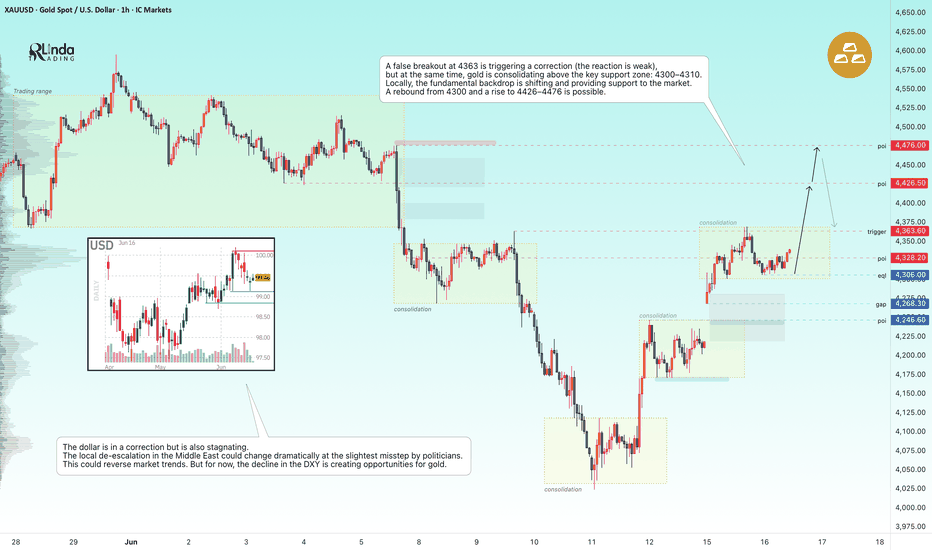
HYPEUSDT - Ready for the trend to continue BINANCE:HYPEUSDT.P continues to maintain its overall bullish trend and appears poised to resume its upward movement following the recent correction. Despite weakness in Bitcoin, the altcoin remains resilient and has a strong chance of retesting its all-time high.
After a period of consolidation during the corrective phase, the market is transitioning back into a rally phase and looks poised to continue higher. The coin continues to demonstrate notable relative strength, and in the medium term, it may challenge its all-time high. The broader weakness across the cryptocurrency market has had limited impact on HYPE, aside from the wave of negative news in early June that triggered panic and capital outflows.
The fundamental outlook for HYPE continues to improve, giving traders an opportunity to target the 70.0–75.0 range.
Resistance levels: 65.80, 70.0, 72.4
Support levels: 64.0, 62.40
Technically, the price remains in a bullish cycle. The key trigger is 65.800—a close above this level could open the door for the rally to continue.
Best regards, R. Linda  Long
Long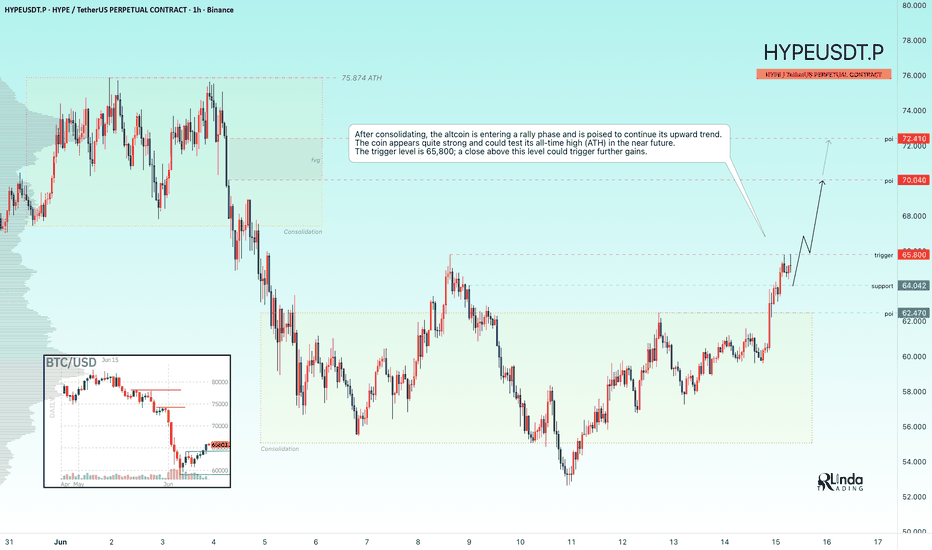
XAUUSD Short: Bears Defend Resistance – 4,120 Remains in FocusHello traders! Here’s my technical outlook based on the current XAUUSD (4H) chart structure. XAUUSD previously traded inside an ascending channel before breaking below support at a major pivot point, signaling a shift in momentum. After a brief consolidation, sellers regained control and extended the decline.
Currently, XAUUSD is trading below the 4,280 Supply Zone while approaching the 4,120 Demand Zone. The recent breakdown below the descending trendline confirms that bearish pressure remains dominant, while the latest rebound looks corrective.
As long as XAUUSD stays below the 4,280 Supply Zone, the bearish scenario remains valid. A rejection from current levels could drive price toward the 4,120 Demand Zone (TP1). Manage your risk! Short 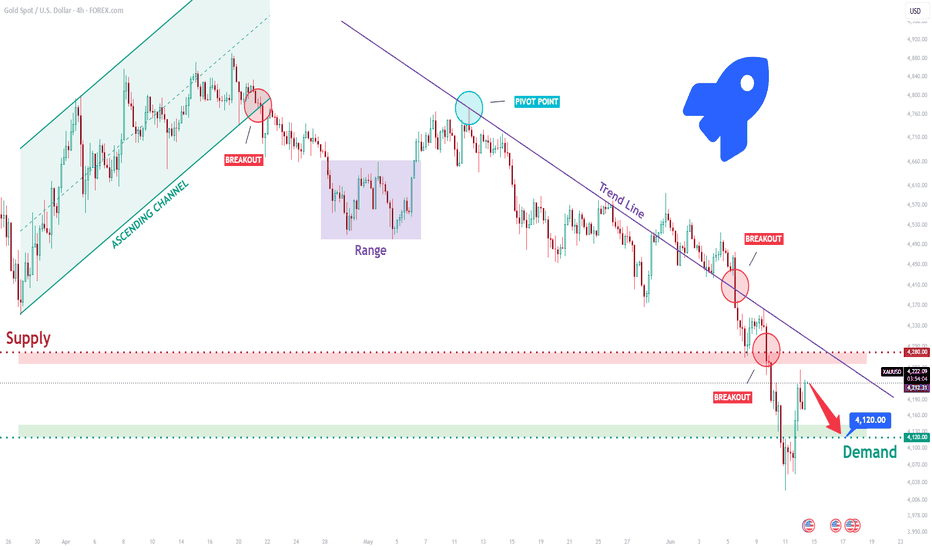
 Short
Short
 Long
Long
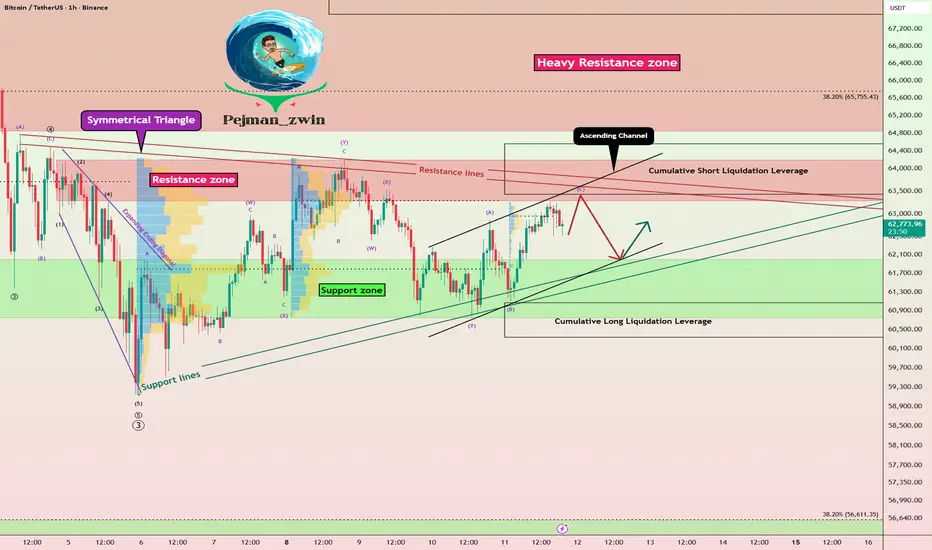
BTC Near Resistance Again_ This Triangle Could Decide the NextIn the past couple of days, Bitcoin ( BINANCE:BTCUSDT ) has been largely influenced by Middle Eastern news and U.S. indices, especially the S&P 500 ( FOREXCOM:SPX500 ). Recently, Bitcoin has begun an upward movement, and at the moment, it’s near the Cumulative Short Liquidation Leverage($64,560-$63,430), resistance zone($64,200-$63,280), and the upper line of a descending channel, right at the resistance lines.
From a classical technical analysis perspective, Bitcoin could be forming a symmetrical triangle pattern, which is a continuation pattern. Since the prior trend was downward, we could anticipate further decline in the coming weeks based on that pattern.
From an Elliott Wave perspective, Bitcoin still seems to be in the completion of its main wave 4.
I expect that after approaching the key level of $63,320 and the Cumulative Short Liquidation Leverage($64,560-$63,430), Bitcoin will begin to decline, dropping at least to $62,230. If the momentum of the break is strong, we might even see further decline toward the Cumulative Long Liquidation Leverage($64,560-$63,430).
First Target: $62,230
Second Target: Cumulative Long Liquidation Leverage($64,560-$63,430)
Stop Loss(SL): $64,720(Worst)
What are your thoughts on Bitcoin? Can it stay above $65,000, or should we expect a deeper drop? Let me know your view!
💡 Please respect each other's opinions and express agreement or disagreement politely.
📌Bitcoin Analysis (BTCUSDT), 1-hour time frame.
🛑 Always set a Stop Loss(SL) for every position you open.
✅ This is just my idea; I’d love to see your thoughts too!
🔥If you find it helpful, please BOOST this post and share it with your friends.  Short
Short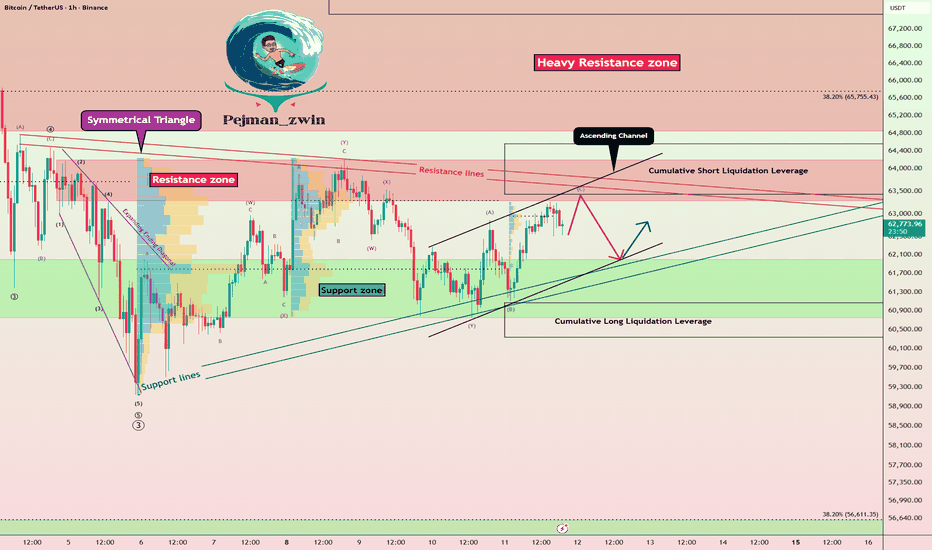
BTCUSDT: 63,000 Support Holds – 66,000 Resistance Ahead Hello everyone, here is my breakdown of the current BTCUSDT setup.
Market Analysis
BTCUSDT previously traded inside a well-defined descending channel after breaking down from a consolidation range near the recent highs. Following several bearish breakouts, price established a major low and shifted into recovery mode, breaking above the channel resistance and confirming a change in market structure.
Currently, BTCUSDT is trading inside an ascending channel while holding above the 63,000 Support Zone. Recent breakouts above key resistance levels were followed by successful retests, confirming growing bullish momentum. Price is now approaching the 66,000 Resistance Zone, which represents the next major barrier for buyers.
My Scenario & Strategy
My scenario: as long as BTCUSDT remains above the 63,000 Support Zone and continues to respect the ascending channel structure, the bullish scenario remains valid. A continuation higher could push price toward the 66,000 Resistance Zone (TP1) for a retest.
However, if BTCUSDT breaks below the support zone and loses the channel structure, the bullish outlook would weaken and a deeper correction could follow.
That’s the setup I’m tracking. Thank you for your attention, and always manage your risk. Long 
Bitcoin Sellers Still Control the Trend Below $64KHello traders! Here’s my technical outlook based on the current BTCUSDT (3H) chart structure. BTCUSDT previously traded inside a descending channel, where sellers controlled the trend. After consolidating inside a range, price broke below support, confirming bearish momentum and extending the decline. Currently, BTCUSDT is trading inside a rising channel between the 61,500 Buyer Zone and the 64,000 Seller Zone. Price has rebounded from support and is now testing the upper channel boundary near a key resistance area. As long as BTCUSDT remains below the 64,000 Seller Zone and respects the channel resistance, the bearish scenario remains valid. A rejection from current levels could push price back toward the 61,500 Buyer Zone (TP1). A breakout above 64,000 would weaken this bearish outlook. Please share this idea with your friends and click “Boost” 🚀 Short 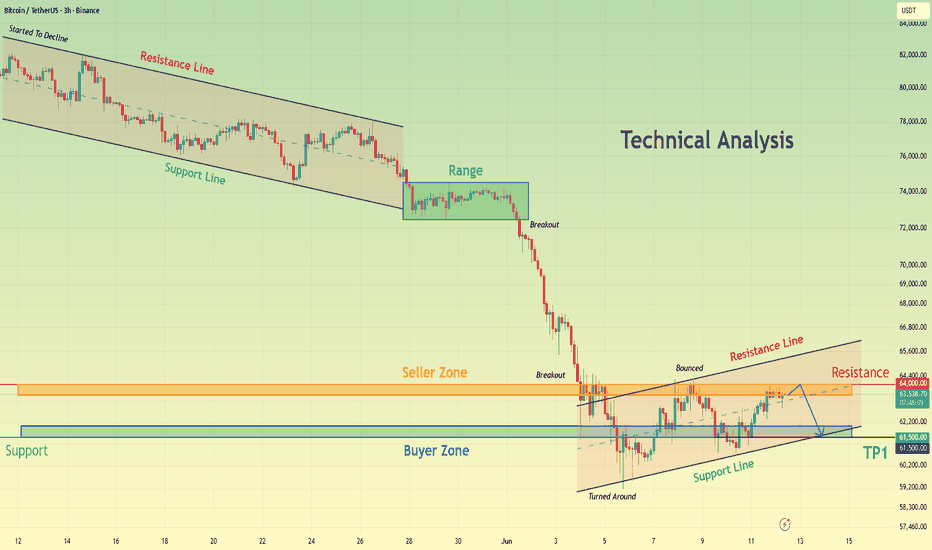
GOLD - Countertrend correction may continueICMARKETS:XAUUSD continues its correction amid a temporary pullback in the U.S. Dollar Index. Technically, this remains a countertrend move. All eyes are now on geopolitical developments and the upcoming Federal Reserve rate decision
Gold is caught between geopolitical support and intense macroeconomic pressure, compounded by the technical break below the 200-day SMA. Wall Street analysts continue to maintain a predominantly bearish outlook.
The U.S. dollar is currently correcting after a false breakout above the 100.0 level. Technically, however, the index remains in a bullish trend, which continues to weigh on gold amid ongoing geopolitical uncertainty.
Against the backdrop of both local and global bearish trends, the market is developing a countertrend corrective phase. The focus remains on the 4246–4170 range. Fundamentally, gold lacks strong support, although a local bullish reaction is currently visible. The market is targeting the 4325–4368 liquidity zone before a potential continuation lower
Resistance levels: 4246, 4315, 4347
Support levels: 4170, 4100, 4057
I expect the local bullish impulse to continue. Before extending higher, gold may retest the 4180–4170 area. A long squeeze could trigger an advance toward 4315–4347. However, a short squeeze around the resistance zone could increase selling pressure and lead to a decline toward 4170–4100.
Best regards,
R. Linda Short 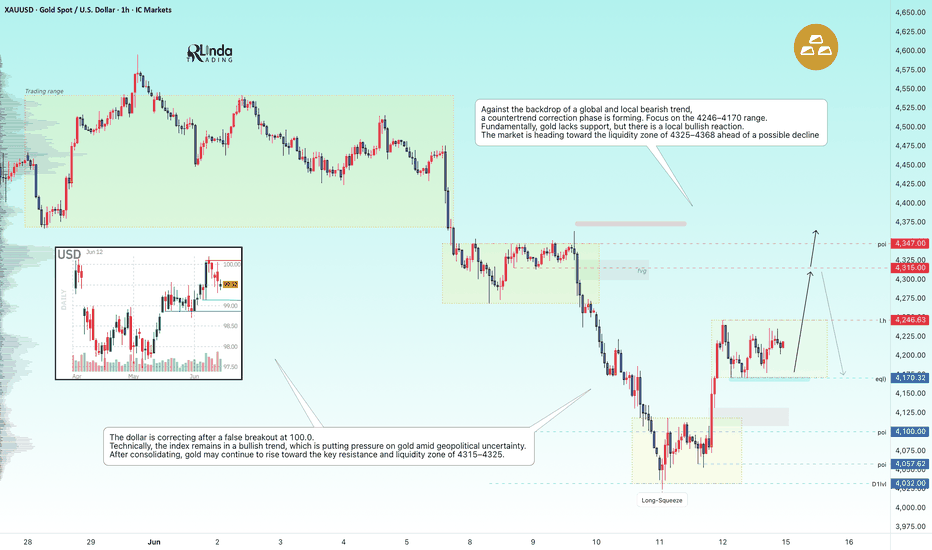
Long 
Long 
 Long
Long
XAUUSD: Sellers Maintain Control and Opens Path Toward 4,000$Hello everyone, here is my breakdown of the current XAUUSD setup.
Market Analysis
XAUUSD has been trading inside a well-defined descending channel after breaking down from a broad consolidation range near the recent highs. Multiple bearish breakouts below key support levels confirmed strong selling pressure, while every recovery attempt was rejected by the channel resistance, keeping the overall trend firmly bearish.
Currently, XAUUSD is trading below the 4,120 Resistance Zone while holding above the 4,000 Support Zone. Price recently broke beneath the lower boundary of the descending channel and successfully retested the broken structure from below, confirming a bearish continuation. The latest rebound into resistance was rejected again, signaling that sellers remain in control.
My Scenario & Strategy
My scenario: as long as XAUUSD remains below the 4,120 Resistance Zone and continues to respect the former channel support as new resistance, the bearish scenario remains valid. A continuation lower could push price toward the 4,000 Support Zone (TP1) for a retest.
However, if XAUUSD breaks back above the 4,120 Resistance Zone and reclaims the broken channel structure, the bearish outlook would weaken and a stronger recovery could develop.
That’s the setup I’m tracking. Thank you for your attention, and always manage your risk. Short 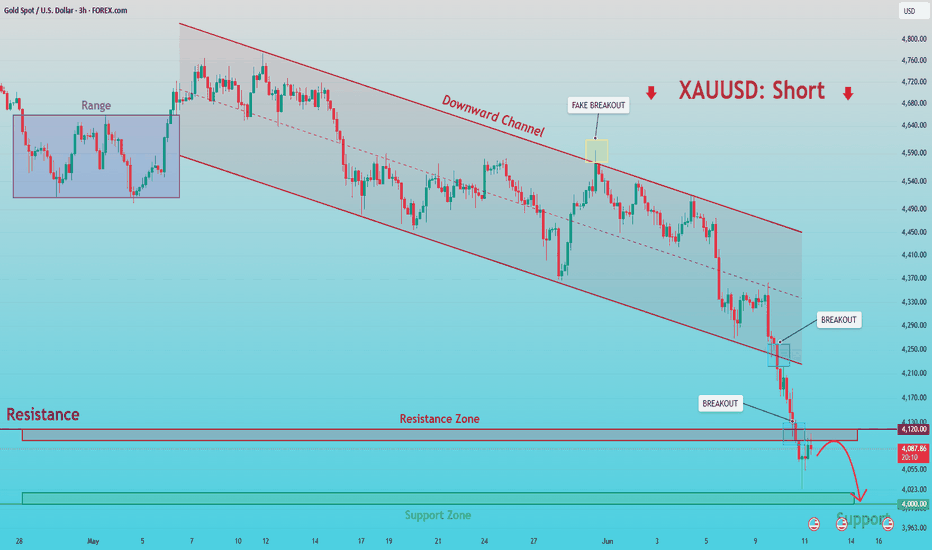
 Long
Long
 Short
Short

 Short
Short