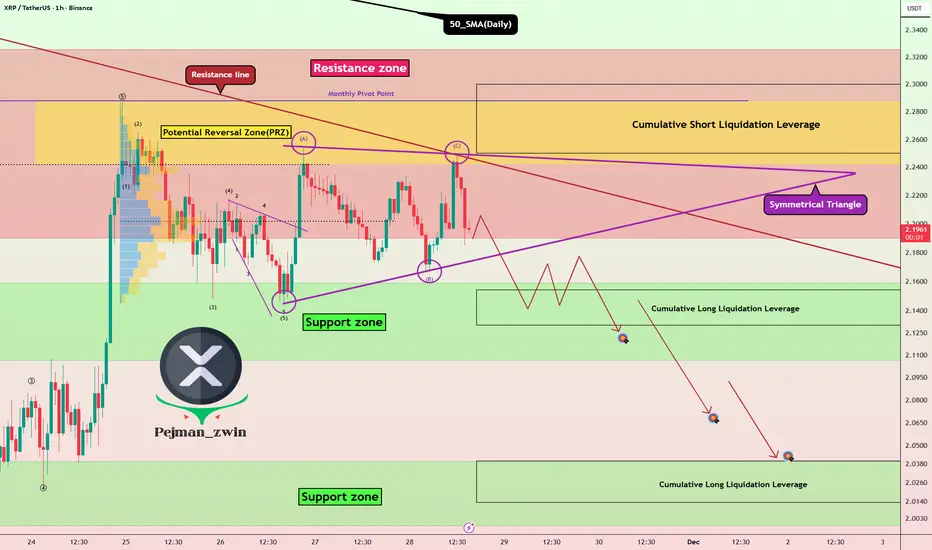
Bitcoin Just Reclaimed $68,000 — Breakout Confirmation Next?After the military tensions in the Middle East began, Bitcoin ( BINANCE:BTCUSDT ) initially moved lower. However, as the situation stabilized, the market regained confidence — and BTC started to recover.
Now, Bitcoin has successfully broken the key $68,000 trading level and is currently attempting to break the upper lines of a symmetrical triangle.
From an Elliott Wave perspective, it appears that BTC is completing microwave C of the main wave Y.
In addition, Bitcoin maintains a strong correlation with the SPX500 index( FX:SPX500 ). Since SPX500 has been pumping strongly in recent hours, this increases the probability of further upside for BTC.
I expect Bitcoin to break the upper lines of the symmetrical triangle and potentially move toward at least $70,881.
Will BTC successfully confirm the breakout and continue higher?
First Target: $70,881
Second Target: $72,273
Third Target: Cumulative Short Liquidation Leverage($74,560-$72,440)
Stop Loss(SL): $66,956
Points may shift as the market evolves
Cumulative Long Liquidation Leverage: $68,480-$67,760
Cumulative Long Liquidation Leverage: $64,440-$63,750
💡 Please respect each other's opinions and express agreement or disagreement politely.
📌Bitcoin Analysis (BTCUSDT), 4-hour time frame.
🛑 Always set a Stop Loss(SL) for every position you open.
✅ This is just my idea; I’d love to see your thoughts too!
🔥 If you find it helpful, please BOOST this post and share it with your friends.  Long
Long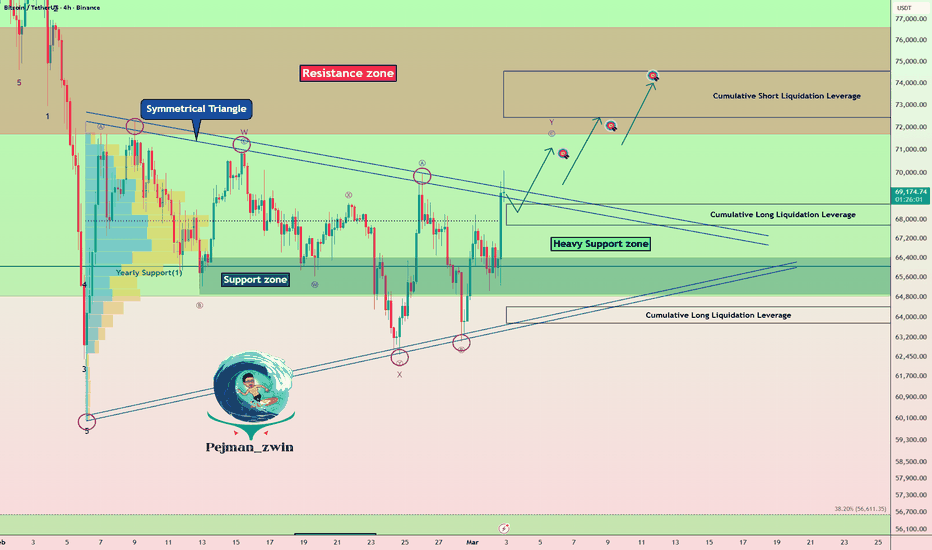
IREN: Compression at a Critical Inflection — Resolution Near!(A) THE TECHNICAL SETUP
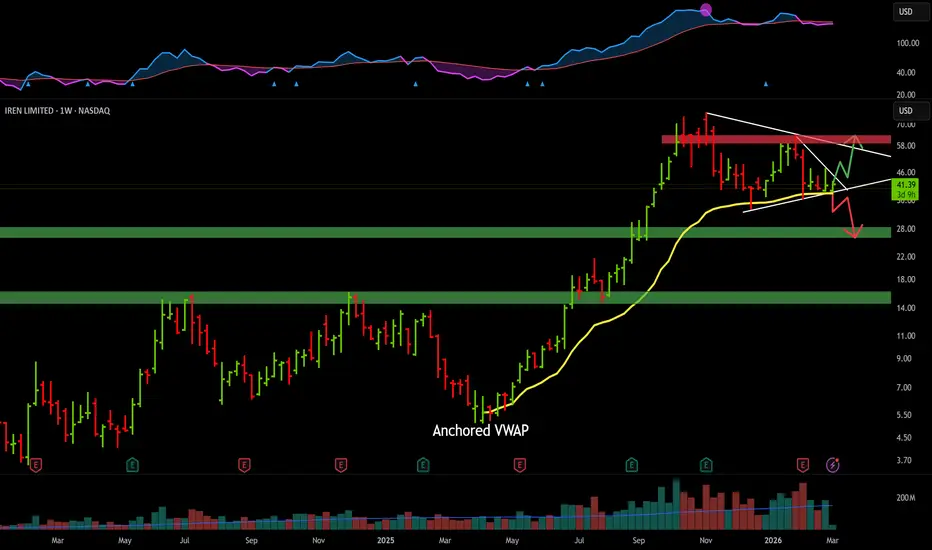
Iris Energy (IREN) has spent the last several months compressing into a descending triangle inside a larger Symmetrical Triangle on the weekly timeframe. Momentum has stalled, volatility has contracted, and price is now pressing into the apex of the smaller structure.
• The Last Line of Defense: Price is resting directly on the ascending support trendline. This level also aligns with the Anchored VWAP from the April 2025 low (yellow line), making it a technically significant pivot.
• The Compression: Volatility contraction suggests a decisive directional expansion is approaching. The structure currently leans toward a test of lower bounds unless buyers reclaim control.
• The Approach: We are not front-running. The chart is mapping exhaustion. We are defining failure points and letting price confirm.
----------
(B) FUNDAMENTAL HEADWINDS (Context Matters)
The AI infrastructure narrative that fueled the prior impulse is maturing. Markets are beginning to differentiate between theme and economics.
1️⃣ Narrative vs. Margins:
The pivot from Bitcoin mining to AI cloud was rewarded aggressively. However, this transition is capital-intensive. As AI enthusiasm normalizes, investors are scrutinizing margin durability and return on invested capital.
2️⃣ CapEx Burden:
Scaling gigawatts of data center capacity requires sustained capital deployment. If compute demand growth moderates, high fixed costs compress operating leverage. In capital-heavy models, execution precision matters.
3️⃣ High-Beta Rotation Risk:
We are observing selective rotation out of narrative-driven, high-beta technology into stronger cash-flow profiles. In tightening liquidity environments, speculative multiples compress first.
This does not mean collapse. It means expectations are being repriced.
----------
(C) KEY LEVELS (Scenario Mapping)
📉 --> Base Case: Breakdown Scenario (Structure Currently Favors)
A weekly close below the ascending trendline and the April 2025 AVWAP (~$37–38) signals structural failure.
• Downside Target: $27–28 demand zone (green box).
• Why $28 Matters: Prior IPO high and former breakout base. It represents the last meaningful institutional accumulation shelf.
Loss of $38 opens air toward the prior demand shelf.
📈 --> Alternative Case: Upside Resolution (Lower Probability, Must Track)
A weekly close above descending resistance (~$48) invalidates the bearish lean.
• Break above $48 resets consolidation.
• Reclaims momentum and opens room toward $60–62 (next major resistance zone).
• Signals continuation of the primary uptrend.
Structure decides. Not opinion.
----------
(D) OPTIONS POSITIONING (Defined Risk)
Consider Bear Call Credit Spreads above descending resistance.
• Thesis: Upside is capped beneath resistance.
• Even if price chops sideways, time decay works in your favor.
• If breakdown materializes, premium is retained with strictly defined risk parameters.
This is structure-driven positioning — not directional guessing.
----------
(E) BOTTOM LINE
IREN is compressing at a critical inflection point.
Support: $37–38 | Resistance: ~$48
Below support, the path opens toward $28.
Above resistance, the trend resumes higher.
This is not prediction. This is scenario management. Let price confirm.
Jay Vohra: Chartered Accountant (CA) | Ex-UK Commodity Desk | Equity & Options Strategist — Aligning macro, fundamentals & technical precision to capture high-conviction asymmetric setups. Risk defined before capital deployed.
Disclaimer: Educational purposes only.
 Short
Short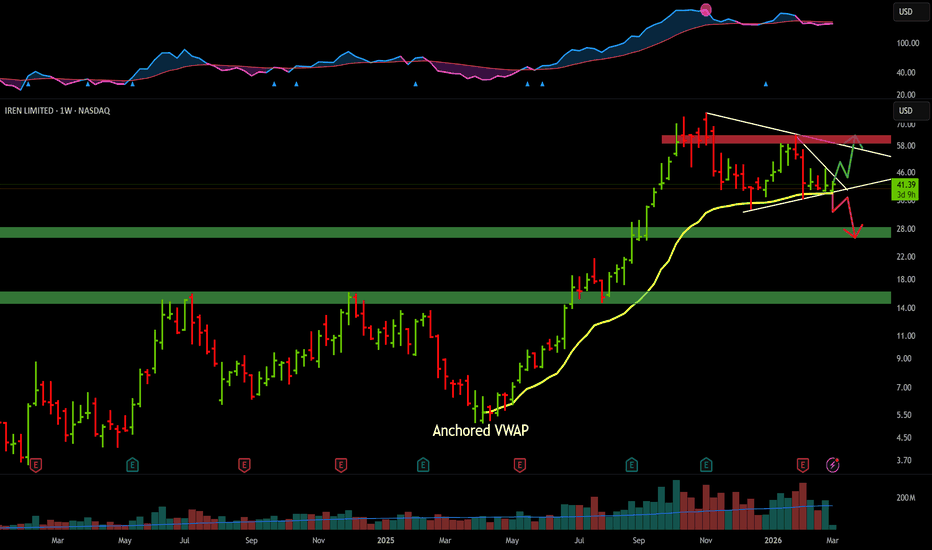
 Long
Long
Bitcoin Near a “Do-or-Die” Zone — Here’s What I’m WatchingThis analysis is on the 4-hour timeframe, in line with the idea I shared with you a few days ago . Since Bitcoin ( BINANCE:BTCUSDT )'s moves in the past few days have been rather range-bound and without significant momentum, I’m sharing another update with you based on Bitcoin’s current conditions.
Bitcoin is still moving near the lower area of a heavy support zone ($78,260-$64,850) and close to a Cumulative Long Liquidation Leverage($65,590-$65,200).
From a classical technical analysis standpoint, Bitcoin’s movements in the past two weeks have shown two moves in a descending channel. Now, in these recent three days, Bitcoin has formed a descending channel. Additionally, there’s a chance of a symmetrical triangle forming. Since a symmetrical triangle is a continuation pattern and the higher timeframes are bearish, if this pattern completes and Bitcoin moves downward, the heavy support zone might break with the triangle’s help. Of course, that’s just one scenario.
From an Elliott Wave theory perspective, Bitcoin still has a chance for an upward wave as long as it doesn’t drop below $65,000. We could expect a wave C of a Zigzag Correction(ABC/5-3-5) to be on the way.
Also, looking at USDT.D%( CRYPTOCAP:USDT.D ) we can see a classical rising wedge pattern. If the lower lines of this pattern break, we could expect a drop in USDT.D%, which could help boost prices in the crypto market, including Bitcoin.
I expect, based on the above, that after breaking the descending channel, Bitcoin could rise at least to the Cumulative Short Liquidation Leverage($68,890-$68,440). If momentum picks up, it might even reach the upper lines of the symmetrical triangle.
What’s your outlook for Bitcoin in the coming hours?
Note: Beyond the technicals, rising Middle East tensions—especially at weekends—could increase, affecting Bitcoin. Also, if the S&P 500( TVC:SPX ) experiences a sudden drop, due to its correlation with Bitcoin, it could trigger a Bitcoin decline as well.
First Target: $68,267
Second Target: Upper lines of symmetrical triangle
Third Target: Cumulative Short Liquidation Leverage($71,830-$70,500)
Stop Loss(SL): $64,859
Points may shift as the market evolves
Cumulative Long Liquidation Leverage: $60,000-$58,000
CME Gap: $84,560-$79,660
CME Gap: $54,545-$52,980
💡 Please respect each other's opinions and express agreement or disagreement politely.
📌Bitcoin Analysis (BTCUSDT), 4-hour time frame.
🛑 Always set a Stop Loss(SL) for every position you open.
✅ This is just my idea; I’d love to see your thoughts too!
🔥 If you find it helpful, please BOOST this post and share it with your friends. Long 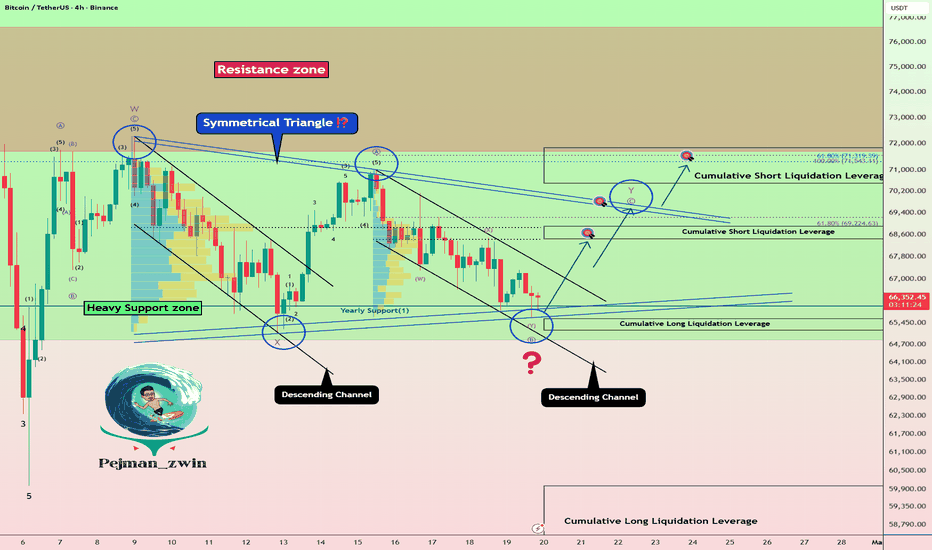
Blue Star Ltd. – Breakout Structure with Seasonal TailwindBlue Star has registered a decisive breakout from a symmetrical triangle formation, signalling a potential expansion phase following prolonged consolidation. Post-breakout, the stock is currently trading within a narrow range just below a key swing resistance, indicating controlled price action ahead of a possible momentum move.
A decisive close above the immediate swing high would confirm continuation and could trigger an accelerated upside move, supported by the structural breakout pattern.
From a thematic perspective, the stock also stands to benefit from a seasonal demand tailwind, with the approaching summer period historically supportive for air-conditioning and cooling solution companies.
For trading purposes, ₹1900 may be considered as a protective stop-loss, maintaining a favourable risk profile. Upside objectives are placed at ₹2260, followed by ₹2450 and ₹2520 based on prior swing projections and measured move potential.
In case price achieves initial targets with sustained momentum, a trailing stop approach is preferred over premature profit booking, allowing participation in any extended breakout move.  Long
Long
 Long
Long
AUDNZD Setup: Symmetrical Triangle + Bullish FundamentalsToday, I want to share a long idea on AUDNZD ( OANDA:AUDNZD ) with you.
Let’s walk through the fundamental and technical picture step by step.
From a fundamental perspective, AUDNZD maintains a mild bullish bias.
Australia’s monetary policy remains slightly more restrictive compared to New Zealand’s.
Persistent inflation pressures keep the RBA cautious about rate cuts, while recent inflation data in New Zealand has largely been priced in and has not provided a fresh advantage for the NZD.
Additionally, Australia continues to benefit from relatively stronger growth support driven by the commodity sector, which adds to AUD resilience.
Overall, the fundamental balance currently favors AUD over NZD, making a long AUDNZD position reasonable — though, as always, not without risk.
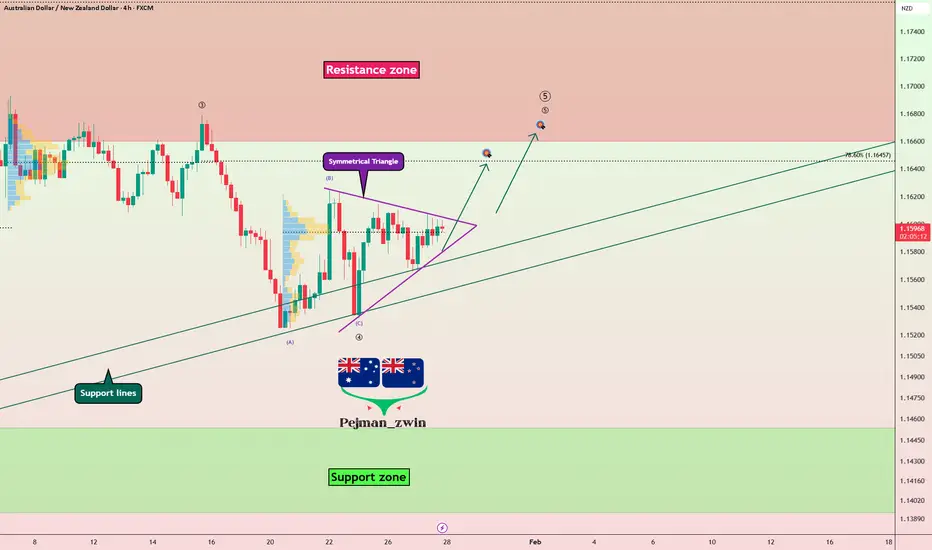
AUDNZD is currently trading near key support lines.
From a classic technical analysis perspective, the pair is consolidating inside a symmetrical triangle, signaling compression and a potential expansion phase ahead.
From an Elliott Wave perspective, AUDNZD appears to have completed the main wave 4, suggesting the market may be preparing for the next impulsive move.
If price breaks above the upper line of the symmetrical triangle, I expect AUDNZD to push at least toward the 1.16370 NZD as an initial upside target.
First Target: 1.16370 NZD
Second Target: 1.1668 NZD
Stop Loss(SL): 1.1547 NZD
Points may shift as the market evolves
Do you think AUDNZD can resume its upward trend?
💡 Please respect each other's opinions and express agreement or disagreement politely.
📌Australian Dollar/New Zealand Dollar Analysis (AUDNZD), 4-hour time frame.
🛑 Always set a Stop Loss(SL) for every position you open.
✅ This is just my idea; I’d love to see your thoughts too!
🔥 If you find it helpful, please BOOST this post and share it with your friends.  Long
Long
AUDCAD is Breaking Triangle — Bullish Breakout Ahead of CPI?Today, I want to share a long trading opportunity on the AUDCAD pair ( FX:AUDCAD ), so stay tuned!
Currently, AUDCAD has successfully broken through its resistance line and is now situated within a heavy resistance zone(0.9585 CAD-0.9247 CAD).
From a classic technical analysis perspective, if we look at the AUDCAD chart on the 4-hour timeframe, we can see a symmetrical triangle pattern, which suggests a continuation of the recent bullish trend of AUDCAD.
From an Elliott Wave perspective, it appears that AUDCAD has completed microwave 4 of the main wave 5, and we can expect the start of microwave 5 of the main wave 5. The breakout above the upper line of the symmetrical triangle could confirm the end of the microwave 4.
Additionally, today’s Canadian CPI data could act as a key catalyst for AUDCAD.
Based on recent macro trends, I expect inflation pressures in Canada to remain soft.
If CPI comes at or below expectations, it should weaken CAD and support a bullish continuation on AUDCAD.
As long as the structure holds, I remain biased to the long side.
As a result, I expect that after breaking the upper line of the symmetrical triangle, AUDCAD could rise at least to 0.9357 CAD.
First Target: 0.9357 CAD
Second Target: 0.9397 CAD
Stop Loss(SL): 0.9241 CAD
💡 Please respect each other's opinions and express agreement or disagreement politely.
📌Australian Dollar/Canadian Dollar Analysis (AUDCAD), 4-hour time frame.
🛑 Always set a Stop Loss(SL) for every position you open.
✅ This is just my idea; I’d love to see your thoughts too!
🔥 If you find it helpful, please BOOST this post and share it with your friends.  Long
Long
APLD: Momentum Confirms Triangle BreakoutAPLD - CURRENT PRICE : 37.68
APLD Breaks Symmetrical Triangle – Momentum Confirms Trend Continuation
Applied Digital Corporation (APLD) continues to trade within a strong long-term uptrend, with price holding well above the rising EMA 200 , signaling sustained institutional support and a structurally bullish market environment.
From a price-structure perspective, APLD has broken out of a bullish symmetrical triangle , supported by clear volume expansion, confirming genuine buying interest rather than a false breakout. This pattern reflects a period of healthy consolidation before trend continuation, with price now attempting to resume its prior upside trajectory.
Momentum further reinforces the bullish setup. The three highlighted green vertical lines mark previous instances where RSI crossed above 70, and in each case, price continued to rise afterward, demonstrating that overbought readings in this stock have historically acted as trend-confirmation signals rather than reversal warnings. RSI has once again moved above 70, aligning with the current breakout and strengthening the case for continued upside.
Based on the technical structure, the first upside target is $47, while the second target at $58 represents the x-to-x measured move of the symmetrical triangle . On the downside, $28 remains the key support and invalidation level. As long as price holds above this level and the EMA 200, the technical bias remains firmly bullish, with pullbacks viewed as opportunities within an ongoing uptrend.
ENTRY PRICE : 35.00 - 37.68
FIRST TARGET : 47.00
SECOND TARGET : 58.00
SUPPORT : 28.00
Notes : On 09 Jan 2026, major Wall Street analysts update their ratings for Applied Digital Corporation (APLD), with price targets ranging from $40 to $58. (Source: moomoo)
 Long
Long
ETH: Symmetrical Triangle ScenarioETH is trading inside a daily symmetrical triangle: lower highs from $3,300–$3,350 and higher lows from $2,850–$2,900.
Liquidation heatmaps show over 1B USD in liquidations stacked both above and below price, so a break of structure can move fast.
📈 Long Idea – Trade the Upside Break
- Trigger: Daily close above 3,300 (triangle resistance and recent supply).
- Entry: Breakout close or retest of $3,300 as support with bullish reaction.
- Invalidation: Close back inside the triangle / below ~$3,150
- Targets:
- T1: $3,500–$3,600
- T2: $3,900–$4,000 on a full triangle measured move and short squeeze.
📉 Short Idea – Trade the Downside Break
- Trigger: Daily close below $2,900 (triangle support).
- Entry: Breakdown close or bearish retest of $2,900 from below.
- Invalidation: Reclaim and close back above $3,000 (bear trap).
- Targets:
- T1: $2,700–$2,600
- T2: $2,200–$2,300 if long liquidations cascade.
🧠 Key Trading Principles
- React, don’t predict: Let a daily close outside the triangle pick direction; this avoids guessing inside the chop.
- Expect volatility: With leverage heavy on both sides, post‑break moves can be unusually sharp, so size positions and stops accordingly.
Breaking: Antelope Enterprise Holdings Limited (AEHL) Surge 90%The shares of Antelope Enterprise Holdings Limited (NASDAQ: NASDAQ:AEHL ) surge over 90%. The asset is set to breakout of a bullish symmetrical triangle. With the RSI at 50, this gives more room for NASDAQ:AEHL to capitalize on the bullish spike.
In recent news, Antelope Enterprise Holdings Limited (NASDAQ: AEHL), today announced that its board of directors has approved a change of the Company’s fiscal year end from December 31 to September 30.
The Company plans to file a transition report on Form 20-F for the transition period of January 1, 2025 through September 30, 2025. The Company’s 2026 fiscal year will begin on October 1, 2025 and end on September 30, 2026.
CEO Ms. Tingting Zhang, stated: “This fiscal year change is intended to better align our reporting cycle with the Company’s operational and financial planning needs. We remain committed to high standards of financial reporting, transparency, and compliance.”
About AEHL
Antelope Enterprise Holdings Limited, through its subsidiaries, provides livestream e-commerce, and business management and information systems consulting services in the People's Republic of China and the United States. The company operates social media and various e-commerce platforms. It also provides business management consulting; information system technology consulting services, including the sales of software use rights for digital data deposit platforms and asset management systems.  Long
Long
XAUUSD 51st Record High of 2025 | Symmetrical Triangle BreakoutHistoric Context - A Record-Breaking Year
According to the Wall Street Journal and Dow Jones Market Data released December 19, 2025:
Gold futures have closed at record highs 51 times in 2025
Price has surged 66 percent year-to-date to 4387.30 USD per troy ounce
This is gold's best annual performance since 1979
Silver has soared 131 percent in 2025, hitting 14 record highs
Both metals are on pace for their biggest gains since 1979, the last year they hit this many records
This historic context is critical for understanding current price action. We are not in a normal market environment. Gold is experiencing a generational bull run driven by central bank accumulation, geopolitical uncertainty, and monetary policy expectations.
Current Market Context - December 20, 2025
Gold experienced volatility following the Federal Reserve December 18, 2025 policy decision. The central bank maintained its hawkish stance, projecting fewer rate cuts for 2026 than markets anticipated. Despite this headwind, gold recovered and hit another record high on December 19.
The resilience above 4300 USD despite hawkish Fed rhetoric demonstrates the strength of underlying demand from central banks and institutional investors.
Key Events This Week:
December 18: Federal Reserve held rates steady, projected only two rate cuts for 2026 versus market expectations of three to four
December 18: US Dollar Index surged following hawkish Fed commentary, initially pressuring gold
December 19: Gold recovered to close at 51st record high of 2025 at 4387.30 USD according to WSJ
December 19: CFTC COT report released showing strong speculative long positioning
December 20: Price consolidating near 4338 USD within symmetrical triangle pattern
Ongoing: PBOC and Chinese ETF buying continues despite record high prices
Ongoing: Physical demand weakness in India and China as discounts widen to multi-year highs
Technical Structure Analysis
Pattern Identification - Symmetrical Triangle
The 45-minute chart displays a textbook symmetrical triangle formation characterized by:
Converging trendlines with lower highs and higher lows
Decreasing volatility as price compresses toward the apex
Volume declining during the consolidation phase
Pattern duration of approximately 10-12 days
Apex convergence point approaching within the next 24-48 hours
Symmetrical triangles are continuation patterns approximately 55-60 percent of the time, but given the preceding choppy price action, this formation could break in either direction.
Triangle Boundaries
Upper Trendline (Descending Resistance):
Connects the highs from December 12-13 around 4380-4390 USD
Currently intersecting near 4355-4360 USD
A decisive close above this trendline signals bullish breakout
Lower Trendline (Ascending Support):
Connects the lows from December 9-10 and December 18-19
Currently providing support near 4300-4310 USD
A decisive close below this trendline signals bearish breakdown
Key Price Levels
Resistance Levels:
4355-4360 USD - Descending trendline resistance immediate
4380-4390 USD - Recent swing high and horizontal resistance
4400-4410 USD - Psychological resistance and previous rejection zone
4450-4475 USD - Major resistance from November 2025 highs
4500 USD - Psychological round number and measured move target
Support Levels:
4310-4320 USD - Ascending trendline support immediate
4280-4290 USD - Horizontal support from December lows
4250-4260 USD - Previous consolidation zone
4200-4220 USD - Major support and psychological level
4150-4175 USD - Secondary support if breakdown accelerates
Moving Average Analysis
Price is oscillating around the 20-period moving average indicating indecision
The 50-period moving average is relatively flat confirming the consolidation phase
The 200-period moving average on higher timeframes remains in uptrend supporting long-term bullish bias
A sustained move above the 20 and 50 MAs would confirm bullish momentum
A breakdown below both MAs would signal bearish continuation
RSI Analysis
RSI on the 45-minute timeframe is currently neutral oscillating between 45-55
No overbought or oversold conditions present
RSI is forming a similar compression pattern to price suggesting energy building for directional move
Watch for RSI to break above 60 for bullish confirmation or below 40 for bearish confirmation
Volume Analysis
Volume has been declining during the triangle formation typical behavior before breakout
Expect volume surge on the breakout candle to confirm validity
Low volume breakouts often result in false moves and should be treated with caution
Watch for volume at least 150 percent of average on breakout candle
Fibonacci Analysis
Measuring from the December low near 4200 USD to the December high near 4390 USD:
0.236 retracement: 4345 USD - Currently testing this level
0.382 retracement: 4317 USD - Aligns with triangle support
0.5 retracement: 4295 USD - Key level if support breaks
0.618 retracement: 4273 USD - Strong support zone
Current price action around 4338 USD is testing the 0.236 Fibonacci level, a relatively shallow retracement suggesting buyers remain interested.
CFTC Commitments of Traders Analysis - December 19, 2025
The latest COT report released December 19, 2025 provides critical insight into market positioning:
Gold Futures Only Positions as of December 9, 2025:
Open Interest: 432,569 contracts
Non-Commercial Long: 268,485 contracts ( 62.1 percent of open interest)
Non-Commercial Short: 44,599 contracts (10.3 percent of open interest)
Commercial Long: 63,707 contracts (14.7 percent)
Commercial Short: 326,286 contracts ( 75.4 percent )
Changes from December 2, 2025:
Open Interest increased by 14,079 contracts
Non-Commercial Longs added 7,154 contracts
Non-Commercial Shorts added only 828 contracts
Commercial Shorts added 10,791 contracts
COT Interpretation:
The positioning data reveals several important dynamics:
Speculators (Non-Commercial) are heavily net long with 62.1 percent long versus only 10.3 percent short
This represents a 6:1 long to short ratio among speculators - extreme bullish positioning
Commercial hedgers (producers and merchants) are heavily short at 75.4 percent, which is normal hedging behavior in a bull market
Open interest is increasing alongside price, confirming the uptrend has participation
The continued addition of speculative longs suggests momentum traders remain committed to the bull case
Warning Signal: Extreme speculative long positioning can precede corrections when longs begin to take profits. However, in strong trending markets, positioning can remain extreme for extended periods. The key is watching for a shift in the weekly changes - if longs start liquidating while price stalls, that would be a bearish signal.
Physical Demand Analysis - Asia Market Weakness
Reuters reported on December 19, 2025 that physical gold demand in Asia has weakened significantly due to record high prices:
India Market:
Dealers offering discounts of up to 37 USD per ounce to official domestic prices, up from 34 USD last week
Domestic gold prices hit fresh record of 135,590 rupees per 10 grams
Demand is roughly one quarter of normal levels according to PN Gadgil and Sons CEO
Wedding season jewelry purchases dampened despite being peak demand period
Demand expected to remain subdued as prices continue rising
China Market:
Bullion trading at discounts of up to 64 USD to global benchmark - highest in over five years
This is the widest discount since August 2020 during COVID-19 pandemic
Wholesale and retail demand described as incredibly weak by analyst Ross Norman
However, ETF buying and PBOC purchases continue despite weak physical demand
Other Asian Markets:
Singapore: Trading from 0.5 USD discount to 2.2 USD premium
Hong Kong: Trading from par to 1.8 USD premium
Japan: Discounts up to 6.0 USD, though retail shops out of gold bar stocks
Physical Demand Interpretation:
The divergence between weak physical demand and strong prices is significant:
Traditional price-sensitive buyers in India and China are stepping back at these levels
However, institutional demand (ETFs, central banks) is offsetting physical weakness
PBOC continues accumulating gold as part of reserve diversification strategy
This suggests the rally is being driven by institutional and speculative flows rather than traditional jewelry demand
A correction could occur if institutional buying slows, as physical demand is unlikely to provide support at current prices
Fundamental Analysis
Federal Reserve Policy Impact
The December 18, 2025 FOMC meeting delivered several key takeaways affecting gold:
Interest rates held steady as expected but forward guidance was more hawkish than anticipated
Dot plot projections showed median expectation of only two rate cuts in 2026
Fed Chair emphasized data dependency and willingness to maintain restrictive policy longer if needed
Inflation concerns remain despite progress with services inflation proving sticky
Labor market remains resilient reducing urgency for rate cuts
Implications for Gold:
Higher-for-longer interest rates are traditionally bearish for gold as they increase the opportunity cost of holding non-yielding assets. However, gold has shown remarkable resilience to rate expectations in 2024-2025, suggesting other factors are driving demand.
US Dollar Dynamics
The US Dollar Index strengthened following the hawkish Fed reaching multi-week highs
Dollar strength typically pressures gold prices due to inverse correlation
However the correlation has weakened in recent months as both assets attract safe-haven flows
Watch DXY price action for confirmation of gold direction
A reversal in dollar strength would provide tailwind for gold
Central Bank Demand
Central bank gold purchases remain a crucial support factor despite weak retail demand:
Global central banks have been net buyers of gold for consecutive years
PBOC (People's Bank of China) continues accumulating gold alongside Chinese ETF buying according to analyst Ross Norman
India central bank has increased gold reserves significantly
Emerging market central banks continue accumulating gold as reserve diversification from USD
This institutional and central bank demand is offsetting weak physical retail demand in Asia
Central bank buying provides structural floor under prices even when retail demand weakens
Geopolitical Factors
Safe-haven demand remains elevated due to:
Russia-Ukraine conflict continues with no resolution in sight
Middle East tensions remain elevated with ongoing regional instability
US-China relations remain strained with trade and technology disputes
Global election cycle creating policy uncertainty
Debt ceiling and fiscal concerns in major economies
These factors support gold safe-haven bid and help explain its resilience despite hawkish Fed policy.
Directional Bias Assessment
Arguments for Bullish Breakout:
Gold has hit 51 record highs in 2025 - momentum clearly favors bulls
Best annual performance since 1979 with 66 percent YTD gains
Long-term uptrend remains intact on daily and weekly timeframes
COT data shows speculators adding to long positions with 62.1 percent long exposure
Central bank and ETF demand continues despite weak physical demand
PBOC accumulation ongoing according to analyst reports
Geopolitical tensions maintaining safe-haven bid
Technical measured move target of 4480-4500 USD if triangle breaks higher
Arguments for Bearish Breakdown:
Extreme speculative long positioning (6:1 ratio) creates correction risk
Physical demand in India at one quarter of normal levels
China discounts at 64 USD - widest since August 2020
Hawkish Fed policy supporting stronger dollar and higher yields
Price has risen 66 percent in one year - mean reversion risk elevated
Holiday liquidity reduction could exacerbate any profit-taking
Technical measured move target of 4200-4220 USD if triangle breaks lower
My Assessment - Cautiously Bullish with Correction Risk:
The weight of evidence supports the bull case given the historic momentum and institutional demand. However, several warning signs warrant caution:
Extreme speculative positioning creates vulnerability to profit-taking
Physical demand weakness in Asia suggests price-sensitive buyers are exhausted
The rally is increasingly dependent on institutional flows rather than broad-based demand
Short-term (next 1-2 weeks): Neutral to slightly bearish. The combination of extreme positioning, weak physical demand, and holiday liquidity conditions creates correction risk. A pullback to 4280-4320 USD would be healthy and provide better entry for longs.
Long-term (1-3 months): Bullish. The structural drivers (central bank buying, geopolitical uncertainty, monetary policy expectations) remain intact. Any correction should be viewed as buying opportunity. Targets of 4500-4600 USD remain valid for Q1 2026.
Trade Framework
Scenario 1: Bullish Breakout Trade
Entry Conditions:
45-minute candle closes decisively above 4360 USD upper trendline
Volume on breakout candle exceeds 150 percent of 20-period average
RSI breaks above 60 confirming momentum
Ideally accompanied by dollar weakness DXY declining
Trade Parameters:
Entry: 4365-4370 USD on confirmed breakout
Stop Loss: 4330 USD below triangle midpoint
Target 1: 4400-4410 USD previous resistance
Target 2: 4450-4460 USD November highs
Target 3: 4500-4520 USD measured move target
Risk-Reward: Approximately 1:2.5 to first target
Scenario 2: Bearish Breakdown Trade
Entry Conditions:
45-minute candle closes decisively below 4300 USD lower trendline
Volume on breakdown candle exceeds 150 percent of 20-period average
RSI breaks below 40 confirming bearish momentum
Ideally accompanied by dollar strength DXY rising
Trade Parameters:
Entry: 4295-4300 USD on confirmed breakdown
Stop Loss: 4340 USD above triangle midpoint
Target 1: 4250-4260 USD horizontal support
Target 2: 4200-4220 USD major support
Target 3: 4150-4175 USD measured move target
Risk-Reward: Approximately 1:2 to first target
Risk Management Guidelines
Position sizing should not exceed 1-2 percent risk per trade given current volatility
Reduce position size during holiday period due to lower liquidity
Use hard stop losses do not move stops further from entry
Scale out of positions at each target level 33 percent at each target
Move stop to breakeven after first target achieved
Avoid holding large positions over weekend given geopolitical risks
Monitor DXY and Treasury yields for confirmation of gold direction
Be prepared for false breakouts wait for candle close confirmation
Invalidation Levels
Bullish thesis invalidated if:
Price closes below 4250 USD on daily timeframe
Triangle breaks down with volume confirmation
DXY breaks to new highs above 110
Bearish thesis invalidated if:
Price closes above 4410 USD on daily timeframe
Triangle breaks up with volume confirmation
DXY reverses sharply below 106
Conclusion
OANDA:XAUUSD has delivered a historic performance in 2025 with 51 record highs and 66 percent gains - the best year since 1979. The precious metal is currently consolidating within a symmetrical triangle near 4338 USD, setting up for the next directional move.
Key Data Points:
51 record highs in 2025 according to Dow Jones Market Data
66 percent YTD gains - best since 1979
COT shows 62.1 percent speculative long positioning (6:1 long/short ratio)
India physical demand at 25 percent of normal levels
China discounts at 64 USD - widest since August 2020
PBOC and ETF buying continues despite weak retail demand
Key Takeaways:
The symmetrical triangle is approaching its apex suggesting a breakout is imminent within the next 24-72 hours
Historic momentum (51 records) supports bullish bias but extreme positioning creates correction risk
Physical demand weakness in Asia is a warning sign that price-sensitive buyers are exhausted
Institutional demand (central banks, ETFs) is currently offsetting retail weakness
Short-term bias is neutral with correction risk; long-term bias remains bullish
Bullish breakout targets 4450-4500 USD; bearish breakdown targets 4250-4280 USD
Risk management is critical given extreme positioning and holiday liquidity conditions
The optimal approach is to wait for confirmed breakout with volume rather than anticipating direction. Given the extreme speculative positioning, any breakdown could trigger rapid profit-taking. Conversely, a breakout to new highs could accelerate as shorts cover.
Trade the breakout, not the anticipation. Let price confirm direction before committing capital.
This is not financial advice. Always conduct independent research and manage risk appropriately.
Gold Near Triangle Top — Correction Phase IncomingBased on yesterday’s U.S. economic data, Gold( OANDA:XAUUSD ) failed to post a significant bullish move.
At the moment, Gold appears to be trading within a Symmetrical Triangle pattern and is currently moving near the upper lines of this pattern.
From an Elliott Wave perspective, it seems that Gold has completed a Double Three corrective structure near the upper lines of the symmetrical triangle.
In addition, a Regular Bearish Divergence (RD−) can be observed between the two most recent highs, which weakens the bullish momentum.
I expect that Gold will at least decline toward the lower lines of the symmetrical triangle. If these lower lines are broken, we could even anticipate a breakdown below the Support zone($4,265-$4,240).
First Target: Lower lines of symmetrical triangle
Second Target: Support zone($4,265-$4,240)
Stop Loss(SL): $4,357
Points may shift as the market evolves
💡 Please respect each other's opinions and express agreement or disagreement politely.
📌 Gold Analyze (XAUUSD), 1-hour time frame.
🛑 Always set a Stop Loss(SL) for every position you open.
✅ This is just my idea; I’d love to see your thoughts too!
🔥 If you find it helpful, please BOOST this post and share it with your friends.
 Short
Short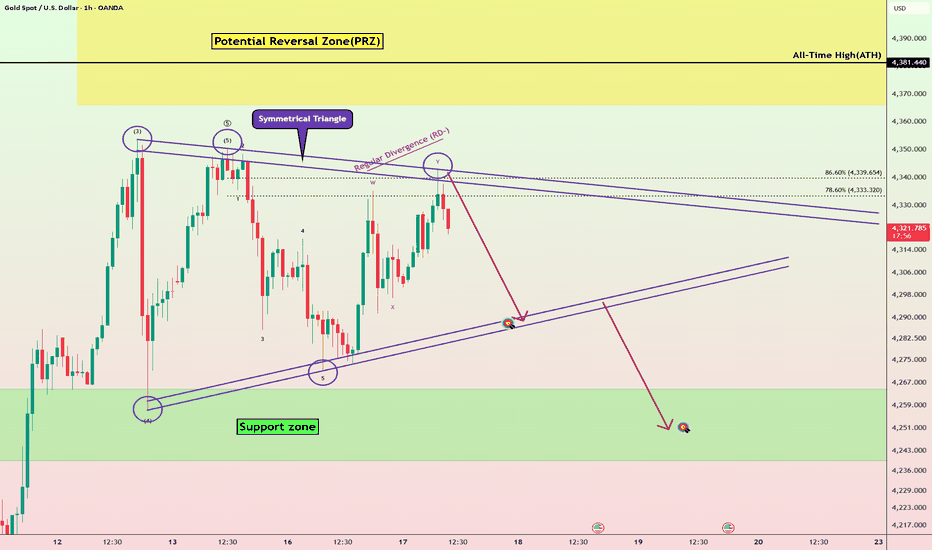
USDT Dominance% Breakout: Crypto Correction Not Over?Today, I’m going to analyze Market Cap USDT Dominance%( CRYPTOCAP:USDT.D ) on the weekly timeframe for you. The reason I want to analyze USDT.D% is that the crypto market conditions have become a bit complex lately, and many factors are influencing it. Therefore, it’s better to take a look at the weekly chart of USDT.D%.
Currently, it seems that USDT.D% is in the vicinity of a Heavy Resistance zone(6.78%-5.25%), but at the same time, there’s also a Support zone(6.24%-5.57%) that could potentially lead to an increase in USDT.D%.
From a classical technical analysis perspective, we can clearly see on the weekly chart that the upper lines of the symmetrical triangle have been broken, and it seems that USDT.D% is currently pulling back to those upper lines. As long as it doesn’t move below those lines again, we can still expect that the market correction is ongoing and hasn’t ended yet. This is a sign that helps us gauge whether the crypto market correction is complete or still ongoing.
From an Elliott Wave perspective, with the breakout of the symmetrical triangle, it seems that USDT.D% might be starting a new impulsive wave.
Since we’re not seeing Regular Divergence(RD-) at the highs, it indicates that the recent upward movement in the crypto market, especially Bitcoin’s( BINANCE:BTCUSDT ) recent gains, is still part of the correction phase.
In conclusion, based on the above analysis, I expect USDT.D% to rise again. If USDT.D% breaks through the resistance lines, we can hope that it will also break through the Heavy Resistance zone(6.78%-5.25%), and that would be a negative sign for the crypto market, potentially leading to deeper corrections in the coming weeks.
So, what do you think? Do you believe the crypto market correction is over, or do you think it will continue? That’s a nice question to leave our analysis with.
Stop Loss(SL): 5.49%
💡 Please respect each other's opinions and express agreement or disagreement politely.
📌Market Cap USDT Dominance% Analyze (USDT.D%), Weekly time frame.
🛑 Always set a Stop Loss(SL) for every position you open.
✅ This is just my idea; I’d love to see your thoughts too!
🔥 If you find it helpful, please BOOST this post and share it with your friends.  Long
Long
 Short
Short
 Short
Short
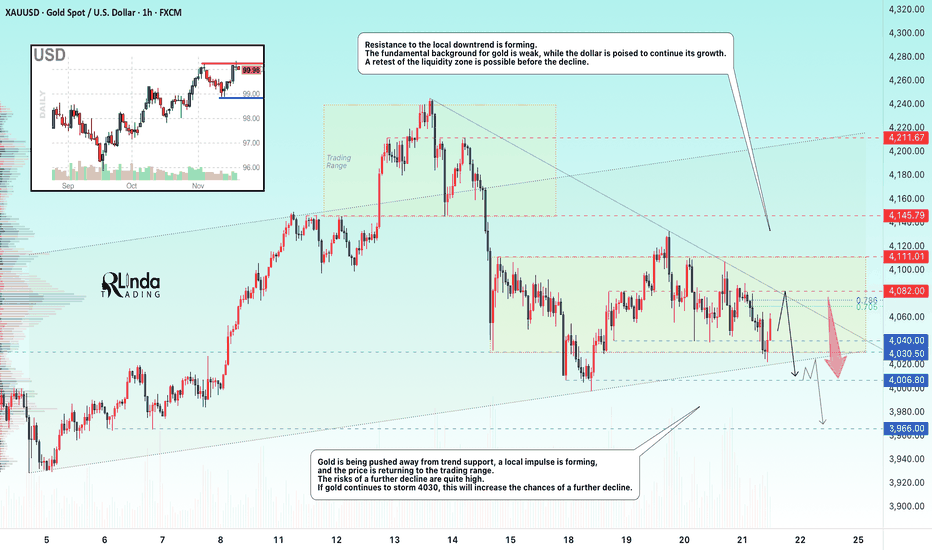
GOLD → Mixed data forms a symmetrical triangle FX:XAUUSD is bouncing off support at 4030, with bulls trying to maintain the current trend. The fundamental backdrop is currently weak for gold, which is why there are bears in the market. The PMI report is coming up...
Mixed US employment data (NFP growth to 119K, but unemployment rose to 4.4%) has created uncertainty. The probability of a Fed rate cut in December remains at 40%. Fed officials remain cautious, warning of the risks of premature easing.
Focus on the 4070-4082 area and local trend resistance...
Gold is awaiting new signals from PMI data. A breakout of the range is likely if there are significant deviations from forecasts (Manufacturing PMI: 52, Services PMI: 54.8)
Technically, a symmetrical triangle is forming on the chart, which could keep the market within its boundaries if the fundamental background remains unchanged. However, a breakout of either boundary could trigger a distribution in the direction of the break
Resistance levels: 4080, 4110
Support levels: 4040, 4030, 4006
In the medium term, gold currently looks weak. The reaction to support is weakening, a cascade of levels and a downward resistance line are forming. The market may test the 4080 area, but if the PMI is weak, gold will return to attack the trend support. However, a break above 4082 and a close above this zone could give us a chance for growth.
Best regards, R. Linda! Short