Key Support Retest at 65.8K–66.3K
Hello traders,
If you follow my profile, you'll always get the latest market updates quickly.
Hope you're having a great day, and good luck in the markets!
-------------------------------------
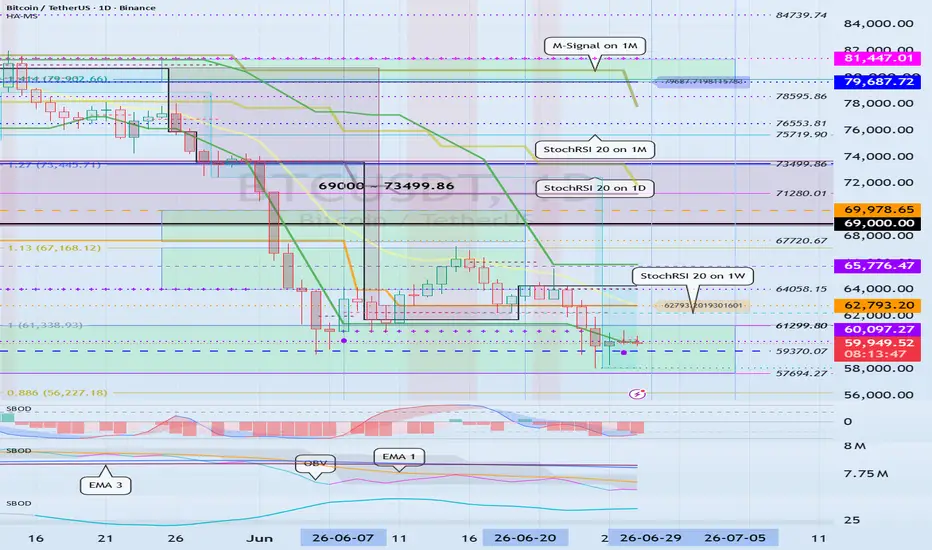
BTC has successfully broken above the 65,776.47–66,323.12 range and is now pulling back to retest that zone as support.
If this area holds, the probability of further upside increases significantly.
However, StochRSI is currently attempting to enter the overbought zone, which could create some short-term resistance to continued upside. For the bullish trend to remain intact, strong buying volume is required, and it's important to monitor whether OBV continues trending upward above the High Line.
In particular, 66,323.12 is a key level as it aligns with the Weekly (1W) HA-Low.
✅ If support holds
The probability of a medium-term bullish trend reversal increases substantially.
❌ If support fails
A step-down bearish structure may develop, making this retest a crucial market event.
---
🎯 Key Upside Targets
If BTC bounces from the current support zone, the next major resistance sits at 67,720.67.
This level corresponds to a previous Daily (1D) HA-Low. A breakout above this level followed by a successful support flip would be a strong indication that a market bottom has formed.
Ultimately, the key question is whether BTC can establish acceptance above the 65,776.47–67,720.67 range and build a solid bullish structure.
---
📈 Conditions for Continued Upside
1️⃣ StochRSI should continue rising without becoming deeply overbought.
2️⃣ OBV must remain above the High Line.
3️⃣ BBS indicator should stay above 0.
If all three conditions are met, BTC may attempt a breakout toward the next target range:
69,000–73,499.86
---
📉 Key Levels if Support Fails
1st Support: 64,058.15
2nd Support: 62,793.20
3rd Support: 61,299.80
If the Weekly HA-Low structure begins turning downward, a correction toward the third support zone cannot be ruled out.
---
🔥 Strong Bullish Signal
If aggressive buying pressure enters the market, traders should closely watch for a breakout above the EMA 3-Line cluster.
A breakout followed by a successful support retest would significantly increase the probability of a strong trend expansion to the upside.
---
📋 Trading Plan
✅ First Entry
Look for a long entry upon confirmation of support within the 65,776.47–66,323.12 zone.
✅ Risk Management
If price rallies toward the Fibonacci 1.13 level at 67,168.12, move the stop-loss to approximately +0.4% above the entry price to protect capital.
✅ Second Entry
After a breakout above 67,720.67:
- StochRSI
- OBV
- BBS
must all confirm bullish conditions. If the breakout holds and support is confirmed, consider adding to the position.
If those conditions fail, scale out partially.
✅ Take Profit Strategy
If BTC establishes acceptance above 67,720.67, consider taking partial profits around the 69,000 area.
✅ Scenario Invalidation
Even if price fails to break above 67,720.67 and starts moving lower, continue monitoring the market if your stop-loss remains intact.
For short-term trading, use the 15-minute chart and monitor HA-Low support:
- HA-Low holds → short-term long opportunity
- Bounce occurs → take profits into strength
Conversely, if price approaches HA-High resistance, focus on profit-taking and reducing exposure.
From a daily timeframe perspective, downside pressure still remains, so traders should be aware that any rebound could eventually turn into another leg lower.
---
📍 Key Takeaways
• 65.8K–66.3K = Most important support zone right now
• If support holds: Targets are 67.7K → 69K → 73.5K
• Bullish confirmation requires StochRSI, OBV, and BBS alignment
• If support fails: Watch 64K → 62.8K → 61.3K
• A breakout and support flip above the EMA 3-Line cluster would signal a strong bullish trend
-----
Thank you for reading all the way through.
Trade safe and stay profitable. 🚀
Trend Reversal Level: 67,720.67
Hello Traders,
Follow for more market insights and technical analysis updates.
Wishing everyone a profitable trading day.
-------------------------------------
BTC is currently holding above the 1D HA-Low support level at 62,793.20 and continues to show signs of a potential recovery. As long as this support remains intact, the probability of maintaining the broader bullish structure continues to increase.
However, StochRSI is still pointing lower, suggesting that momentum has not fully shifted back in favor of the bulls. Confirmation of a bullish reversal in the indicator would strengthen the case for further upside.
Meanwhile, OBV has failed to break above its High Line and is showing weakness, indicating that buying pressure is still lacking. For this reason, it's important to monitor where fresh demand steps in and whether support can continue to hold.
From a higher-timeframe perspective, the key supply/resistance zone remains at 69,000 ~ 73,499.86.
For active traders, however, the real trigger level is 67,720.67. A breakout above this level followed by a successful retest and hold as support would be a strong indication that the market has transitioned back into a bullish trend.
The key question is whether BTC can continue consolidating above 62,793.20 into the next expected volatility window around July 29, building enough momentum for a breakout attempt above 67,720.67.
✅ Key Levels
• Major Support: 62,793.20
• Bullish Trend Reversal Confirmation: Break and hold above 67,720.67
• Major Resistance/Supply Zone: 69,000 ~ 73,499.86
• Indicators to Watch:
- StochRSI bullish reversal
- OBV showing renewed buying pressure
• Expected Volatility Window: Around July 29
-----
Thanks for reading.
Wishing all traders successful trades and solid risk management. 🚀
-------------------------------------------
Build Your Trading Plan Before Entering the Market
Hello traders,
If you enjoy this analysis, make sure to follow for more market insights and trading strategies.
Wishing everyone green candles and profitable trades. 🚀
---------------------------------
One question always comes up in trading:
✅ Which coin should I trade?
✅ What criteria should I use to select a coin?
At the end of the day, consistent profits come not from perfect chart analysis alone, but from having a solid trading plan and sticking to it.
Before entering any position, you should define three key elements:
1. Investment timeframe (Scalp / Day Trade / Swing / Long-Term)
2. Position sizing
3. Entry and profit-taking strategy
---------------------------------
📌 How to Choose the Right Coin
Fundamentals, utility, and project development are important.
However, what actually moves the price is capital flow and market participation.
That's why understanding where the price is positioned within the larger market structure is often more important than knowing every project detail.
By analyzing the chart, we can determine whether market participants still have confidence in a project.
For example, after a major decline, if a coin is able to establish a base and avoid making new ATL (All-Time Low) levels, it could indicate that selling pressure is gradually being absorbed and investors are still accumulating.
Looking at LINKUSDT as an example:
▶ 4.976 ~ 6.870 Zone
If price holds this support range and shows a clear reaction, the probability of a bullish trend reversal increases significantly.
Therefore, identifying these accumulation zones and waiting for confirmation can provide high-probability trading opportunities.
Newly listed tokens are slightly different.
Following their first major correction, it is common for them to revisit or even create a new ATL once or twice before establishing a long-term bottom.
Risk management remains critical.
---------------------------------
📌 Capital Management
Every trader has a different account size, but one rule applies to everyone:
Always keep at least 20% of your portfolio in cash or stablecoins.
This reserve capital can be used for:
✔ Buying major dips
✔ Taking advantage of new opportunities
✔ Lowering your average entry price
✔ Managing existing positions
If this reserve capital is deployed, make sure to rebuild your cash position as soon as possible.
Running out of liquidity often leads to emotional decisions, FOMO entries, and poor risk management.
---------------------------------
📌 Plan Your Entries and Exits Before Opening a Position
Trading is like a voyage.
A captain doesn't leave the harbor without knowing the destination.
Likewise, traders should determine beforehand:
✔ Where to accumulate
✔ Where to scale out
✔ Where to take profits
A trading plan should be established before entering the market and maintained throughout the life of the trade.
Market volatility is something to react to, not a reason to abandon your strategy.
A temporary pullback shouldn't change the long-term thesis unless the original premise becomes invalid.
---------------------------------
📌 Think Carefully Before Closing 100% of a Position
Whenever possible, avoid fully exiting your position before your primary target is reached.
A full exit means the trade is officially over.
After that, many traders end up chasing price action and re-entering without a clear plan.
If you decide to sell 100% of your position, there should be a strong and objective reason behind that decision.
If the sale was purely emotional, it is often best not to look back at that chart.
---------------------------------
📌 Current LINK Trading Perspective
From a macro market structure perspective,
▶ 4.976 ~ 6.870
remains a major demand zone.
If price finds support and begins showing bullish confirmation within that area, the probability of a trend reversal increases.
For swing traders and long-term investors, this would be a key accumulation area.
Most importantly:
Do not place blind limit orders.
Wait for support confirmation and evidence of a bullish reaction before entering.
---------------------------------
Currently, price is trading near the
▶ HA-Low Zone
Therefore, traders should monitor the
▶ 8.250 ~ 8.382 Range
for support confirmation.
If buyers successfully defend this area, it could provide an attractive long opportunity.
On the upside,
▶ HA-High
▶ DOM (60)
should be considered potential profit-taking zones.
This aligns with a basic trading framework:
✅ Buy between DOM(-60) and HA-Low
✅ Take profits between HA-High and DOM(60)
However, this should be viewed as a tactical execution strategy rather than the overall investment thesis.
---------------------------------
📌 Profit-Taking Strategies
There are generally two ways to take profits:
① Realize profits in cash.
② Sell enough to recover your original investment while keeping the remaining tokens as a "free position."
For swing and long-term traders, the second method can be extremely powerful.
Let's say price moves significantly higher.
Instead of fully exiting, you sell enough to recover your initial capital.
As a result:
✔ Original capital is secured
✔ Remaining tokens become pure profit
The remaining position effectively has a zero cost basis.
This creates a strong psychological advantage, allowing you to hold through volatility with far less stress.
For long-term crypto investing, this can be one of the most effective profit-taking methods.
---------------------------------
📌 Key Trend Reversal Level
A major bullish trend is more likely to begin if price can break above and hold:
▶ 11.064
Therefore, the final major accumulation opportunity can be viewed around this level.
---------------------------------
📌 Primary Target Zone
From a higher timeframe perspective, the expected target range remains:
▶ 20.111 ~ 25.782
Any price movement beyond this area should be treated as an overextension or bonus-profit zone.
Therefore:
▶ 4.976 ~ 11.064
should be considered the primary accumulation range.
Once your core position has been built, shorter-term trading strategies such as day trading or swing trading can be used to generate additional gains while maintaining the core position.
---------------------------------
📌 Track Your Core Average Entry Price Separately
After completing your core accumulation phase, record your actual average entry price separately.
Why?
Because repeated short-term trades will alter the average cost displayed by the exchange.
Although your core position may remain unchanged, exchange-reported averages can become distorted.
This can significantly affect trading psychology.
For that reason, it is highly recommended to track:
✅ Core Position Average Price
✅ Trading Position Average Price
as separate metrics.
---------------------------------
📌 Final Thoughts
Great chart analysis alone does not guarantee profits.
Without a clear strategy and proper execution, even the best market analysis can fail to produce consistent results.
The real question is not:
"What should I buy?"
The real question is:
"How will I manage the trade after I buy?"
Create your big-picture trading plan before entering the market.
Stay disciplined during volatility.
Trust the process.
In the long run, a well-executed strategy will always outperform emotional decision-making.
---------------------------------
Thank you for reading.
Wishing everyone disciplined risk management, successful trades, and many green candles ahead. 🚀📈
DYOR. Manage risk. Trade responsibly.
---------------------------------
0.3208–0.3242 Support Will Likely Determine the Short-Term Trend
Hello traders,
Follow for more market updates and trading insights.
Hope you all have a great trading day.
-------------------------------------
TRX is currently trading at a key technical area where multiple support and resistance levels overlap. The most important support zone is 0.3208–0.3242.
As long as this zone holds and buyers step in, higher targets remain on the table.
🎯 Key Upside Targets
1st Resistance: 0.3410–0.3445
2nd Resistance: 0.3657–0.3756
The main bullish signal will be whether price can break above and establish support within these resistance zones.
📉 Levels to Watch if Support Fails
If the 0.3208–0.3242 support zone breaks down, the next support areas become important.
1st Support: 0.3080
2nd Support: 1M Chart M-Signal
A breakdown below the 1M chart M-Signal could significantly increase the probability of a medium-to-long-term bearish trend reversal, making risk management essential.
📊 Indicator Analysis
At the moment, the market can be interpreted as being in a short-term consolidation phase, either moving sideways or building a base.
- StochRSI: Entering oversold territory
- OBV: Positioned between the Low Line and High Line
- BSSC: Below the zero line
Key conditions to monitor:
✅ StochRSI forms a bullish golden cross from the oversold zone
✅ OBV breaks above the High Line
✅ BSSC recovers above 0 and maintains strength
If these conditions are met, the probability of a bullish trend reversal increases considerably.
💡 Buying Strategy
The 1D HA-Low has already risen to around the 0.3208 area. If support is confirmed here, a long-biased approach can be considered.
However, if price falls below the HA-Low, a staircase-style decline may develop. For that reason, scaling into positions remains important.
Under current conditions, gradually accumulating down to 0.3080 appears reasonable. Below that level, additional entries should be considered only after confirming a trend reversal signal.
📌 Selling Strategy
The HA-High and DOM(60) zones can be regarded as short-term take-profit areas.
- Consider scaling out in these zones
- A breakout may lead to a staircase-style advance
- Continue taking partial profits as price moves higher
Every uptrend eventually experiences a correction, so locking in profits along the way is an essential part of risk management.
💰 Medium- to Long-Term Investment Perspective
For investors holding TRX over the longer term, a principal-recovery strategy may be effective.
Selling enough to recover your initial investment and letting the remaining position run can help reduce psychological pressure while maintaining exposure to potential upside.
🌐 TRX Market Assessment
In my view, TRX is better suited for active strategic trading than a pure long-term hold.
That said, several factors remain constructive:
- Ongoing demand for stablecoins within the TRON ecosystem
- Expansion efforts into the U.S. market
- Consistent network usage and activity
TRX is particularly sensitive to stablecoin circulation metrics and often shows price action that differs from Bitcoin.
Therefore, traders should not rely solely on BTC's direction. Monitoring TRX-specific flows, on-chain activity, and capital rotation is equally important.
Overall, compared with many altcoins trading near or below their listing prices, TRX still appears relatively attractive from an investment standpoint.
The key level remains 0.3208–0.3242.
If this support zone holds, the probability of testing higher resistance levels remains open.
-----
Thank you for reading.
Wishing everyone successful trades and strong risk management.
Key Supply Zone: 0.1679 ~ 0.1973
Hello, traders.
Follow for more ADA analysis, trade setups, and crypto market insights.
--------------------------------------------------
📈 ADA Monthly Chart (1M) Outlook
ADA is currently trading at a critical price zone that could determine whether a long-term trend reversal is underway.
The 0.1679 ~ 0.1973 range is a major supply zone where a strong bullish rally previously began after a successful breakout.
Going forward, the most important factor is whether ADA can break above this range and flip it into support.
On the other hand, as long as price remains below 0.1679, ADA is still considered to be trading within a long-term accumulation/investment zone. This means aggressive FOMO entries should be avoided, and a more patient approach is recommended.
--------------------------------------------------
📊 ADA Trading Strategy
In conclusion, the ideal trading opportunity for ADA comes when the market confirms support within the 0.1679 ~ 0.1973 range.
A key high-volume node (Volume Profile) is located around 0.1813.
Therefore, a bullish setup becomes more valid only after ADA establishes acceptance above 0.1813 and successfully confirms it as support.
At the moment, however, a full trend reversal has not been confirmed yet.
A stronger bullish trend is more likely to develop once the monthly (1M) candle breaks above the upper M-Signal level and sustains price action above it.
Until then, short-term trading and active day-trading strategies may offer better opportunities than longer swing positions.
--------------------------------------------------
🟢 Bullish Entry Checkpoints
The HA-Low zone stretches from 0.1456 on the 1D chart up to 0.1971 on the 1W chart.
If ADA confirms support within this area, traders can consider scaling into positions through staggered entries.
A successful support flip above 0.1813 would provide an even stronger bullish entry signal.
--------------------------------------------------
🚀 Conditions for Trend Continuation
For ADA to maintain bullish momentum after breaking key resistance levels, the following conditions should be met:
① StochRSI
- Must continue trending higher without becoming excessively overbought.
② OBV (On-Balance Volume)
- Must remain above the High Line with sustained volume inflows.
③ BSSC
- Must stay above the zero line, confirming trend strength.
If these conditions are met, ADA could have a higher probability of extending its rally after breaking above 0.1973.
--------------------------------------------------
💡 Trading Perspective
The market never moves exactly according to anyone's prediction.
Blindly buying based on someone else's outlook is extremely risky.
The goal is not to predict the market, but to identify tradable zones and wait for actual confirmation from price action.
Avoid FOMO entries and focus on high-probability setups. That's how traders protect their capital over the long run.
--------------------------------------------------
🎯 Mid-to-Long-Term Investment Strategy
For investors looking to hold ADA over the medium to long term, continuously injecting new capital simply to increase position size may not be the most efficient approach.
Instead, consider using trading profits to accumulate additional ADA.
One effective strategy is to scale in based on average entry prices, then partially take profit during rallies by withdrawing the principal amount and leaving only profit-generated holdings in the market.
This allows investors to gradually increase their ADA holdings while managing risk more effectively.
--------------------------------------------------
Always wait for the chart to confirm your setup before entering and let the market signals guide your decisions.
-----
Wishing you successful trading and profitable investments. 🚀
-----------------------------------------------
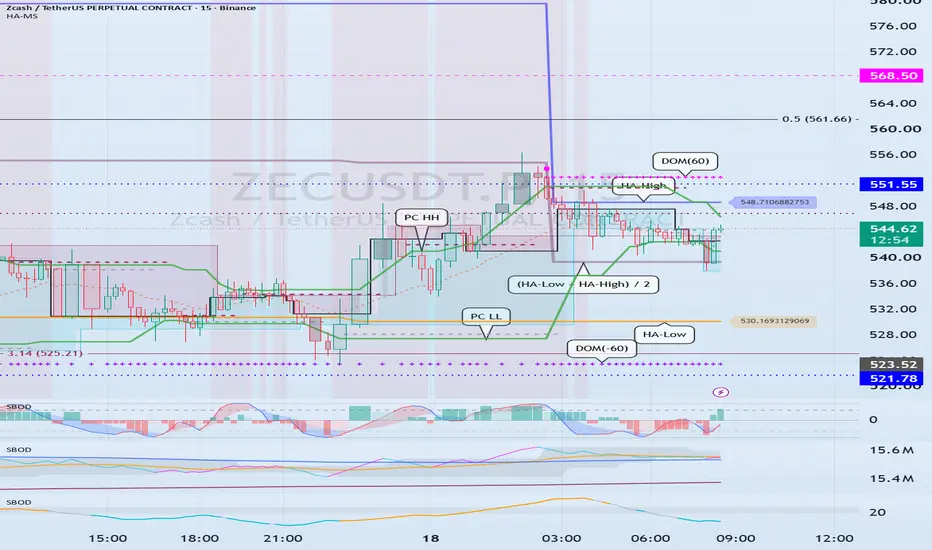
Whether 551.55 Can Be Flipped Into Support After Breakout
Hello traders,
Follow me to stay updated with the latest market insights.
Wishing everyone a profitable trading day.
────────────────────
The current price is trading near the HA-High indicator, making this a short-term resistance zone where a rejection is possible.
However, if price breaks above this area and successfully flips 551.55 into support, the next upside target is 663.91.
A sustained move and acceptance above 663.91 would significantly increase the probability of a stair-step bullish trend developing.
────────────────────
📈 Conditions Required for Trend Continuation
1. StochRSI must maintain bullish momentum.
2. OBV must remain in an uptrend.
3. BSSC must stay above the zero line.
Most importantly, volume is the key factor.
For that reason, traders should closely monitor the position of OBV.
If OBV remains between the Low Line and High Line, it suggests a balance between buying and selling pressure, indicating a consolidation phase with the potential for increased volatility.
If OBV breaks above the High Line and holds there, it signals strong buying pressure entering the market, increasing the likelihood of a bullish trend continuation.
Conversely, if OBV falls below the Low Line, selling pressure gains control and the probability of a bearish trend increases.
Combining OBV analysis with StochRSI can provide a much clearer picture of potential price direction.
Currently, StochRSI is rolling over from the overbought region and moving lower.
This suggests that the current rally may face some limitations in the near term.
To overcome this resistance and continue higher, OBV must break above the High Line and maintain that position.
Ultimately, the most important factor right now is whether price can break above 551.55 and successfully establish it as support.
If the breakout fails, traders should watch whether price can find support near 521.78, where a new HA-High zone may form.
────────────────────
📊 Short-Term Outlook (15-Minute Chart)
Based on the daily timeframe analysis, short-term trading opportunities can be identified on the 15-minute chart.
The key takeaway from the daily chart is that if 551.55 cannot be flipped into support, the market is likely to revisit the 521.78 area.
Currently, price is declining between the HA-High and DOM(60) zones.
This places the immediate resistance range at:
🔹 548.71 – 552.65
A breakout above this range could trigger the formation of a stair-step bullish trend.
On the other hand, if price is rejected around 539.44, the midpoint between HA-Low and HA-High, it is likely to retest the DOM(-60) to HA-Low support zone.
📍 Key Support Zone
🔹 523.52 – 530.17
A breakdown below this zone would increase the probability of a stair-step bearish trend continuation.
────────────────────
📉 Indicator Summary
① StochRSI
StochRSI is currently attempting to enter the oversold region.
As a result, while downside pressure remains, additional downside may become increasingly limited.
② OBV
OBV is showing signs of moving below the Low Line.
This indicates growing selling pressure and increases the likelihood of bearish price action.
③ BSSC
BSSC is currently below the zero line.
Therefore, the broader trend still favors the bears.
When combining these three indicators, the current market environment leans slightly more bearish than bullish.
As such, traders should pay close attention to whether support emerges around 539.44.
────────────────────
🔍 PC LL Perspective
The PC LL line has currently disappeared.
If a new PC LL forms during a support test around 539.44, the probability of a bullish trend reversal will increase substantially.
However, if no new PC LL is formed, the current bounce should be viewed as a relief rally within the existing downtrend rather than a genuine trend reversal.
────────────────────
🎯 Trading Plan
🟢 Long Setup
• Scale into longs between DOM(-60) and HA-Low.
• Scale out between HA-High and DOM(60).
🔴 Short Setup
• Scale into shorts between HA-High and DOM(60).
• Scale out between DOM(-60) and HA-Low.
At the moment, the two most critical levels to monitor are:
✅ Whether 539.44 holds as support
✅ Whether 551.55 can be broken and reclaimed as support
In particular, traders should closely monitor whether OBV can move above the High Line alongside increasing volume.
────────────────────
Thank you for reading.
Trade safe and good luck. 🚀
Key Level to Watch: 1,782.28 Support
Hello, traders.
Follow for faster market updates and trading insights.
Wishing everyone a profitable trading day.
-------------------------------------
ETH is expected to remain in a volatility phase through July 18.
The next major volatility window is projected around August 12.
However, BTC's next key volatility period is expected around July 29, making it important to monitor whether the broader market establishes a clear direction at that time.
📉 Short-Term ETH Outlook
ETH recently faced rejection around 1,879.61 and appears to be forming a local top in the short term.
The most important level right now is the 1,782.28 support zone.
▶ If 1,782.28 Holds
- Potential for a relief rally
- Chance of trend continuation to the upside
- Watch for renewed buying pressure
▶ If 1,782.28 Breaks
- Increased probability of a move toward 1,666.58
- Risk management becomes critical
- A deeper correction cannot be ruled out
The 1,666.58–1,782.28 range remains a key accumulation zone and a potential value-buy area.
Rather than focusing solely on the decline itself, traders should watch for signs of a bottoming structure and a successful support reclaim before considering new long entries.
📈 Bullish Reversal Criteria
For ETH to regain a stronger bullish structure, price needs to break above and hold within the 1,964.96–2,111.42 range.
Additional confirmation signals include:
✅ StochRSI
- Maintaining upward momentum without entering extreme overbought territory
✅ OBV (On-Balance Volume)
- Holding above the High Line
- Showing continued volume-backed buying pressure
✅ BSSC
- Remaining above the zero line
- Confirming positive market momentum
If these conditions are met, ETH could have a higher probability of extending its bullish trend.
Therefore, it will be important to monitor whether ETH begins showing a meaningful trend reversal attempt ahead of BTC's volatility window around July 29.
📊 Mid-to-Long-Term Outlook
The 1,164.99–1,440.00 range remains a major long-term accumulation and demand zone.
This area is considered a critical support region that must hold to maintain the broader bullish market structure.
-------------------------------------
📌 Key Levels Summary
🔹 Major Support: 1,782.28
🔹 If Support Fails: Potential move to 1,666.58
🔹 Accumulation Zone: 1,666.58–1,782.28
🔹 Bullish Reversal Zone: 1,964.96–2,111.42
🔹 BTC Volatility Watch: Around July 29
🔹 Long-Term Support Zone: 1,164.99–1,440.00
---------
Thank you for reading.
Wishing all traders successful trades and solid risk management. 🚀
-----------------------------------
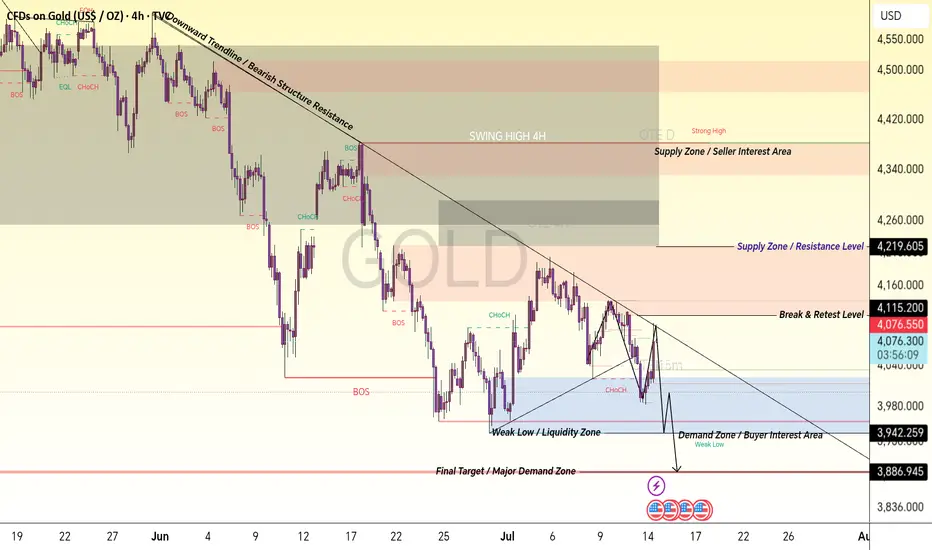
Gold 4H Market Structure Analysis | Bearish Trendline & Key zoneXAU/USD 4H Smart Money Concept Detailed Candle-by-Candle Analysis
Gold 4H chart is showing a complete market structure transition where every candle reflects the battle between buyers and sellers. The price started from higher levels with strong selling pressure after reaching the premium supply area. The early candles created rejection wicks, showing that sellers were defending the upper zone and preventing further upside continuation.
After the rejection from the high area, bearish candles started forming lower highs and lower lows. This sequence confirmed that sellers were gaining control. The first major Break of Structure (BOS) occurred when price broke previous swing lows, indicating a shift from bullish momentum into a bearish structure.
During the downward move, candles continued respecting the descending trendline, which acted as dynamic resistance. Each pullback candle toward this trendline showed weak buying strength, while rejection candles confirmed continuous seller interest. This created a clear bearish channel where smart money continued distributing positions.
After reaching the lower range, price formed a temporary recovery phase. Green bullish candles appeared as buyers entered from the demand area, creating a short-term Change of Character (CHoCH). However, the recovery failed to break the major supply zone, showing that buyers were not strong enough to reverse the overall trend.
The candles near the Supply Zone / Resistance Area showed hesitation and rejection. Multiple small-bodied candles indicated uncertainty, while bearish engulfing movements confirmed that sellers were still active. This area became a key reaction point for future price movement.
The next sequence of candles created another bearish leg, breaking previous support levels and confirming continuation of the downtrend. The strong bearish candles represented aggressive selling pressure, while small retracement candles showed weak attempts from buyers to regain control.
Near the Weak Low / Liquidity Zone, candles started moving sideways, indicating accumulation and liquidity building. The market created equal or nearby lows where stop liquidity may be resting. Smart money often targets these liquidity areas before making the next directional move.
The latest candles are showing reaction from the Demand Zone / Buyer Interest Area. Buyers are attempting to defend this region, but confirmation is required through a strong CHoCH or BOS before considering a complete reversal.
If price breaks below the demand zone, bearish continuation can target the Final Target / Major Demand Zone where stronger buying interest may appear. If buyers successfully defend the zone and break above resistance levels, price can move toward higher supply areas.
Complete Market Story:
Higher Timeframe: Bearish structure remains active.
Trendline: Sellers are controlling momentum below resistance.
Supply Zone: Main selling area and rejection point.
BOS: Confirms seller dominance.
Demand Zone: Buyer reaction area.
Liquidity Zone: Possible stop hunt area before next move.
Final Demand: Major area where institutional buyers may react.
This chart demonstrates Smart Money Concept analysis using market structure, liquidity, supply & demand, BOS, CHoCH, and trendline reactions to understand institutional price movement. Always wait for confirmation before entering any trade.  Short
Short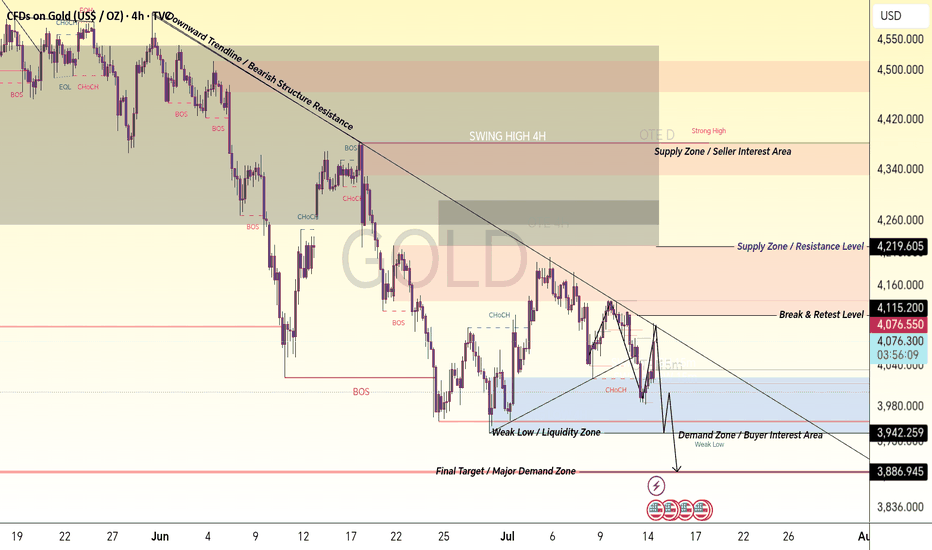
Low-Volume Node (LVN) : 145.30 ~ 154.60
Hello traders!
If you "Follow" us, you can always get new information quickly.
Have a nice day today.
-------------------------------------
Since this chart is still relatively new, the support and resistance levels marked on it have not been fully validated by price action yet. Therefore, extra caution is required when trading.
Based on the price action so far, I believe that any price below 168.35 is likely to fall within a medium-to-long-term accumulation zone.
A Low-Volume Node (LVN) has formed between 145.30 and 154.60 on the Volume Profile.
As a result, the key question is whether price can reclaim and hold support within the 145.30–154.60 range.
If the current downtrend continues, we should monitor the following Fibonacci extension levels for potential support:
1st target: Fibonacci Extension 1.618 (127.42)
2nd target: Fibonacci Extension 2.618 (102.41)
Support confirmation around these areas will be important.
As more time passes and additional price and volume data accumulate, indicators are gradually starting to form.
The first indicator to appear is the PC HH indicator.
Therefore, the short-term top is likely to be around the PC HH level at 198.98.
Since the PC LL indicator has not yet formed, the short-term bottom remains undefined and volatility is still relatively high.
In addition, the OBV indicator has established both a Low Line and a High Line. Therefore, we need to see whether OBV can move back above its Low Line and continue building bullish momentum.
Ideally, traders should wait until OBV returns above the Low Line and then confirm support at nearby support/resistance levels before entering positions.
If support is confirmed, that would be an appropriate short-term buying opportunity.
Since neither the HA-Low nor HA-High indicators—which form the foundation of my trading system—have appeared on the higher timeframe chart yet, I believe it is still too early for aggressive position trading.
---
Until then, trading should primarily be based on lower timeframes (1D and below), focusing on short-term/day trading opportunities.
On the 15-minute chart, both the HA-Low and HA-High indicators have already formed, providing useful trading signals.
A basic trading strategy would be:
- Buy when price finds support around the HA-Low or DOM(-60) levels.
- Take profit when price reaches the DOM(60) or HA-High levels.
It is always better to trade using objective market data.
Trying to predict price movements based on news, narratives, market rumors, external indexes, or unrelated market events is generally not a good approach.
At the end of the day, successful trading comes down to understanding how price and volume are actually behaving in the asset you are trading.
---
In my opinion, relying solely on traditional volume indicators is highly inefficient because they are often difficult to interpret correctly.
Instead, I prefer using indicators that incorporate actual volume flow more effectively, such as:
- OBV (On-Balance Volume)
- Volume Candles
Volume Candles provide a much clearer visual representation of whether current trading volume is stronger or weaker compared to previous periods.
In that sense, they are significantly more efficient than traditional volume bars.
One drawback of Volume Candles is that trendlines do not display very well on them.
Therefore, if you rely on trendline analysis, it is better to switch back to a standard candlestick chart when drawing or monitoring trendlines.
Personally, I rarely use trendlines because my core trading strategy revolves around the HA-Low and HA-High indicators.
When an HA-Low appears, it suggests that the market is attempting a bullish reversal and may be forming a bottom.
Therefore, if price successfully holds support near the HA-Low level, it can be considered a buying opportunity.
Conversely, when an HA-High appears, it suggests that the market may be preparing for a bearish reversal and could be forming a local top.
Therefore, if price encounters resistance near the HA-High level, it can be considered a selling opportunity.
If price remains somewhere between HA-Low and HA-High, then market direction should simply be interpreted based on ongoing price action.
I refer to a move below HA-Low as a "stair-step downtrend" and a move above HA-High as a "stair-step uptrend."
A stair-step downtrend eventually forms a bottom and transitions into an uptrend.
Likewise, a stair-step uptrend eventually forms a top and transitions into a downtrend.
Therefore, the primary strategy is:
- Build core positions around HA-Low levels.
- Gradually distribute those core positions during stair-step uptrends.
All other market conditions can be traded using a short-term/day trading approach.
For example, after building a core position near an HA-Low level, simply holding through the entire move often means that you will end up selling most or all of that position once price reaches an HA-High level.
Depending on market conditions, you may choose to take partial profits instead.
If price continues to rally afterward and develops into a strong stair-step uptrend, you may regret having sold.
However, that sale was still a well-executed trade because it followed a predefined trading plan.
This is why it is important to separate your core position from your active trading position.
While holding your core position, you should continue day trading around it to generate additional profits and potentially increase your overall coin holdings.
In that sense, traders should move away from focusing solely on their average entry price.
Instead, each purchase price should be managed independently.
When you trade based on individual entry prices, the average entry price displayed by the exchange becomes far less important.
Even if frequent trading causes your exchange-reported average cost to move closer to the current market price, there is no reason to feel pressured by it.
For that reason, I strongly recommend keeping a separate record of your true core-position average entry price.
---
Thank you for taking the time to read through this analysis.
Wishing you all successful trades and profitable opportunities ahead.
Explain charts only with objective information
Hello?
Hello traders!
If you "Follow" us, you can always get new information quickly.
Have a nice day today.
-------------------------------------
The reason for using the chart as an indicator is to maintain the objectivity of the explanation.
This is because objective information about why something was explained that way can be useful when passed on to others.
Indicators only provide objective information, but how to use them to explain is up to the explainer.
In that sense, I am trying to objectively explain objective information.
If the HA-Low indicator and the DOM(-60) indicator meet and receive support, it is time to buy.
The reason is that the HA-Low indicator and the DOM(-60) indicator appear in the low range.
In other words, it is an indicator that is created when the price shows signs of turning from falling to rising, so this is the time to focus on finding the right time to trade.
The HA-Low indicator appears when certain conditions are met when the Haikinashi candle shows signs of an upward turn.
If the HA-Low indicator forms a horizontal line after it is created, the horizontal line acts as support and resistance.
The DOM(-60) indicator is a comprehensive evaluation of the DMI indicator + OBV indicator + MOMENTUM indicator.
Therefore, the DOM(-60) indicator appears at the point where the upward transition begins (Close).
Therefore, it is not easy to proceed with trading immediately when the actual DOM(-60) indicator is generated.
As mentioned above, the HA-Low indicator is an indicator that appears only when the conditions on the Hikinashi chart are met, so the creation of the HA-Low indicator means that it is a point corresponding to the average value of the low point.
Therefore, in most cases, the HA-Low indicator is created after the DOM(-60) indicator is created.
So, it can be said that it is time to buy when it shows support in the DOM(-60) ~ HA-Low range.
-
The reason for using the Price Channel indicator is that when the Price Channel indicator forms a horizontal line, it can be used as support and resistance points.
By changing the formula of the existing Price Channel indicator, the Price Channel indicator is not created when volatility occurs at high or low points.
Therefore, if the Price Channel HH indicator disappears and then reappears, you should interpret that there is a possibility of resistance at that point and think about how to respond.
The Price Channel HH indicator was created until July 9th, then disappeared, and was created on July 12th, showing a diagonal line.
Therefore, we need to see if we can find support around the 63925.82 point.
However, since the Price Channel HH indicator was created, there is a high possibility that it will face resistance and fall, so you need to think about a response plan.
Looking at the 15m chart, the HA-Low indicator is formed around the 63925.82 point, so if it is supported and rises around this point, it is likely to basically lead to an attempt to rise near the HA-High indicator.
What you need to think about here is that in order to continue the upward trend at an important point or section, the following conditions must be met.
1. The StochRSI indicator must show an upward trend without entering the overbought zone.
2. The OBV indicator must remain above the High Line.
3. The BSSC indicator must remain above the 0 point.
Therefore, if the 63925.82 point is an important point, the above conditions must be met to continue the upward trend at this point.
The above does not include the author's subjective thoughts.
Although the indicators were explained as is, I think the chart analysis and interpretation were carried out naturally.
When analyzing or interpreting a chart like this, you should not try to explain it by including your subjective thoughts.
In that case, there is a possibility that the person who will listen to the explanation may misinterpret it when analyzing and explaining the chart to another person, and the analysis and explanation will ultimately reduce the credibility of the person who first explained the chart analysis.
Therefore, when analyzing and interpreting charts to others, you must exclude your own subjective thoughts based on the most objective information.
Usually, when analyzing or interpreting a chart, the conclusion section mentions an article or issue about that coin (token) or item and the subjective thoughts that interpret it, thereby reducing the weight of the aforementioned chart analysis or interpretation, and ultimately only highlighting what was said in the conclusion section, which often causes others to misunderstand.
-
When publishing an idea on TradingView, the main text uses objective information from the chart to analyze the chart and provide commentary.
Also, I think it would be a good idea to attach it as an Add Note and describe your subjective content.
Then, when other people see your ideas, I think there will be less chance of misunderstanding.
-
Thank you for reading until the end.
I wish you a successful transaction.
--------------------------------------------------
 Education
The key is whether it can rise beyond Zone 3
Hello.
Nice to meet you, fellow traders.
If you "follow" me, you can always get new information quickly.
Have a great day today.
------------------------------------
I believe that BTC is the only one that has survived among Bitcoin-based tokens.
Therefore, if you trade Bitcoin-based tokens, you must trade by increasing the quantity corresponding to your profits.
In other words, you need a trading strategy that can protect your original investment capital even if the price plummets.
-
Looking at the BCH chart, it can be broadly divided into four sections.
Among these, the most important section is Section 2.
This is because there is a possibility of a significant upward trend when the price rises above Section 2 and maintains that level.
Therefore, you should consider Section 2 and below as areas for medium-to-long-term investment and observe the situation with patience.
For Bitcoin-based cryptocurrencies other than BTC, it is advisable to adopt a trading strategy that increases the quantity corresponding to the profits, or, if possible, secures cash profits.
In other words, this refers to a method similar to trading in the stock market, where you sell 100% to realize a profit when the price rises to a reasonable level.
However, if you do not follow this approach and proceed with medium-to-long-term investment, it is essential to recover your principal by retaining a quantity corresponding to the profits.
To do this, you should engage in day trading and sell only the quantity corresponding to your principal when the price rises and shows signs of falling. At this point, while calculating the transaction fee rate at 0.4% is considered ideal, you can simply sell at a minimum of 0.1%.
It is advisable to set the stop-loss at 0.4% or more above the purchase price if possible.
If you buy and the price falls without holding above 0.4%, it is best to cut your losses.
However, if you bought when the price showed signs of support near the HA-Low or DOM(-60) indicators, there is no need to strictly cut your losses.
This is because a decline from the HA-Low or DOM(-60) indicators can lead to a stepwise downtrend.
A stepwise downtrend eventually forms a bottom and reverses into an upward trend.
However, if your investment weighting is set too high, you must cut your losses on a portion to secure cash.
This is because doing so allows you to buy again when the price meets the HA-Low or DOM(-60) indicators once more. -
When prices rise above a certain level, there are times when you buy unconditionally, feeling as though you must buy immediately.
While this should technically be considered the peak, this phenomenon becomes more pronounced when the cryptocurrency market enters a bull market.
Therefore, in such situations, you must engage in day trading to focus on recovering your principal.
For your main purchase, simply hold the quantity made when the HA-Low or DOM (-60) indicators are encountered.
Then, when it seems unlikely to rise further, you can sell to recover your principal.
If you wish to generate cash profit, you can sell accordingly.
Unlike the stock market, the cryptocurrency market allows for free trading in fractional units, making the barrier to entry low.
Therefore, even if you sell a large quantity to generate cash profit, there is the advantage of being able to increase your holdings at any time.
In that case, there is no need to conduct this type of trading—that is, accumulating the quantity corresponding to your profits—for every coin (token).
You should use this when trading coins you intend to invest in for the medium to long term, such as BTC, ETH, and BNB.
-
BCH is currently exhibiting a stair-step downtrend.
To transition from a stair-step downtrend to an uptrend, the price must rise above the previous HA-Low indicator level and maintain that level.
In other words, it must rise above 460.1 and hold.
Therefore, until then, it is advisable to engage in day trading to increase your holdings based on your profits.
However, it is not easy to increase your holdings solely based on your profits.
This is because the remaining quantity is small.
Therefore, a selling strategy is necessary.
Once the price rises above a certain level—that is, if it has increased by more than 0.4%—set a stop-loss around the 0.4% mark and wait. Then, when you encounter the DOM (60) or HA-High indicators, sell a portion or sell an amount equivalent to your principal purchase, and then release the stop-loss.
Since the average purchase price of the remaining quantity after recovering the principal is 0, it will always remain in a profitable state until the coins (tokens) disappear.
Because this remaining quantity can confuse the average price in the investment history provided by the exchange, you should store it separately in another wallet or ignore the average price provided by the exchange thereafter.
-
The circles marked on the chart correspond to important support and resistance zones.
Among them, points 1 through 4 correspond to buying times, while points 5 and 6 correspond to selling times.
However, since there is a possibility of a full-scale uptrend if the price rises above the M-Signal indicator on the 1M chart and maintains that level, it is ambiguous to consider section 4 as a buying time.
Therefore, you must respond according to the situation.
Therefore, we need to consider how to proceed with buying around zones 1 through 3 to increase our holdings and close our main position.
However, since a stair-step downtrend may continue, it is necessary to trade while securing cash.
-
Thank you for reading to the end.
I wish you a successful trade.
--------------------------------------------------
Check support near 1782.28
Hello?
Nice to meet you, fellow traders.
If you "follow" me, you can always get new information quickly.
Have a great day today.
------------------------------------
#ETHUSDT
This volatility period is expected to last until July 12, but since the next volatility period is around July 17, eventually July 18 should be viewed as a volatility period.
If the HA-Low indicator of the 1W chart is to be generated at the 1782.28 point next week, support around that point is key.
However, in the big picture, the section 1597.76 to 1879.61 is an important section, so it is important to see if it can rise in this section.
Over the course of a period of volatility,
1. The StochRSI index is showing a dip near the 50th point,
2. OBV indicators are located near the High Line.
3. As the ADX Line is trying to enter the lateral section, it is important to support it near the section 1666.58 to 1782.28.
We also need to see if the Price Channel HH indicator disappears due to this rise.
-
The next significant segment is between 2419.83 and 270.6.15, so if it breaks up and rises above the M-Signal index on the 1M chart, it is likely to show a full-fledged uptrend.
Therefore, it still takes time for the upward trend to begin, so we need to proceed with the transaction while controlling the weight.
You need a strategy to buy when you meet the HA-Low or DOM (-60) indicators and see support, and to increase or earn a profit by selling some or 100% when the price rises and then falls.
We recommend that these transactions go ahead until they show support above the M-Signal indicator on the 1M chart.
If you can afford the funds, it is recommended to proceed with the transaction in the direction of increasing the weight rather than selling 100%.
If it falls below 1440, there is a possibility of entering the mid- to long-term investment area, so we need to think about countermeasures.
-
Thank you for reading until the end.
I wish you a successful transaction.
--------------------------------------------------
Check if it can rise above 1.1475 and receive support
Hello?
Nice to meet you, fellow traders.
If you "follow" me, you can always get new information quickly.
Have a great day.
-------------------------------------
I remember when I first started trading cryptocurrencies.
Before I began trading, I looked at how others analyzed charts.
However, unlike stock analysis, trading volume was missing from cryptocurrency analysis.
At first, I thought this was because it was difficult to examine the movement of trading volume due to the sheer number of exchanges.
But it turned out that they were omitting volume due to differences in chart analysis methods.
Although it is said that the movement of trading volume can be manipulated, I still believe that trends are ultimately formed based on the movement of volume.
Therefore, I use the OBV indicator, which corresponds to trading volume, as a supplementary indicator.
To overcome the limitations of interpreting the OBV indicator, I attempted to verify the trend and strength of the OBV by adding the formula from the Price Channel indicator to create Low Lines and High Lines.
Additionally, by using the StochRSI indicator together, I tried to confirm the movement of waves as well.
Therefore, to sustain the uptrend,
1. the StochRSI indicator must show an upward trend, and
2. the OBV indicator must be maintained above the High Line.
Looking at the current movements,
1. the StochRSI indicator is showing signs of declining from the overbought zone, and
2. the OBV indicator is heading toward the Low Line.
Accordingly, to transition to an uptrend, it must rise to around 1.1475 and show signs of being supported.
If it fails to do so and falls, it is highly likely to drop to around 0.93.
Since the HA-Low indicator on the 1D chart is currently formed at the 1.1475 point, the time to buy corresponds to when it shows signs of being supported near this point.
However, as it is currently showing a stepwise downtrend, position sizing must be adjusted.
In other words, position sizing and capital management must be handled through day trading.
A full-scale uptrend is highly likely to begin when the price rises above the M-Signal indicator on the 1M chart and maintains that level.
However, since XRP has significant support and resistance levels formed between 1.5 and 1.9669, it is expected that a full-scale uptrend will only begin once this zone is broken upwards.
If the price falls below 0.93, it will enter the medium-to-long-term investment zone, so you should prepare a response plan for this.
-
Since various indicators are set up on the chart, it will simply be a confusing chart if you do not understand how to interpret them.
I hope you will take a moment to reflect on why these indicators were added and consider how to interpret them.
Explanations regarding the indicators are provided across various ideas.
-
Thank you for reading to the end.
I wish you successful trading.
--------------------------------------------------
The key is whether it can rise to the 0.16 and find support
Hello.
Nice to meet you, fellow traders.
If you "follow" me, you can always get new information quickly.
Have a great day.
------------------------------------
Since the chart was created recently, the role of the support and resistance points marked on the chart is weak, so caution is required when trading.
The point where you can start trading is the 0.1600 level, where the HA-Low indicator is formed.
Therefore, you should look for a buying opportunity when the price shows signs of support around the 0.1600 to 0.1756 range.
If the price rises above 0.1814, there is a possibility of a sharp upward trend, but since selling pressure could be equally strong, a quick response is required.
Once the rise begins:
1st: 0.2120
2nd: 0.2428
3rd: 0.2783
You must check for support around the 1st to 3rd levels above and consider a response strategy accordingly.
-
If you look at the 15m chart for day trading, it is as follows:
1. Since the M-Signal indicator on the 1D chart is passing near 0.1390, buying is possible when the price shows signs of support in this area.
2. If the price falls below 0.1390, you must check whether it finds support around 0.1243.
3. If the price rises, you should focus on finding a selling timing when it climbs to the HA-High ~ DOM(60) zone, specifically the 0.1665 ~ 0.1719 range.
-
Thank you for reading to the end.
I wish you a successful trade.
--------------------------------------------------
Check if it can receive support and rise around 62793.20
Hello?
Hello traders!
If you "Follow" us, you can always get new information quickly.
Have a nice day today.
-------------------------------------
This period of volatility is expected to last until around July 5th (July 4th to 6th).
The next period of volatility is around July 29th, so we need to pay close attention to the trends that have formed over this period of volatility.
In order to rise at an important point or section and continue the upward trend, the following conditions must be met.
1. The StochRSI indicator must show an upward trend without entering the overbought zone.
2. The OBV indicator must be maintained above the High Line.
3. The BSSC indicator must remain above the 0 point.
If we interpret the current movement according to the above conditions, the StochRSI indicator and BSSC indicator are satisfied with the conditions.
However, because the OBV indicator is located in the Low Line to High Line section, it is not satisfactory.
Therefore, we need to test support around 62793.20 and see if the OBV indicator rises above the High Line.
If the conditions are not met, it will eventually decline.
If a support test is performed around 62793.20, it seems likely that the StochRSI indicator will enter the overbought zone.
If the StochRSI indicator enters the overbought zone, there is a possibility that upside will be limited.
A strong buying trend is needed to ignore these restrictions and rise.
Therefore, the OBV indicator must rise above the High Line and show an upward trend.
In the end, even if it is supported and rises around 62793.20, the StochRSI indicator will enter the overbought zone and will eventually fall again, resetting the StochRSI indicator.
Therefore, you need to adjust your investment proportion with peace of mind.
I think it needs to rise above 67720.67 to break out of the bottom.
This is because it corresponds to the previous HA-Low indicator point.
When the HA-Low indicator is created, it can be considered that a low point has been formed, and if the HA-Low indicator falls, there is a possibility of a stepwise decline.
This cascading downward trend will eventually form a bottom and turn into an upward trend.
The 62793.20 point is also the previous HA-Low indicator point, so if it is supported, it is a buying time.
However, because point 67978.65 forms a longer horizontal line, it can be considered a more important point than point 62793.20.
Therefore,
1st: 62793.20
2nd: 67720.67
If support is received around the 1st and 2nd positions above, it is time to buy.
As the price falls, the first DOM(60) indicator point is formed at 73909.36 at the current price.
Therefore, if it is supported at 67720.67 and rises, the area around 73909.36 is likely to be the first volatility zone.
This is because the DOM(60) indicator is an indicator of the high point, so it rises from the low point and appears to be trying to break through the first high point upward.
Since an important support and resistance area has been formed between 69000 and 73499.86, it seems likely that the first volatility will occur in this area.
In any case, caution is needed in trading as it is highly likely that the StochRSI indicator will enter the overbought zone after this period of volatility.
If it fails to rise, it may fall below 61299.80, so you need to think about a response plan.
This is because if the HA-Low indicator is encountered again, there is a possibility of a cascading decline.
-
Thank you for reading until the end.
I wish you a successful transaction.
--------------------------------------------------
BBES$TT — Crypto Settlement Infrastructure Corewww.tradingview.com
BBESSTT is a proposed term for the core settlement infrastructure of crypto: the dominant monetary assets, stablecoin liquidity, and transaction networks through which most crypto-native value transfer currently happens.
The goal is to track whether crypto settlement is concentrating in this core — or moving away from it.
Methodology: A rules-based, cap-weighted basket of the top 7 crypto assets by market capitalization, excluding memecoins and L2 tokens, while explicitly including stablecoins as the liquidity layer. Rebalanced quarterly. Cap-weighted.
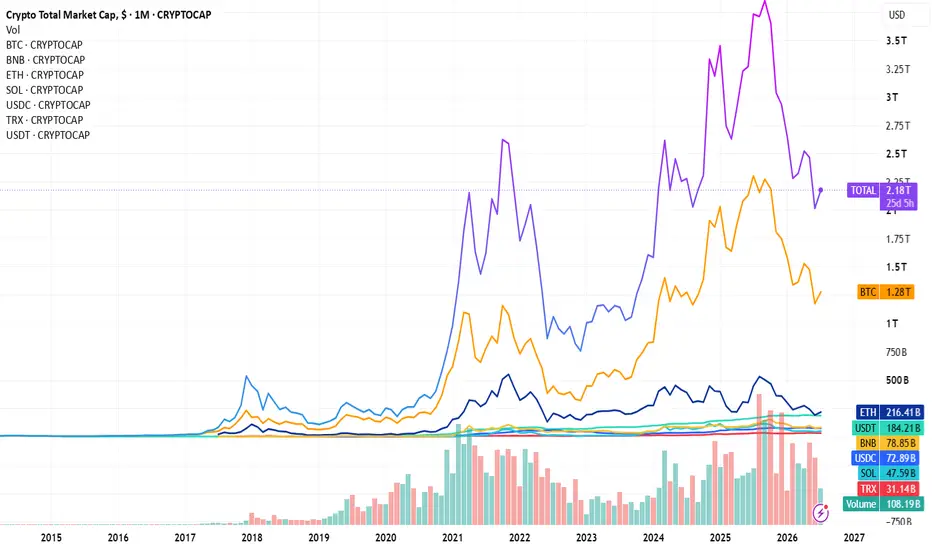
The core of the crypto industry accounts for roughly 87% of the entire crypto market's $2.18T capitalization.
B - CRYPTOCAP:BTC $1.28T
B - CRYPTOCAP:BNB $78.82B
E - CRYPTOCAP:ETH $216.54B
S - CRYPTOCAP:SOL $47.67B
$ - CRYPTOCAP:USDC $72.89B
T - CRYPTOCAP:TRX $31.14B
T - CRYPTOCAP:USDT $184.21B
Three derived readings:
1. Core BTC share (BTC / BBESSTT ): ~67%
→ Bitcoin's weight within the settlement core, stripped of long-tail noise.
2. Liquidity layer (USDC+USDT / BBESSTT ): ~13.5%
→ Share of the core sitting in cash-equivalents vs. deployed into volatile assets.
3. Risk-tier spread ((BNB+SOL+TRX) / (BTC+ETH)): ~10.5%
→ Weight of higher-beta assets relative to the core tier (BTC/ETH).
For scale, not equivalence: at $1.91T, the settlement core roughly matches total US physical currency in circulation (~$2.4T, Fed data) — the entire crypto market (~$2.18T) sits at about a quarter of all physical cash in circulation worldwide across every currency (~$8.9T). Against broader money supply, BBESSTT is ~8.4% of total US M2 (~$22.8T, cash + bank deposits) but just ~1.9% of global M2 across all currencies (~$98.6T) — crypto's scale is far more significant relative to the dollar system specifically than to world money as a whole, consistent with stablecoins' near-total USD-peg.
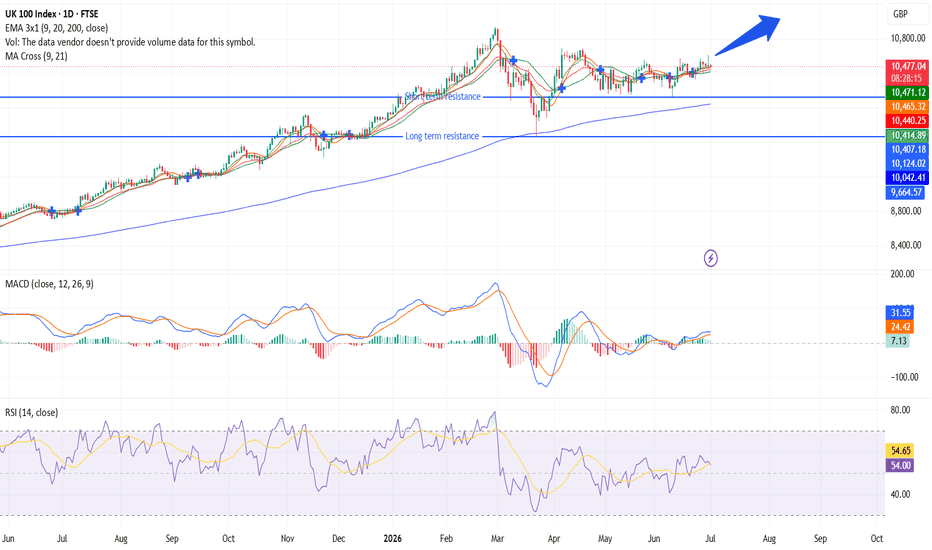
This isn't a price-prediction tool — it's a structural snapshot of how capital is currently distributed across crypto’s settlement infrastructure: cash-equivalent, core-tier, and risk-tier. The key question is simple: is crypto’s settlement BBESSTT infrastructure expanding or contracting in dollar terms? UK100: Record highs, going nowhere fast?This video contains an analysis of the UK 100 as well as the trade setup that I have created on the 30 June , where the index is trading near all-time highs above 10,484 but without any conviction whether up or down. The MA Cross is right under price, the RSI is holding onto the neutral fifty line, and yet the MACD histogram is forming a formation that price action does not reveal on its own. In this video, you will get a comprehensive look at the FTSE 100 index in which I will explain to you the macroeconomic background, why the announcement of a positive ceasefire in Iran did not result in any significant move, and how I am planning to trade this from here. In this video, you can expect an analysis of the EMA formation, the MA Cross signal, and the three scenarios that I am watching out for as of July.  Long
Long
Resistance Zone: 117.87 ~ 129.44
Hello?
Nice to meet you, fellow traders.
If you "follow" me, you can always get new information quickly.
Have a great day.
------------------------------------
Important zones are marked with circles and square boxes.
The 117.87 ~ 129.44 range is a high point zone and corresponds to a resistance zone.
However, if it finds support in this range and rises, there is a possibility of a stair-step upward trend.
Therefore, if it finds support around the 117.87–129.44 range and rises, it is expected to increase to the Fibonacci ratios 2.618 (160.79)–3.618 (162.17).
If it fails to rise and falls:
1st: 95.69
2nd: 70.33–79.62
We need to check if it finds support around the 1st and 2nd levels mentioned above.
Since a gap is expected to occur in the 70.33–79.62 range, if it finds support near this area, it can be considered a strong buying opportunity.
However, since the area around 96.69 corresponds to a high point from a sharp rise, it appears highly likely that it will find support in this vicinity.
-
In order to receive support at a key point or zone and continue the uptrend,
1. The uptrend must be observed while the StochRSI indicator has not entered the overbought zone.
2. The OBV indicator must be maintained above the High Line.
3. The BSSC indicator must be maintained above the 0 point.
- Currently, only the BSSC indicator is maintaining above the 0 point,
- It appears highly likely that the StochRSI indicator will enter the oversold zone,
- Since the OBV indicator appears to have fallen from the High Line, it seems likely that a support test will follow to sustain the uptrend.
-
Thank you for reading to the end.
I wish you a successful trade.
--------------------------------------------------
Key Volatility Period: Around July 5th
Hello.
Nice to meet you, fellow traders.
If you "follow" me, you can always get new information quickly.
Have a great day today.
------------------------------------
You must proceed with trading according to your trading strategy by identifying volatility zones or support and resistance points on the chart.
To do this, we use various methods that suit our own criteria.
In that sense, you can use indicators such as the Price Channel or Bollinger Bands.
I use the Price Channel indicator because when the indicator shows a horizontal line, it can be utilized as a support and resistance point.
The fact that the Price Channel line itself is not being generated indicates that it is in a volatility period.
Therefore, since the LL line of the Price Channel indicator is currently not being generated, we can see that the low point is in a volatility period.
Therefore, if the Price Channel indicator forms a diagonal line one day, whether support is found near the endpoint becomes a critical factor.
In this way, indicators provide the information you need, allowing you to save time in interpreting charts.
------------------------------------
Since this year can be considered a bear market, I believe that a significant volume of trading is required for a bullish reversal.
However, considering existing support and resistance points, the current price level—around 57,694.27 to 61,299.80—can be seen as a critical zone.
This is because it corresponds to the previous high point range.
If the price falls below this level, support must be confirmed around 48,189.84.
Therefore, when falling to around 48,189.84, you must verify whether it shows signs of being supported while generating a large volume of trading.
If the price turns upward without being accompanied by significant trading volume, it is likely to end in a rebound, and the rebound zone is expected to be around points 1 and 2.
Therefore, you must check the movement when the Price Channel indicator's LL line is formed, as it shows signs of support.
-
Although the chart displays a chaotic array of lines, as mentioned earlier, you should first check for support around the 57694.27 ~ 61299.80 range.
If the price falls from the 57694.27 ~ 61299.80 range, as previously mentioned, you must consider a response strategy while monitoring trading volume movements as it approaches the 48189.84 point.
However, since it has encountered the HA-Low indicator, you must formulate a buy strategy to respond.
The formation of the HA-Low indicator signifies that a bottom zone has been established; therefore, even if the downtrend continues, it will eventually reverse into an uptrend following a stepwise decline.
If the price rises from the 57,694.27 ~ 61,299.80 range, looking at the big picture:
1st: 62,793.20
2nd: 69,000 ~ 73,499.86
3rd: 79,687.72 ~ 81,447.01
You must check for support around the 1st to 3rd levels mentioned above.
If the price rises and maintains a sideways movement above the M-Signal indicator on the 1M chart, it will play a crucial role in monitoring the subsequent trend, as there is a possibility that it will eventually transition to an uptrend.
Since the LL line of the Price Channel indicator on the 1D chart has formed, you must carefully observe for support around 60,097.27. You must verify whether the OBV indicator rises above EMA 1 and maintains that level, and whether it can rise above the High Line.
If it fails to do so, it will likely only feign an upward trend before showing signs of a decline.
This period of volatility is expected to continue until June 30th.
-
Thank you for reading to the end.
I wish you successful trading.
-------------------------------------------------
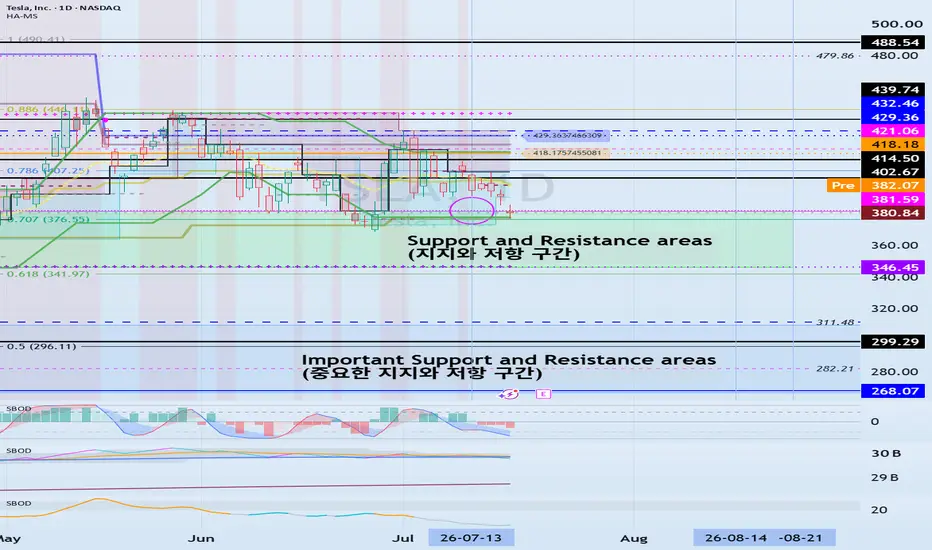
Support and resistance range: 372.0 ~ 414.23
Hello?
Hello traders!
If you "Follow" us, you can always get new information quickly.
Have a nice day today.
-------------------------------------
The areas marked with circles are important support and resistance areas.
The current price is located in the range 372.0 to 414.23.
I think that anything below 216.60 is likely to enter the mid- to long-term investment zone.
The start of the uptrend is expected to begin when the price holds above 427.94.
-
The key is whether it can rise above 414.23 to 427.94 and receive support.
If not, you should check for support in the 338.72 to 372.0 range.
If it falls below the 338.72 to 372.0 range, it is expected to fall to around 216.60 to 237.86.
-
The HA-Low indicator, which marks the low point, is at 237.86, and the HA-High indicator, which marks the high point, is at 551.97.
Therefore, since the section 372.0 to 414.23 corresponds to the middle section, it can be said that support in this section is important.
In order for the price to continue its upward trend, buying pressure must eventually increase.
Therefore, the OBV indicator should show an upward trend.
In that sense, I think it is highly likely that the upward trend will continue only if the secondary indicator OBV indicator rises above the High Line and remains there.
However, since the current OBV indicator is located near the Low Line, we can see that the buying trend is weak.
Therefore, when it rises to the 414.23 to 427.94 range and shows support, you should check whether the OBV indicator has risen above the High Line.
-
The current price can be considered to be in a good range for trading ZEC.
However, there are some ambiguities about buying at the current price with a new transaction.
As explained above, it is unclear whether support will rise as it rises to the 414.23 to 429.94 range, so if possible, you should check whether the OBV indicator shows an upward trend when it shows support in the 414.23 to 427.94 range.
Since the current price is in the middle range, you can match the average purchase price by making the first purchase near the current price and making the second purchase when the price falls and approaches 237.86.
At this time, the important thing is that when the price starts to rise and then starts to fall, you need a strategy to secure cash by selling part of the secondary purchase.
This gives you the power to buy when it falls again.
-
Thank you for reading until the end.
I wish you a successful transaction.
--------------------------------------------------