Short
Short
Ethereum | Is the Largest Corrective Cycle Nearing Completion?
Our structural analysis suggests that Ethereum may be approaching the final stages of Wave IV within its largest bullish market cycle. Based on the rules and guidelines of the Elliott Wave Principle, this correction is currently being interpreted as a complex sideways corrective pattern.
In the preferred scenario, Wave Y is unfolding as a Flat correction that still has the potential to evolve from a Regular Flat into an Expanded Flat. If this structure is completed as expected, it could mark the end of the larger-degree Wave IV and pave the way for the development of Wave V, potentially leading to Ethereum's next major impulsive advance.
However, the market always has the ability to reveal a more complex structure. The aggressive alternate scenario therefore remains valid. Under this interpretation, the current rally may represent nothing more than another connecting Wave X, rather than the beginning of Wave V. If that proves to be the case, the entire correction could expand into a Triple Three (W-X-Y-X-Z), with W and Y both unfolding as Zigzag corrections before the market develops its final corrective phase.
Should this alternate scenario unfold, Wave Z may take the form of another valid corrective pattern, including a Zigzag, Flat, Triangle, or any other corrective structure permitted under the rules and guidelines of the Elliott Wave Principle. Until the corrective sequence is fully complete, both scenarios remain technically valid.
This analysis is not a prediction of the future, but rather my structural interpretation of the market based on the rules, guidelines, and structural relationships of the Elliott Wave Principle. It reflects seven years of studying, researching, and applying Elliott Wave analysis in an effort to better understand the language of market structure. Even so, the market always has the ability to reveal new information as each wave unfolds, often leading to a deeper understanding of the larger pattern. Elliott Wave analysis is therefore not about claiming certainty, but about interpreting the highest-probability structure that the market presents at any given time.
Price is the result. Structure is the cause.
— Mr. Nobody | Elliott Wave Principle
Ethereum / TetherUS
Jun 24
ETHUSDT Macro Analysis: Deciphering the Wave (II) Corrective Str
 Long
Long
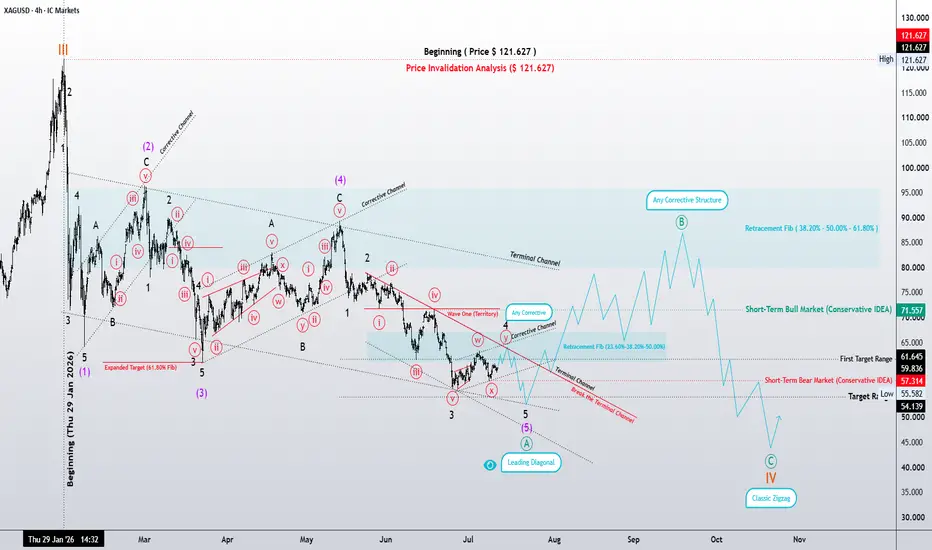
Leading Diagonal Suggests a Corrective Rally Before Completing XAGUSD (Silver) | Leading Diagonal Suggests a Corrective Rally Before Completing Higher-Degree Wave IV
"Price is the outcome. Structure is the cause."
After examining the weekly, daily, and now the 4-hour chart, the aggressive scenario continues to align with the rules and guidelines of the Elliott Wave Principle.
In this interpretation, the recent decline is counted as a Leading Diagonal following the 5-3-5-3-5 structural sequence. So far, the internal subdivisions remain consistent with the characteristics of a leading diagonal, suggesting that either one lower-degree wave remains before completion, or the pattern has already completed and the market is preparing for its next phase.
If this wave count is correct, the completion of Wave A should be followed by a short-term corrective rally, developing Wave B. Since Wave B may unfold in virtually any corrective form, this analysis focuses on identifying the highest-probability retracement zone rather than assuming a specific corrective pattern.
For that reason, the 38.2%, 50%, and 61.8% Fibonacci retracement levels are highlighted as the most likely region for Wave B to terminate.
Once Wave B is complete, the next expectation is the development of an impulsive Wave C, ultimately completing a classic Zigzag (5-3-5) correction. If this scenario unfolds as expected, it would also complete the higher-degree Wave IV correction.
Only after that larger correction is finished will the market be expected to resume its primary trend. Assuming the current wave count remains valid, the next advancing wave could initiate the continuation of the broader bullish cycle.
As always, this is not a price prediction. It is a structural roadmap developed through the rules and guidelines of the Elliott Wave Principle. As long as the invalidation level remains intact, this scenario stays valid and will be updated whenever new price data requires a reassessment.
Signature
"Price is the outcome. Structure is the cause."
Patterns whisper. I listen.
— Mr. Nobody 🎧📊
Silver Futures
May 17
Silver: Textbook Grand Supercycle Wave 3 Setup
Silver / U.S. Dollar
May 19
Title: Silver: The Silver Symphony in the Third Movement
Silver / U.S. Dollar
May 19
XAGUSD | 4H Wave Map — A Two-Layer Look at Structure
 Long
Long
Microsoft - A Visual AlmanacA rare structural asymmetry has been developing in the equity markets. While the S&P 500's 9.6% year-to-date return establishes a powerful macroeconomic floor, Microsoft has decoupled from the index by undergoing a -30% correction. This combination of an index momentum cycle and a discounted mega-cap growth leader presents a compelling thesis.
The broader market enters the second half of the year backed by strong cyclical momentum, where front-half strength historically serves as a launchpad:
- The S&P 500’s 9.6% YTD return crosses a historical threshold.
- Since 1990, every calendar year clearing this mid-year bar finished the S&P 500 in positive territory.
- Post-milestone, the index has historically generated an additional median gain of 9.8% over the final six months.
To maximize this expansion, capital naturally rotates toward premium growth engines. Microsoft’s retreat to the $385 range; driven by AI capital expenditure fears, presents a disconnect against its high-velocity operational metrics:
- Microsoft’s annualized AI revenue run rate has surged past $37 billion (up 123% YoY).
- The company's contracted commercial backlog stands at $627 billion, proving capex matches enterprise demand.
- This correction dragged Microsoft’s forward P/E down to 22.9x, now discounted cash flow models suggest a 45% upside within one year.
Just as front-half momentum historically breeds back-half strength for the S&P 500, a heavily compressed mega-cap leader builds the coiled-spring energy needed to fuel an index expansion. For individuals tracking this cycle, Microsoft represents a premier large-cap vehicle positioned to lead the market's second-half momentum. Bitcoin’s Make-or-Break Zone: Is $60K the Launchpad for $90K?Bitcoin is once again trading inside a historically important demand zone between $60,000 and $64,000. From a technical perspective, the broader structure remains bearish – BTC continues to form lower highs and is still trading below both the 200-day moving average and the major descending trendline.
However, the technical weakness is developing alongside several long-term fundamental catalysts that could create the conditions for a larger recovery.
Corporate demand has not disappeared
Michael Saylor’s Strategy remains the largest corporate holder of Bitcoin, with more than 843,000 BTC on its balance sheet. The company continued accumulating during the market decline, including purchases around the mid-$60,000 area, although it has also recently sold a relatively small portion of its holdings as part of a new capital-management program.
This distinction matters.
Strategy is no longer operating under a simple “buy and never sell” model. It is increasingly managing Bitcoin as part of a broader treasury structure involving common shares, preferred securities, dividends and cash reserves. The recent sales may create short-term pressure, but the company still controls one of the largest concentrated Bitcoin positions in the world.
Its average acquisition price is estimated at approximately $75,000 per BTC, meaning the current market price is also below Strategy’s overall cost basis.
For long-term bulls, this creates an interesting situation: Bitcoin is trading below the average price paid by its most aggressive corporate buyer.
The Trump family remains deeply exposed to Bitcoin
Bitcoin also continues to receive political and corporate support from businesses connected to the Trump family.
American Bitcoin, backed by Eric Trump and Donald Trump Jr., operates a combined Bitcoin-mining and treasury strategy. The company reportedly holds more than 8,000 BTC, while continuing to accumulate coins through mining despite the broader downturn.
This is not the same as Eric Trump personally purchasing Bitcoin on the open market. However, the family’s exposure through American Bitcoin means that its financial interests remain closely connected to the long-term performance of the asset.
President Donald Trump has also continued to present himself as supportive of the cryptocurrency industry. His recent pro-crypto comments helped Bitcoin recover after temporarily falling toward $60,000, demonstrating that political messaging can still influence short-term market sentiment.
Weak price, strong strategic interest
Bitcoin has declined sharply from its previous peak, but the fundamental story has not disappeared.
Corporate treasury companies remain exposed to the asset. Mining firms continue accumulating production. Political figures are increasingly connected to cryptocurrency businesses. Meanwhile, the market is now trading near levels that previously attracted significant institutional demand.
This does not guarantee that $60,000 will hold.
It does suggest that the current area is more than just another horizontal support level. It is becoming a test of whether long-term strategic buyers are prepared to absorb the supply created by leveraged traders, weaker treasury companies and short-term investors.
Technical structure
The first major condition for a bullish reversal is a sustained hold above the $60,000–$63,000 demand zone.
Bitcoin has already tested this area several times. Repeated tests can weaken support, but the market has so far avoided a decisive daily breakdown below $60,000.
The first upside objective is located around $66,000–$67,000, where recent local highs may create selling pressure.
Above that level, Bitcoin would approach the most important resistance cluster on the chart:
The descending trendline from the previous highs
The 200-day moving average
The horizontal resistance area around $70,000–$74,000
A move into this region would not automatically confirm a new bull market. It would represent the real decision point.
Bullish scenario
The bullish scenario would develop in several stages:
Bitcoin holds the $60,000–$63,000 support zone.
Price breaks above $66,000–$67,000.
BTC reaches the descending trendline near $70,000–$74,000.
The market closes decisively above the trendline and 200-day moving average.
A successful retest turns former resistance into support.
If this structure develops, the next upside targets would be:
Target 1: $77,000
The first major resistance after the breakout.
Target 2: $82,000
A previous reaction area and psychologically important level.
Target 3: $88,000–$90,000
The larger recovery target shown on the chart.
A breakout above $74,000 could also force short sellers to close positions, potentially accelerating the move through a short squeeze.
Bearish scenario
The bearish risk remains significant.
Bitcoin is still below a falling 200-day moving average and has not broken the sequence of lower highs. Until that changes, every rally can technically be treated as a countertrend move.
A decisive daily or weekly close below $60,000 would weaken the setup and expose:
$57,000–$58,000
$54,000–$55,000
Potentially the psychological $50,000 level
The greatest warning signal would be a breakdown below $60,000 followed by a failed attempt to reclaim it. In that case, former support could turn into resistance and create another wave of selling.
The bigger picture
Bitcoin is currently caught between two opposing forces.
On one side, the chart remains bearish, corporate treasury models are under pressure and some large holders have begun managing or reducing parts of their positions.
On the other side, Strategy still holds more than 843,000 BTC, Trump-linked American Bitcoin continues building its treasury through mining, and political support for the cryptocurrency sector remains stronger than during previous cycles.
The market does not need immediately bullish news to recover. It needs selling pressure to weaken while long-term demand continues absorbing supply.
That process may already be taking place around $60,000.
Key levels
Major support: $60,000–$63,000
Local confirmation: $66,000–$67,000
Breakout zone: $70,000–$74,000
Bullish targets: $77,000 / $82,000 / $88,000
Bearish invalidation: Confirmed breakdown and failed reclaim of $60,000
Bitcoin has not confirmed a reversal yet.
But with price compressed near major support, corporate and politically connected entities still holding substantial exposure, and the descending trendline moving closer to the market, the next breakout could determine the direction of BTC for the rest of the summer.
The opportunity is not the prediction. The opportunity is the asymmetric setup between clearly defined support and a potential structural breakout.  Long
Long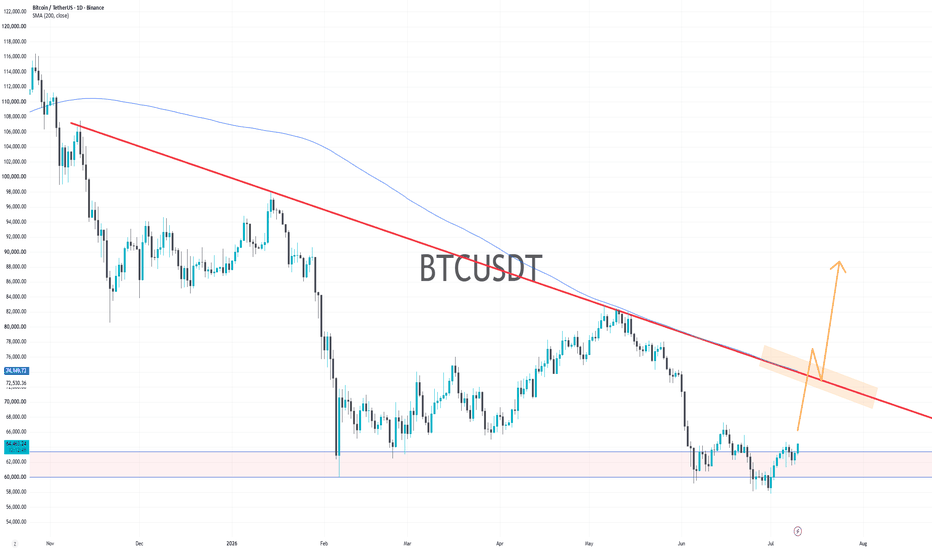
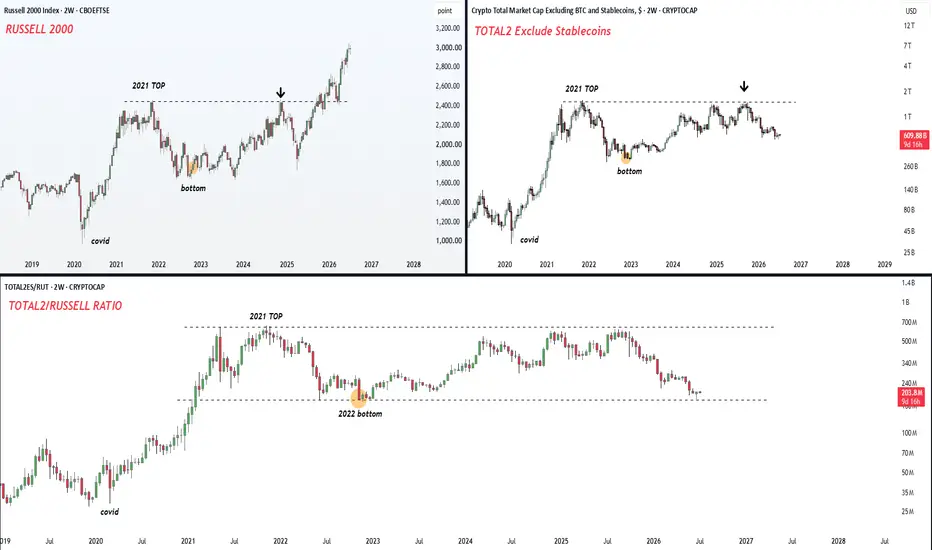
TOTAL2 Exclude Stablecoins vs Russell 2000his chart compares two different risk markets.
On the left, Russell 2000.
On the right, the crypto market excluding Bitcoin and stablecoins.
At the bottom, the relative ratio between the two.
The purpose is simple: Is the broader crypto market structurally dead, or is it still lagging behind traditional risk assets before a new rotation phase? Russell 2000 already completed its post 2021 repair.
It made the 2021 top.
It corrected.
It formed the 2022 bottom.
It retested the old high.
Then it broke out and moved into a new expansion phase.
TOTAL2 excluding BTC and stablecoins is following a similar broad structure, but with a clear delay.
It also made the 2021 top.
It also corrected into the 2022 bottom.
It also rebuilt through 2023 and 2024.
It also returned near the old high region.
But unlike Russell 2000, it has not confirmed a clean breakout yet.
That is the key difference. relative ratio is now near the same lower range that marked the 2022 bottom area. means the broader crypto market is not expensive versus Russell 2000 here.
It is deeply reset.
The ratio is sitting near a region where previous relative weakness reached exhaustion before recovery started.
That does not mean immediate expansion.
It means the market is back in a historical relative value zone.
For the bullish rotation thesis, two things matter now:
First, TOTAL2 excluding BTC and stablecoins must defend its higher base.
Second, the ratio against Russell 2000 must stop losing ground and start reclaiming the lower range. If that happens, the setup changes from lagging risk asset to relative recovery candidate. If the ratio breaks below the 2022 relative bottom and TOTAL2 loses its base, the structure weakens.
So the chart is not giving a completed signal yet.
It is showing a location.
Russell 2000 has already moved through its repair and breakout phase.
Crypto excluding BTC and stablecoins is still sitting at the delayed version of that same question. market is not asking whether altcoins are popular. Its asking whether the broad crypto risk curve can finally stop underperforming traditional small cap risk. the level to watch.  Long
Long
Gold | One More Wave… or Has Wave B Already Begun?XAUUSD – 4H Elliott Wave Analysis
According to the higher-degree Weekly and Daily wave counts, Gold appears to be developing Wave IV. This analysis is built upon the Elliott Wave Principle, adhering to its core rules and structural guidelines rather than relying on price prediction.
The first component of this structure is a Leading Diagonal, which may have already reached completion. If confirmed, the market could initiate a short-term bullish move, representing Wave B within the larger corrective structure.
However, an alternative scenario remains equally valid. One final decline may still be required to complete the Leading Diagonal before Wave B can begin. Until price confirms the structure, both scenarios should remain under consideration.
Once the Leading Diagonal is complete, the preferred expectation is for Wave B to unfold, followed by Wave C, ultimately completing Wave IV as a classic Zigzag (A–B–C). Structurally, the 50.0%–61.8% Fibonacci retracement zone remains the most probable region for the completion of this corrective phase.
Another critical factor to monitor is the relationship between Gold and the U.S. Dollar Index (DXY). Whether their traditional inverse correlation remains intact or temporarily weakens will likely influence the path, momentum, and timing of the remaining corrective structure.
As always, the objective is not to predict price, but to identify the market's structural development. The structure will determine the path; price will simply reveal it.
This analysis represents a structural roadmap based on the Elliott Wave Principle. The market will ultimately confirm or invalidate the scenario.
Signature
Price is the outcome; Structure is the cause.
Patterns whisper. I listen.
— Mr.Nobody
Gold Spot / U.S. Dollar
7 days ago
Is the Leading Diagonal Signaling the Beginning of Wave IV?
 Long
Long
BTCUSD 30M | Final Compression Before Explosion📈 BTCUSD | The Final Vector Compression Before Structural Expansion
━━━━━━━━━━━━━━━━━━━━━━━━━━━━━━━━━━
⏳ Market Condition
The market is approaching a critical convergence where price, time, and structural geometry are reaching simultaneous maturity.
Every major turning point during this sequence has developed around the same rigid framework, confirming that Bitcoin is respecting an organized structural rhythm rather than moving through random volatility.
━━━━━━━━━━━━━━━━━━━━━━━━━━━━━━━━━━
🧩 Structural Framework
The reactive footprints established across Vector Alpha, Beta, Gamma, and Delta prove that every impulsive vector has precisely obeyed the same underlying architectural matrix.
The current downward pressure into Vector Omega represents the final corrective phase within this geometric sequence, guiding price action directly into the primary execution gate.
━━━━━━━━━━━━━━━━━━━━━━━━━━━━━━━━━━
⏰ Time & Price Confluence
More importantly, the projected 0.618 time-extension window, combined with the structural floor beneath Vector Omega, creates a high-probability decision zone.
This area is not simply a horizontal support level; it is the exact intersection where price location, structural geometry, and timing converge into a single execution point.
Markets always unleash their most violent moves when these elements align simultaneously.
━━━━━━━━━━━━━━━━━━━━━━━━━━━━━━━━━━
🚀 Potential Scenario
If buyers successfully defend this region, the current correction represents nothing more than the final phase of structural accumulation before a new impulsive leg develops.
A successful reaction from this zone will open the path to breach the descending trendline and initiate the next high-velocity expansion.
━━━━━━━━━━━━━━━━━━━━━━━━━━━━━━━━━━
⚠️ Final Observation
The market will always confirm the outcome.
But when Price, Time, Structure, and Geometry begin speaking the same language across the Vector Matrix, ignoring the message becomes increasingly difficult.
━━━━━━━━━━━━━━━━━━━━━━━━━━━━━━━━━━
⚠️ Scenario Invalidation
This scenario will remain valid only if Vector Gamma's structural floor at 61,508.56 holds until price reaches the projected 0.618 time-extension window.
A breakdown below 61,508.56 before the market reaches the 0.618 time window will invalidate this entire bullish scenario.
━━━━━━━━━━━━━━━━━━━━━━━━━━━━━━━━━━
✍🏻 Mohsen Nirumand
Long 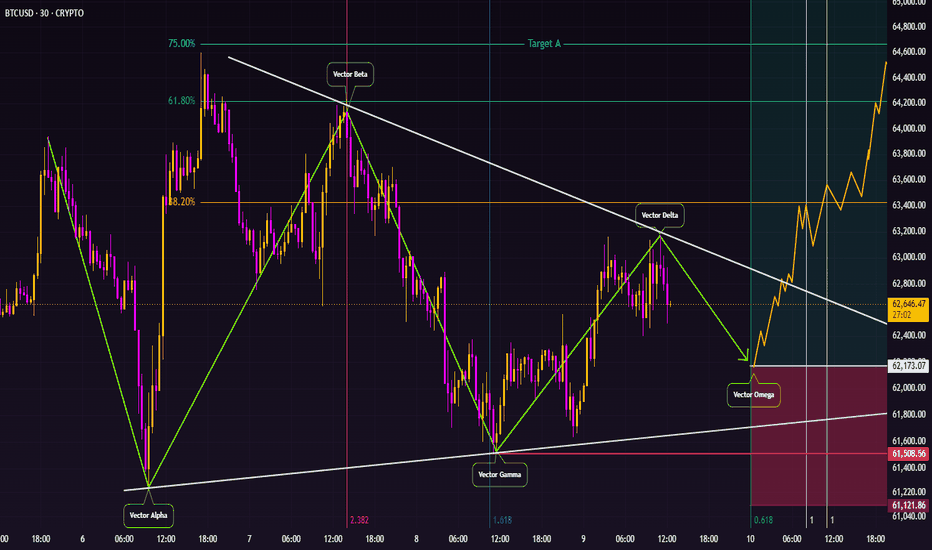
Bitcoin (BTC/USD): Simple Zigzag Remains the Preferred Structure# **Aggressive Scenario**
This analysis explores the aggressive scenario through the development of a **Simple Zigzag**, presenting the complete structure of this corrective pattern in accordance with the **rules and guidelines of Ralph Nelson Elliott's Wave Principle**.
Although last week's analysis highlighted the formation of **seven swings**, suggesting that the correction could be evolving into a **Double Zigzag**, the possibility still remains that the market may expand into any valid corrective pattern with greater **time, price, and structural complexity**. However, based on the current wave structure and the **personality of Bitcoin's market behavior**, the preferred interpretation continues to favor another decline.
According to the current wave count, the market is developing **Wave (1)** and **Wave (2)** of a larger-degree **Wave C**. Therefore, as long as price continues to respect the **First Price Invalidation Analysis ($82,807.3)**, this aggressive scenario remains the preferred interpretation.
Consequently, any valid corrective structure that develops as **Wave (2)** should be viewed, under the Elliott Wave Principle, as a temporary correction. Once completed, the market is expected to resume its decline in **Wave (3)**, continuing toward the downside targets identified on the chart.
As with every Elliott Wave analysis, the market itself will ultimately determine which structure unfolds. **We do not predict price; we follow the structure that the market builds.** Therefore, this analysis represents a **structural interpretation**, not a price forecast. Should market structure change or the rules of the Elliott Wave Principle be violated, the preferred wave count will be revised accordingly.
---
**— Mr. Nobody**
*Independent Elliott Wave Principle Researcher*
**"Patterns whisper. I listen."** 📊🎧
Bitcoin
4 days ago
Bitcoin 4H | Is the First Bearish Leg Complete.
Short 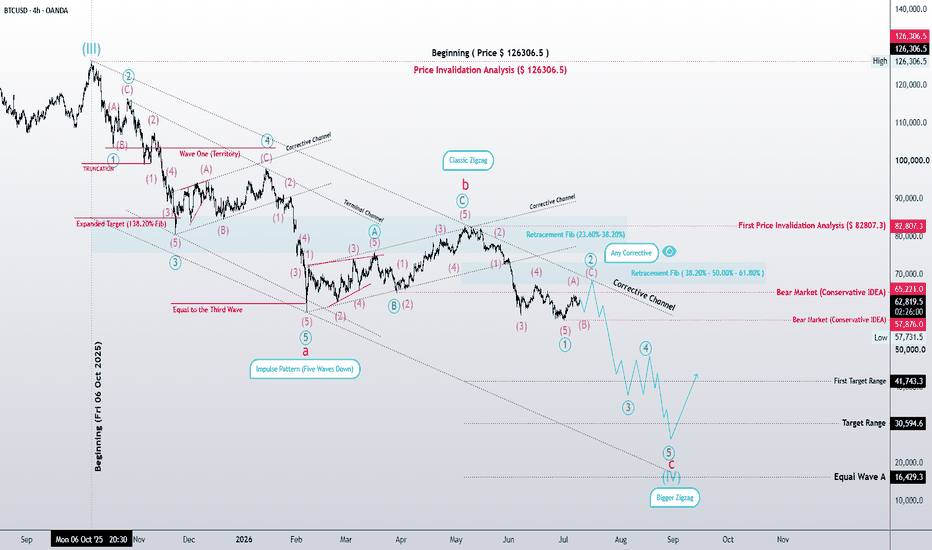
Short 
Wave (IV) May Be Preparing the Next Bullish CycleBitcoin Futures (BTC1!) – Daily Chart
Aggressive Scenario: Wave (IV) May Be Preparing the Next Bullish Cycle
Based on the current market structure, the preferred wave count is derived from the rules and guidelines of the Elliott Wave Principle.
The preferred interpretation suggests that the decline from the recent high is developing as Wave (IV) of a larger degree. At this stage, the correction is most likely unfolding as a Bigger Zigzag, with the market progressing through its internal a-b-c structure before Wave (IV) reaches completion.
As long as this wave count remains structurally consistent, the completion of Wave (IV) could provide the foundation for the next impulsive advance in Wave (V).
Based on the current wave structure and Fibonacci relationships, the initial objective would be the First Target Range, followed by the Target Range. If Wave (V) extends, the market could eventually reach the Expanded Target, completing another major impulsive sequence.
However, until Wave (IV) is confirmed as complete, every bullish objective should be viewed strictly as a structural scenario, rather than a price prediction. The ongoing corrective structure will determine whether Wave (IV) concludes as a relatively straightforward correction or evolves into a more complex pattern, such as a Multiple Zigzag or another valid corrective formation.
For this reason, the primary focus remains on monitoring the internal development of Wave (IV). Only after the correction is structurally complete can the probability of the next impulsive advance in Wave (V) be evaluated with greater confidence.
If the completion of Wave (IV) is confirmed, the larger bullish cycle is expected to resume. Under this scenario, Wave (V) could carry Bitcoin beyond its previous all-time high and establish a new historical high. The ultimate extent of Wave (V), however, will depend on the strength and quality of the impulsive structure emerging from the completion of Wave (IV).
This analysis presents a structural interpretation based on the Elliott Wave Principle and should not be considered a price prediction. The preferred wave count will be reassessed whenever market structure no longer supports the current interpretation.
— Mr. Nobody
Independent Elliott Wave Principle Researcher
"Patterns whisper. I listen." 📊🎧 Short 
Aggressive Scenario: Wave (IV) Remains the Preferred OutlookBitcoin (BTC/USD) – Weekly Chart
Aggressive Scenario: Wave (IV) Remains the Preferred Outlook
From a structural perspective, the current wave count remains valid based on the rules and guidelines of the Elliott Wave Principle.
The preferred interpretation is that Bitcoin is currently developing Wave (IV) of a larger degree. At this stage, the most probable corrective structure remains either a Simple Zigzag or, should the correction become more complex, a Multiple Zigzag.
Based on the current structure, the $30,000–$40,000 region continues to represent the preferred target zone for the completion of Wave (IV).
However, if the correction extends into a larger and more complex structure, Wave (IV) could eventually retrace toward the price territory of Wave (4) of Wave (5), located near $15,000. At the present time, there is insufficient structural evidence to favor such an extended correction.
According to the Elliott Wave Principle, the probability of a deeper retracement can only be evaluated after at least three waves of the corrective structure have been completed. Until then, the internal structure of the correction should continue to guide the preferred wave count.
Therefore, the primary expectation remains the completion of Wave (IV) as either a Simple Zigzag or a Multiple Zigzag, with the $30,000–$40,000 region serving as the preferred target. Any assessment of a deeper decline toward the territory of Wave (4) of Wave (5) will depend on how the corrective structure develops in the coming months.
This analysis presents a structural interpretation based on the Elliott Wave Principle and should not be considered a price prediction. The wave count remains valid as long as market structure continues to support it. Any violation of Elliott Wave rules or structural changes may require a revised wave count.
— Mr. Nobody
Independent Elliott Wave Principle Researcher
"Patterns whisper. I listen." 📊🎧 Short 
Simple Zigzag Toward the Completion of the Corrective CycleBitcoin (BTC/USD) – Daily Chart
Aggressive Scenario: Simple Zigzag Toward the Completion of the Corrective Cycle
The aggressive scenario continues to favor the development of a Simple Zigzag (A-B-C) correction. If this structure unfolds as expected, Bitcoin could decline toward the $40,000 region before the larger corrective cycle reaches completion.
As illustrated on the chart, Wave A has already completed as a clear five-wave impulse, satisfying one of the defining characteristics of a Zigzag correction. Following that decline, Wave B developed as a Classic Zigzag, and the most recent selloff is currently interpreted as Wave (1) of Wave C.
If this wave count remains valid, the current advance is expected to unfold as Wave (2) in the form of any valid three-wave corrective structure. Once that correction is complete, the market could resume its decline in Wave (3), followed by a corrective Wave (4) before a final decline in Wave (5) completes Wave C and, consequently, the entire Simple Zigzag correction.
Under this scenario, the completion of the correction would also mark the end of the current eight-wave Elliott Wave cycle, potentially paving the way for the beginning of a new impulsive cycle. If confirmed, this new cycle could carry Bitcoin beyond its previous all-time high and establish a new historical high.
However, if the current rally extends beyond the expected corrective structure, there remains the possibility that the correction evolves into a Triple Zigzag. While this alternative still belongs to the aggressive outlook, the Simple Zigzag currently remains the preferred scenario, as it provides the most direct interpretation while remaining fully consistent with the present wave structure.
This analysis presents a structural Elliott Wave scenario, not a price prediction. The wave count remains valid as long as the Elliott Wave Principle and the current market structure continue to support it. Should the structure change, the wave count will be revised accordingly.
— Mr. Nobody
Independent Elliott Wave Principle Researcher
"Patterns whisper. I listen." 📊🎧
Bitcoin
Feb 5
Bitcoin Daily – Wave I Completed, Corrective Phase in Progress
Bitcoin
Feb 5
Bitcoin 4H – Final Leg of the Bearish Impulse (Wave 5 of 5)
Bitcoin
4 days ago
Bitcoin 4H | Is the First Bearish Leg Complete.
Short 
Long 
 Long
Long
AAPL: The Death of Apple’s 2-Decade Empire Has a Date🚨 Macro Structural Exhaustion: When Price, Time, and Geometry Reach Their Final Convergence
━━━━━━━━━━━━━━━━━━━━━━━━━━━━━━━━━━
Markets do not enter historic declines because of news.
They enter them when a long-term structural cycle consumes its final unit of time.
━━━━━━━━━━━━━━━━━━━━━━━━━━━━━━━━━━
The weekly architecture reveals that Apple's historic expansion, initiated from the 2004 structural origin, has entered its terminal phase of maturity.
For more than two decades, every correction has remained imprisoned within a rigid geometric framework, allowing the market to compound into one of the greatest bullish expansions in modern financial history.
That process is now approaching its structural conclusion.
━━━━━━━━━━━━━━━━━━━━━━━━━━━━━━━━━━
Price has reached the upper terminal boundary of the long-term geometric channel.
At the very same location, the 261.8% Fibonacci Expansion completes its projected objective, while the Time Projections converge into the identical structural window.
These are not isolated signals.
They are independent structural systems reaching the same destination simultaneously.
When Price, Time, and Geometry expire together, the market no longer behaves like an expanding trend.
It begins to behave like a completed cycle.
━━━━━━━━━━━━━━━━━━━━━━━━━━━━━━━━━━
⏳ The Rigid Chronological Boundaries (Time Projections)
According to this structural model, the remaining lifespan of the ongoing expansion is becoming critically limited.
The countdown is no longer measured in price; it is measured in structural time:
━━━━━━━━━━━━━━━━━━━━━━━━━━━━━━━━━━
The High-Probability Trigger Zone (0.618 Time Projection):
Our primary calculations isolate August 17, 2026 as the strongest structural window where the macro reversal and heavy decline are mathematically poised to initiate.
━━━━━━━━━━━━━━━━━━━━━━━━━━━━━━━━━━
The Absolute Invalidation Ceiling (1.000 Time Projection):
The maximum permissible lifespan for this entire bullish cycle is chronologically bounded.
October 5, 2026 represents the absolute maximum time limit for wave development.
Beyond this coordinate, the expansion energy is completely terminated.
━━━━━━━━━━━━━━━━━━━━━━━━━━━━━━━━━━
If the current alignment completes as projected, the next macro phase may no longer resemble a conventional correction.
It may represent the beginning of a large-scale structural rebalancing capable of unwinding a substantial portion of the expansion built since 2004.
The market is no longer searching for higher prices.
It is approaching the point where the architecture of the entire cycle is tested.
━━━━━━━━━━━━━━━━━━━━━━━━━━━━━━━━━━
✍🏻 Mohsen Nirumand  Short
Short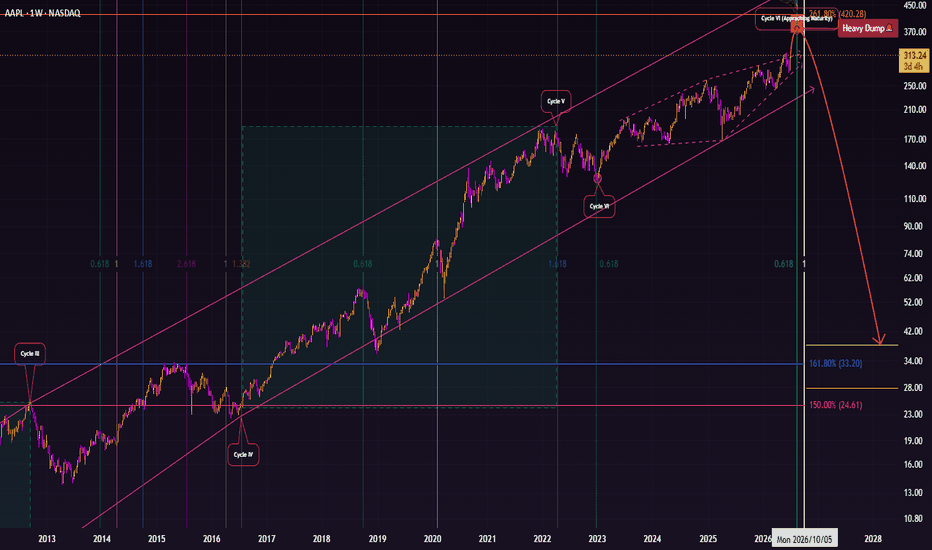
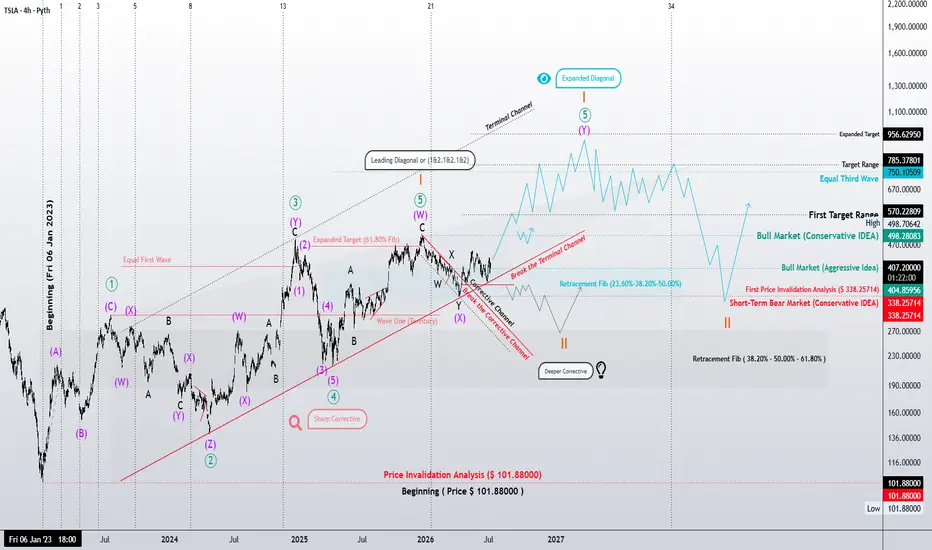
TSLA 4H: Extended Leading Diagonal or a Deeper Correction?
"Price is the consequence. Structure is the cause."
This four-hour structural analysis of Tesla (TSLA) examines the market through the principles of Elliott Wave Theory. Rather than forecasting price alone, the objective is to determine the market's current position within the larger wave structure and identify the most probable path forward.
Primary Thesis — Extended Leading Diagonal
The preferred interpretation views the current structure as a Leading Diagonal exhibiting structural extension, provided that the first structural invalidation level at $338.25714 remains intact.
Although "Extended Leading Diagonal" is not a formal Elliott Wave pattern, the current price development displays characteristics consistent with a diagonal extending beyond the proportions typically observed.
So far, the present advance has traveled only 61.8% of the preceding third wave, leaving room for additional structural expansion.
If this interpretation is correct, a confirmed breakout above $498.70642 could initiate a strong multi-swing advance, displaying momentum similar to an impulsive sequence while completing the terminal portion of the diagonal. A proportional correction would then be expected before the broader uptrend resumes.
Structural Targets
• First Target: $465.44267
• Primary Target: $570.22809
• Extended Targets: $750.10509 and $956.62950
Secondary Thesis — Conservative Development
The conservative interpretation assumes that the current Leading Diagonal has already completed, but the market still requires a more mature corrective phase before the next impulsive advance begins.
That correction could develop as:
Zigzag
Double or Triple Zigzag
Flat
or a more complex corrective combination.
According to Elliott Wave guidelines, corrections following a Leading Diagonal are often deeper and more time-consuming than the decline currently observed.
Only a clearly developing series of nested 1-2 sequences would significantly strengthen the case that the next higher-degree third wave has already begun.
Both scenarios remain structurally bullish over the long term. Their only difference lies in the depth, duration, and internal development of the current correction.
Structural Cycle
Under the preferred wave count, Tesla continues progressing toward the completion of a higher-degree eight-wave cycle, with the current roadmap projecting structural completion around March 2027, assuming Elliott Wave relationships remain valid.
Key Technical Levels
Bull Market Confirmation: $498.28083
Critical Structural Validation: $101.88
First Structural Invalidation: $338.25714
Structural Observation
An alternative interpretation remains under observation.
The current structure could eventually prove to be an Ending Diagonal completing Primary Wave (III), which would imply that a larger Primary Wave (IV) correction is still ahead.
At present, however, the available structural evidence continues to favor the Leading Diagonal interpretation. The alternative count remains part of ongoing Elliott Wave research, recognizing that structural interpretation evolves with price rather than personal conviction.
Markets rarely move in a straight line.
Structure provides the context. Price delivers the evidence.
Patterns whisper. I listen.
– Mr. Nobody 🎧📊
Elliott Wave Researcher
Gold Spot / U.S. Dollar
Feb 13, 2024
My view after two years (Sharp correction pattern)
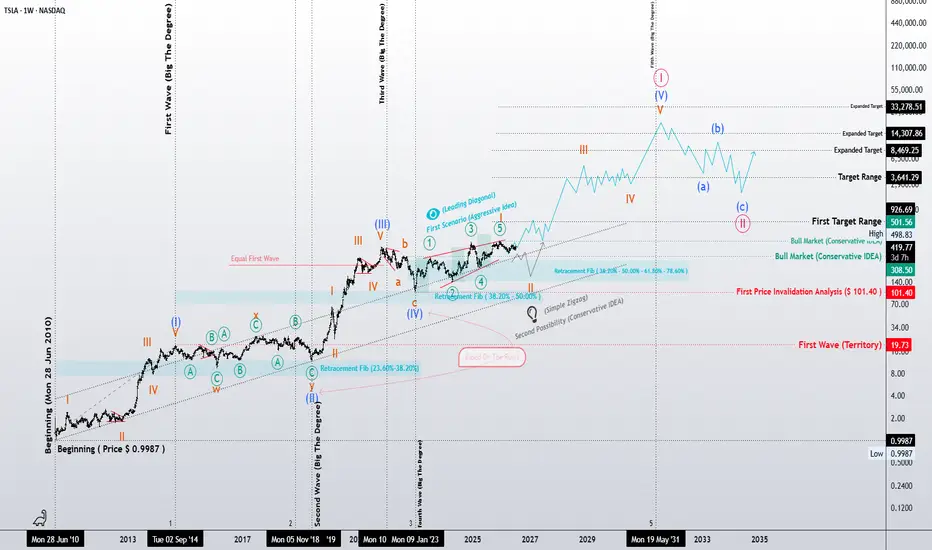
TSLA: A Structural Blueprint of the Grand Cycle
"Price is the consequence. Structure is the cause."
This analysis is not a simple price forecast. Rather, it is a structural study of Tesla's position within its Grand Cycle through the principles and guidelines of Elliott Wave Theory.
Since its 2010 low, Tesla has developed a sequence of impulsive and corrective waves, each forming part of a much larger market geometry. The objective of this study is to identify the market's current position within that hierarchy and explore the most probable paths ahead based on wave structure, Fibonacci relationships, and Elliott Wave principles.
Aggressive Scenario (Turquoise Path): A Developing Leading Diagonal
The primary interpretation assumes that Primary Wave (IV) has already completed and the market has begun constructing a Leading Diagonal, marking the first phase of a new higher-degree impulsive cycle.
Within Elliott Wave Theory, a Leading Diagonal typically emerges at the beginning of a new trend, when market sentiment remains uncertain and confidence has yet to fully return. Rather than signaling weakness, this structure often reflects the gradual transition from accumulation toward expansion.
The key question is therefore:
Has the current correction already fulfilled the structural requirements of a Leading Diagonal?
If the answer proves to be yes, Tesla may already have established the structural foundation for the next higher-degree advance, potentially leading into a powerful Primary Wave (III), which is often the strongest and most dynamic phase of an impulsive sequence.
Conservative Scenario (Blue Path): The Correction May Require Further Development
The conservative interpretation remains equally bullish over the long term but suggests that the current correction may not yet be structurally complete.
Under this scenario, the market could still require a more mature corrective formation, such as:
Zigzag
Flat
or a more complex corrective combination
Once that correction is completed—while respecting Elliott Wave rules and structural guidelines—the market would still be expected to follow the same long-term bullish path illustrated by the aggressive scenario.
In other words, the destination remains the same. The only difference lies in the maturity, depth, and internal structure of the current correction.
Key Structural Levels
Structural Invalidation Level: 101.40
First Wave Territory: 19.73
The long-term objectives presented in this study are not arbitrary price projections. They are derived from Fibonacci expansion relationships and the mathematical structure of Elliott Wave development.
Research Note
Alongside the two primary scenarios, an alternative wave count remains under continuous evaluation.
Under this alternative interpretation, the current diagonal could ultimately prove to be an Ending Diagonal, completing Primary Wave (III) rather than initiating a new impulsive cycle. Should that interpretation prevail, the market would still require a larger-degree Primary Wave (IV) correction before the next long-term advance begins.
At present, however, the available structural evidence continues to favor the Leading Diagonal interpretation. The Ending Diagonal remains a secondary research hypothesis, maintained not because it is currently preferred, but because Elliott Wave analysis requires every credible structural alternative to remain open until the market itself resolves the pattern.
My objective is not to defend a preferred wave count, but to continuously refine structural understanding through the observation of real market behavior.
Markets are often dominated by noise.
Structure reveals the logic behind price.
Patterns whisper. I listen.
– Mr. Nobody 🎧📊
Elliott Wave Researcher  Long
Long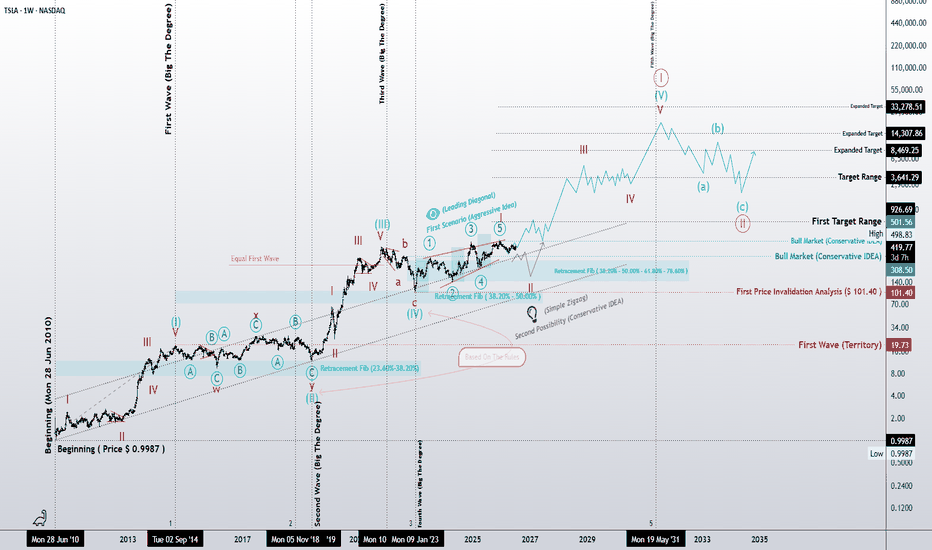


 Long
Long Short
Short