GOLD - The Hunt for Liquidity (Correction) Before the Drop ICMARKETS:XAUUSD has paused its decline but remains under pressure. Market stagnation could trigger a rebound before another move lower. The key events are the Trump–Xi meeting, oil price dynamics, and Treasury yields.
The fundamental backdrop for gold remains weak. The market could form a correction amid the meeting between the U.S. and Chinese presidents, but the medium-term tone for the metal remains bearish, driven by a strong dollar and rising oil prices. The dollar and major indices are temporarily correcting, which could allow gold to rebound toward the 4,322–4,333 liquidity zone before continuing lower toward 4,230–4,200.
Drivers:
Downside: rising oil prices and yields, dollar strength, hawkish Fed, escalation in the Middle East.
Upside: falling oil prices and yields, softer U.S. data, progress in trade negotiations, de-escalation.
Resistance levels: 4300, 4322
Support levels: 4275, 4250, 4200
Technically, the market remains in a medium-term bearish trend amid the weak fundamental backdrop. Against the backdrop of the upcoming news, gold could retest the 4,320 liquidity zone, while a short squeeze could in turn trigger further downside.
A close below 4,275 would also increase selling pressure, which could lead to further downside toward 4,200.
Best regards, R. Linda!  Short
Short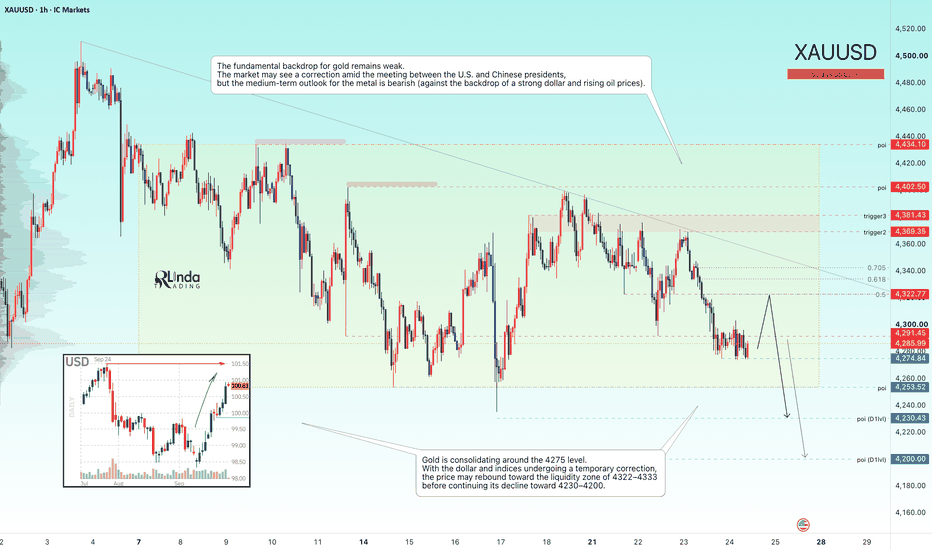
XAUUSD — Wave 5 Drop Before Rebound
Gold is still moving inside a bearish channel after failing to hold above the short-term support area. From Kelly’s view, the chart suggests that XAUUSD may still need one more downside leg to complete wave (5), before a light corrective rebound appears from the lower buy zone.
The key idea is simple: gold may continue lower first toward the End wave 5 / Buy zone, then create a short ABC recovery back toward the resistance area.
⟡ Market structure
Gold is currently trading around 4,263, after breaking below the previous support near 4,275. This shows that sellers are still controlling the short-term structure.
The market remains inside a descending channel, and price is still printing lower highs under the trendline. As long as gold stays below the 4,290–4,298 sell zone, the bearish wave structure remains valid.
The next important downside area is the 4,245–4,252 End wave 5 / Buy zone. This zone may act as the final reaction area for the current bearish wave. If buyers defend this area, gold may create a light rebound toward 4,275, then possibly 4,290–4,298.
➤ Key levels
◌ Current price area: 4,263
◌ Strong support turned resistance: 4,275
◌ End wave 5 / Buy zone: 4,245–4,252
◌ Short-term rebound target: 4,275
◌ Main sell zone: 4,290–4,298
◌ Bearish invalidation: above 4,305
⌁ Elliott Wave view
The chart shows a bearish Elliott Wave structure developing inside the descending channel.
Wave (1) started after price rejected from the upper area.
Wave (2) created a corrective rebound but failed under resistance.
Wave (3) pushed gold lower toward the lower channel structure.
Wave (4) created a small recovery near 4,290, but sellers rejected it again.
Wave (5) may now continue toward 4,245–4,252 to complete the bearish sequence.
After wave (5) completes, gold may form a small ABC correction. In that case, the rebound target could be 4,275 first, then the stronger sell zone around 4,290–4,298.
▸ Trading scenario
Preferred bearish scenario
Entry: Sell on rejection below 4,275–4,290
Stop Loss: Above 4,305
Take Profit 1: 4,252
Take Profit 2: 4,245
Rebound scenario after wave 5
If gold reaches 4,245–4,252 and gives bullish reaction, price may correct upward toward 4,275, then 4,290–4,298.
This rebound should be viewed as a correction first, not a confirmed bullish reversal, unless gold breaks and holds above the sell zone.
◌ Invalidation
The bearish view becomes weaker if gold breaks above 4,305 and holds above the sell zone. In that case, the current wave (5) downside setup may fail, and price could attempt a stronger recovery.
⌁ Kelly’s view
Kelly’s main view remains bearish first, with gold likely to complete wave (5) near 4,245–4,252. After that, a light corrective rebound may appear toward 4,275 or 4,290–4,298.
The cleaner plan is not to chase price at the current level, but to watch whether gold completes wave (5) at the lower buy zone and then reacts with a short recovery.
Do you think gold will complete wave (5) first, or rebound before reaching the lower buy zone? Short 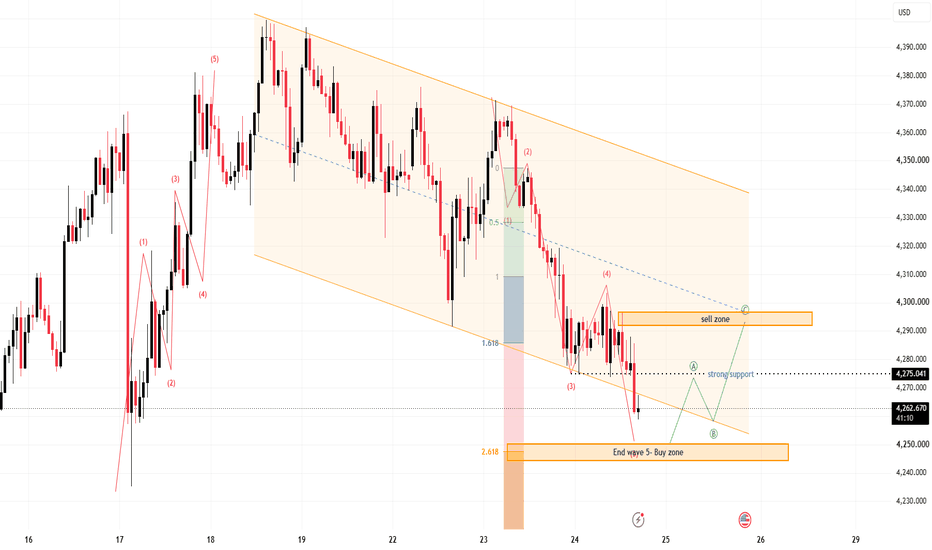
XAUUSD — Wave 5 Lower Toward 4,290
From Kelly’s view, gold remains inside a clear bearish structure and continues to respect the descending channel. Price is currently trading around 4,324, below the key resistance area near 4,347, while the latest rebound has failed to change the sequence of lower highs.
The key idea is simple: the current recovery may develop into a corrective Wave (4) toward the 4,329–4,334 sell zone, before another bearish leg targets the 4,292–4,285 Wave (5) completion area.
⟡ Market structure
Gold is still moving inside a descending channel, with both the upper trendline and internal structure pointing lower.
The recent decline from the 4,360–4,370 area created another lower high, while price is now trading beneath the 4,329–4,334 resistance zone.
A short-term rebound may retest this area, but as long as sellers defend it, the bearish structure remains intact.
Below current price, the first reaction area sits around 4,309–4,314. If this support fails, attention shifts toward the stronger 4,292 support and the 4,283–4,290 Fibonacci/Wave (5) target zone.
➤ Key levels
◌ Current price area: 4,320–4,325
◌ Main sell zone: 4,329–4,334
◌ Strong resistance: 4,347
◌ First support: 4,309–4,314
◌ Strong support: 4,292
◌ First target: 4,310
◌ Second target: 4,292
◌ Main target: 4,283–4,290
◌ Invalidation: Above 4,347
⌁ Elliott Wave view
Wave (1): The first bearish impulse pushed price lower from the recent local high.
Wave (2): Gold recovered toward resistance but failed to create a bullish structural break.
Wave (3): The next bearish move extended below the internal support structure.
Wave (4): A corrective rebound may now retest the 4,329–4,334 sell zone.
Wave (5): If sellers defend this area, the final bearish leg could extend toward 4,292, followed by the 4,283–4,290 completion zone.
▸ Trading scenario
Preferred bearish scenario
Entry: 4,329–4,334 after bearish confirmation
Stop Loss: Above 4,347
Take Profit 1: 4,310
Take Profit 2: 4,292
Take Profit 3: 4,283–4,290
The cleaner plan is to wait for a corrective retest into resistance rather than chase the move lower. A rejection from 4,329–4,334, followed by a break below 4,309, would strengthen the Wave (5) continuation scenario.
Alternative scenario:
If gold breaks above 4,334 and gains acceptance above 4,347, the current bearish sequence may be delayed and price could attempt a deeper recovery toward the upper channel resistance.
◌ Invalidation
The bearish scenario would weaken if price holds above 4,334. A confirmed breakout and sustained acceptance above 4,347 would invalidate the preferred short-term Wave (5) structure.
⌁ Kelly’s view
Kelly’s main view remains bearish while gold stays below 4,329–4,347.
The key level below is 4,292. If sellers continue to control the structure and price loses this support, the next move may complete Wave (5) around the 4,283–4,290 buy zone, where a stronger bullish reaction could later develop.
Do you think gold will retest the 4,329–4,334 sell zone first, or continue directly toward 4,290? Short 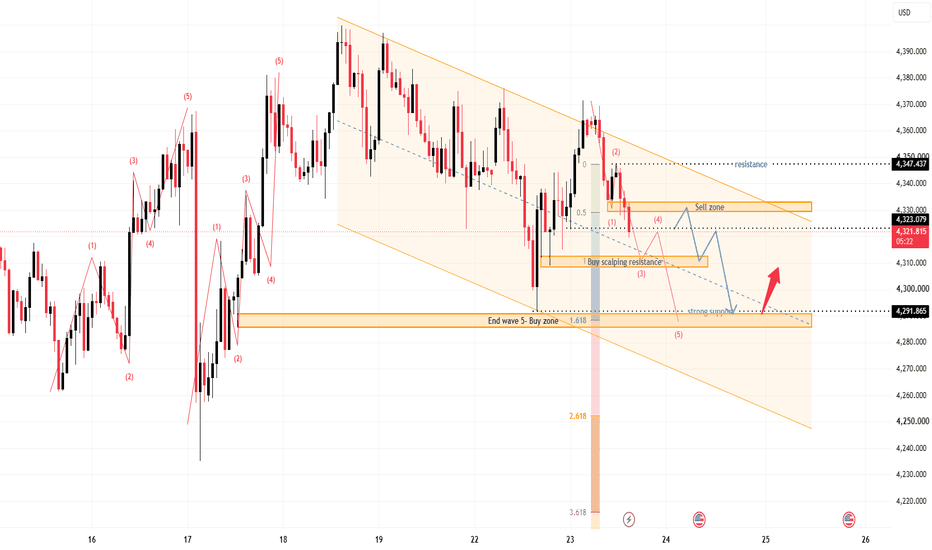
Bitcoin Breakout Retest — Is $90K the Next Target?Bitcoin ( BINANCE:BTCUSDT ) appears to have successfully broken above the Heavy Resistance Zone and is now completing a pullback toward this area.
BTC also reacted very well to the Cumulative Long Liquidation Leverage($83,220-$82,300) and started to move higher from this zone.
Can Bitcoin confirm the breakout and extend its bullish move above $87,000?
Technical Analysis
From an Elliott Wave perspective, Bitcoin appears to have completed Primary Wave 4, suggesting that the next Impulsive Waves could begin developing over the coming hours.
The current pullback toward the previously broken Heavy Resistance Zone could also act as a retest before another bullish move.
💡 Educational Note: After a resistance breakout, a pullback toward the broken zone can act as a bullish retest if buyers successfully defend the area as new support.
I expect Bitcoin to rise at least toward the Cumulative Short Liquidation Leverage.
If bullish momentum increases, BTC could extend the move toward the major Potential Reversal Zone(PRZ) .
Trade Setup
First Take Profit(TP): $86,870
Second Take Profit(TP): $88,810
Stop Loss(SL): $81,770
Cumulative Long Liquidation Leverage: $83,220-$82,300
Upper CME Gap: $87,825-$87,700
Potential Reversal Zone(PRZ): $91,860-$88,760
Do you think Bitcoin can move back above $87,000?
🟢 Yes
🔴 No
📌 Bitcoin Analysis(BTCUSDT), 4-hour time frame.
🛑 Always use proper risk management and set a Stop Loss(SL) for every position.
🚀 If this analysis helps your trading plan, a BOOST would help more traders discover it.  Long
Long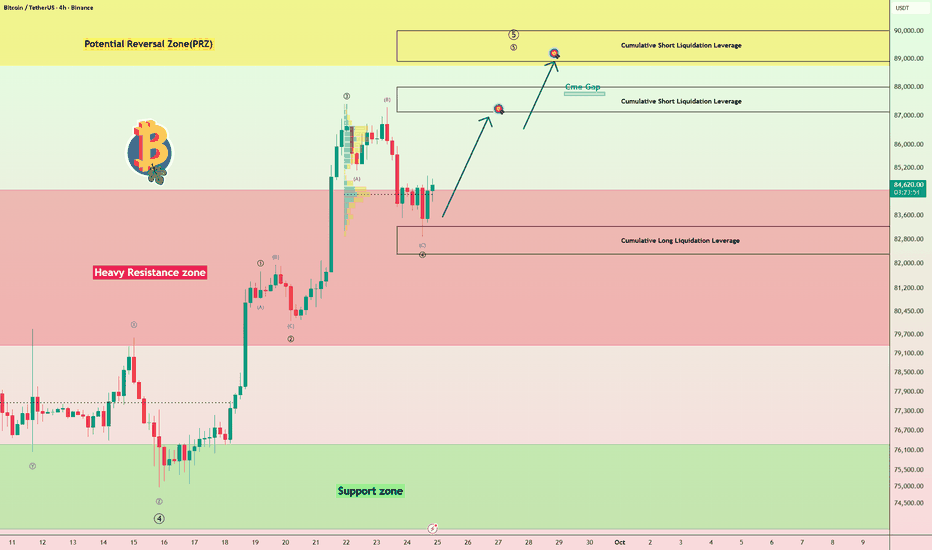
US10Y Is Rising Again: Could 5.1% Trigger Pressure Across GlobalThe U.S. 10-Year Treasury Yield ( TVC:US10Y ) is one of the most important benchmarks for global interest rates and financial conditions.
A strong rise in US10Y can affect U.S. stocks, Gold, Silver, Bitcoin, and the broader crypto market.
Could US10Y continue rising toward 5.1% and create another wave of pressure across financial markets?
Macro Outlook
US10Y represents the yield investors receive from holding a 10-year U.S. Treasury bond and is widely used as a benchmark for long-term interest rates.
Its market impact can be summarized simply:
U.S. Stocks: Higher yields increase borrowing costs and pressure valuations, particularly in growth and technology stocks.
Gold & Silver: Higher yields—especially real yields—and a stronger U.S. Dollar generally create pressure on non-yielding precious metals.
Bitcoin & Crypto: Rising yields can tighten financial conditions, strengthen the Dollar, and reduce risk appetite.
For this reason, US10Y is an important macro indicator to monitor alongside the U.S. Dollar Index(DXY).
Technical Analysis
On the daily time frame, US10Y is approaching an important Resistance Zone after moving inside an Ascending Channel for approximately 190 days.
From an Elliott Wave perspective, the U.S. 10-Year Treasury Yield appears to be completing the main Wave X inside the Ascending Channel.
💡 Educational Note: Rising Treasury yields generally indicate tighter financial conditions, which can reduce demand for risk assets and increase pressure on equities, precious metals, and cryptocurrencies.
Considering recent U.S. economic data, persistent inflationary pressures, and geopolitical risks in the Middle East, I expect US10Y to continue moving higher.
The next major upside target could be around 5.1%.
If this scenario develops, higher Treasury yields could remain an important risk factor for the S&P 500, Nasdaq, Gold, Silver, Bitcoin, and the broader crypto market.
Target: 5.1%
Do you think the U.S. 10-Year Treasury Yield can reach 5.1%?
🟢 Yes
🔴 No
📌 U.S. 10-Year Treasury Yield(US10Y), Daily time frame.
🚀 If this analysis helps your trading plan, a BOOST would help more traders discover it.  Long
Long
BITCOIN - Bullish trend. Consolidation before rallyBINANCE:BTCUSDT.P previously went through a trend reversal phase and broke above the key 83K resistance. Consolidation is forming above this zone, hinting at further upside, however...
The fundamental backdrop remains unstable. However, profit-taking in BTC is currently not particularly strong, and there is no significant selling pressure. Consolidation following the strong rally, along with the weak reaction to negative news, points to market strength. Spot ETF inflows are gaining momentum. Trading volumes are increasing. Altcoins are showing strong growth, so far without significant leverage. Technically, the backdrop is becoming increasingly favorable...
Bitcoin is breaking through the 83K resistance and consolidating above this zone, indicating readiness for a rally. The market is confirming the trend reversal; however, a correction aimed at hunting liquidity could occur before further upside. The key focus is on 82,300–80K.
Resistance levels: 87,400, 90,000, 100K
Support levels: 82,800, 82,300, 80K
The retest of the May support level formed a 82,800–82,300 liquidity pool, which could be tested before another move higher. A long squeeze could shift the balance of power in favor of buyers and trigger further upside toward 90K–100K.
Best regards, R. Linda! Long 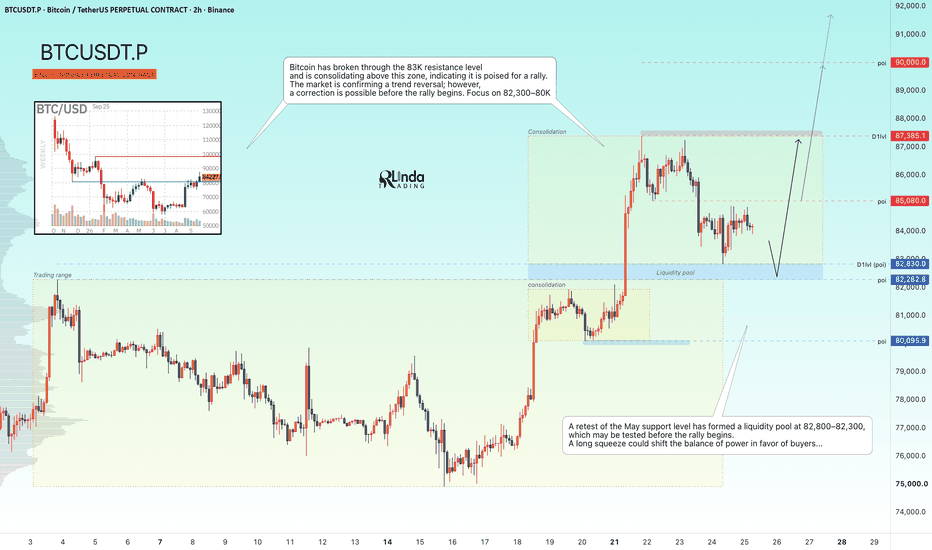
Gold Tests 61.8% Fibonacci — Is the Correction Almost Over?Gold ( OANDA:XAUUSD ) has been in a bearish trend over the past 6–7 days, but the decline has developed with relatively weak momentum.
Interestingly, the bullish move completed in less than two days has still not been fully retraced after nearly a week of declining prices, suggesting that buyers continue to show relative strength.
Can gold defend the Heavy Support Zone and begin another bullish move, or is a deeper correction approaching?
Macro Outlook
The U.S. 10-Year Treasury Yield(US10Y) could also begin a bearish move.
If Treasury yields decline, this could provide additional support for gold and strengthen the short-term bullish scenario.
Technical Analysis
Gold is currently trading near the important 61.8% Fibonacci level on the Daily time frame and inside the Heavy Support Zone($4,274-$4,178).
From an Elliott Wave perspective, on the 4-hour time frame, gold appears to still be completing a Double Three Correction(W-X-Y).
I initially expected this corrective structure to complete earlier, but as long as gold remains above $4,233, the current scenario remains valid.
💡 Educational Note: The 61.8% Fibonacci retracement is one of the most closely watched levels during corrections and can become an important reaction area when it overlaps with a major Support Zone.
I expect gold to start a bullish move after breaking above the key trading level of $4,284, with an initial target around $4,337.
If gold successfully breaks above the key $4,355 level, the bullish move could extend toward $4,381 and potentially higher levels.
Trade Setup
First Take Profit(TP): $4,337
Second Take Profit(TP): $4,381
Stop Loss(SL): $4,229
Key Trading Levels: $4,284 _ $4,355 _ $4,400
Which level do you think gold will reach first?
🟢 $4,381
🔴 $4,229
📌 Gold Analysis(XAUUSD), 4-hour time frame.
🛑 Always use proper risk management and set a Stop Loss(SL) for every position.
🚀 If this analysis helps your trading plan, a BOOST would help more traders discover it. Long 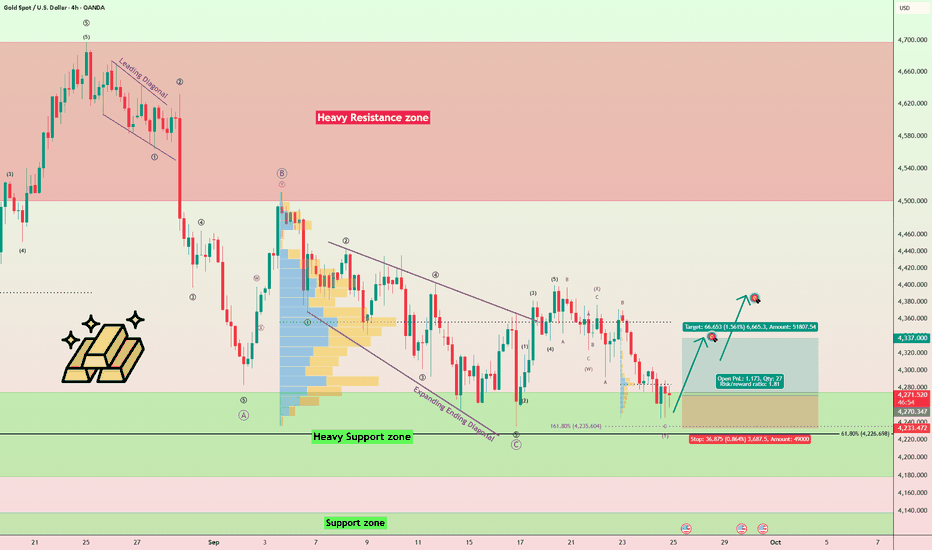
US10Y Enters a Major PRZ: Is a Treasury Yield Correction Next?The U.S. 10-Year Treasury Yield ( TVC:US10Y ) is one of the most important benchmarks for global interest rates and financial conditions.
When US10Y rises sharply, it can tighten financial conditions and pressure stocks, gold, Bitcoin, and other risk assets. A decline in yields can have the opposite effect and support these markets.
US10Y has now entered an important technical area. Can the bullish trend continue, or is a correction about to begin?
Technical Analysis
US10Y has developed a strong bullish move over the past 2–3 days and has now entered the Resistance Zone(5.55%-4.93%).
It is also trading near the upper trendline of an Ascending Channel, the major Potential Reversal Zone(PRZ) , Monthly Resistance 5, and Yearly Resistance 2.
This technical confluence could become an important reversal area.
From an Elliott Wave perspective, US10Y appears to be completing Wave 5, after which corrective waves could begin developing to the downside.
💡 Educational Note: A decline in Treasury yields generally reduces pressure on financial conditions and can support non-yielding assets such as gold, as well as risk assets like Bitcoin and U.S. equities.
I expect the U.S. 10-Year Treasury Yield to begin a corrective move from this area.
If this scenario develops, lower yields could support higher prices in gold, Bitcoin, and major U.S. stock indices.
Trade Setup
First Take Profit(TP): 5.03%
Second Take Profit(TP): 4.95%
Stop Loss(SL): 5.29%
Which level do you think US10Y will reach first?
🔴 4.95%
🟢 5.29%
📌 U.S. 10-Year Treasury Yield(US10Y), Daily time frame.
🛑 Always use proper risk management and set a Stop Loss(SL) for every position.
🚀 If this analysis helps your trading plan, a BOOST would help more traders discover it. Short 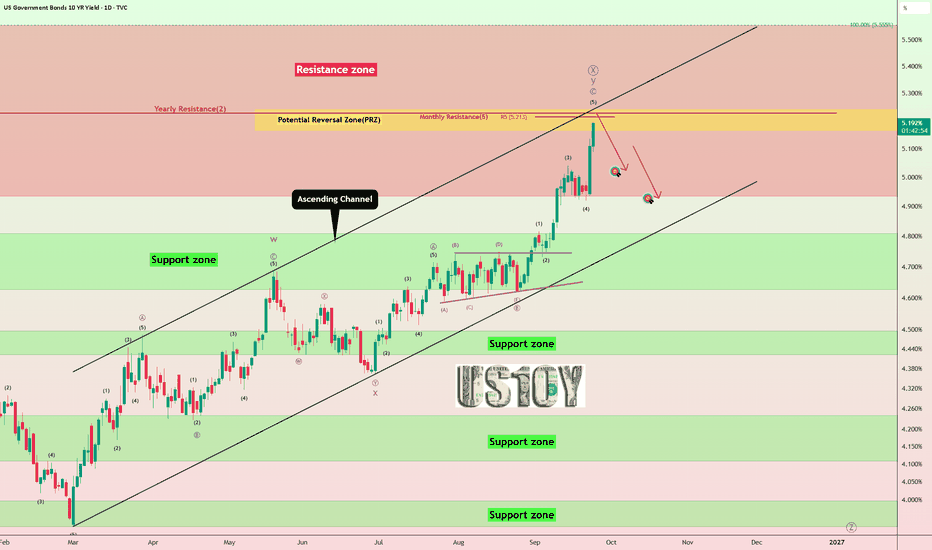
Trading Plan and Analysis - #XAUUSD 25/09/2026M30 Timeframe
Gold extended its decline through midweek, dropping from the 4,340 area down to a low near 4,250 before showing the first real signs of stabilization. The move lower was driven by a stronger US dollar following hotter-than-expected PMI data combined with hawkish commentary from Federal Reserve officials, which pushed market odds of another rate hike in October up sharply to around 70%, from roughly 55% just a day earlier. That's a meaningful shift in policy expectations over a very short window, and it explains the sharp acceleration lower.
Adding to the pressure, oil prices rebounded after Iran's president took a firm public stance on maintaining restrictions around the Strait of Hormuz, reviving inflation concerns that had eased slightly over the past week. Higher oil prices reinforcing a hawkish rate outlook is a double headwind for gold, and it lines up with the sharp move down seen on the chart.
That said, the technical structure from the 4,250 sweep is now showing genuine signs of absorption rather than just a temporary bounce. Price displaced sharply off the low, printed a confirmed CHOCH on M30, broke the prior swing high, and — most importantly — held the retest back into the reclaimed 4,275 - 4,290 order block zone rather than sweeping straight through it. Price is currently consolidating around 4,283 - 4,284, inside that zone.
My view for today leans cautiously constructive in the very near term, since the reclaim of structure is real and confirmed, but this needs to be balanced against a clearly hawkish macro backdrop that could easily resume pressuring gold if today's University of Michigan inflation expectations data comes in hot. This isn't a high-conviction trend day either way — it's a market digesting a fast move and waiting on one more data point.
🟢 BUY SCENARIO
Zone to watch: 4,275 - 4,283 (reclaimed H1 order block)
Confirms if: price holds this zone with a clear bullish reaction and pushes back above 4,290
Invalidates if: clean H1 close back below 4,275, which would put the absorption read in doubt
🔴 SELL SCENARIO (counter-trend, lower priority)
Zone to watch: 4,340 - 4,350 (prior order block / supply)
Confirms if: price rallies into this zone and gets rejected with a bearish M15/H1 CHOCH
Invalidates if: clean break and hold above 4,350
On price levels, near resistance sits at 4,290 - 4,300, with the further resistance at the 4,340 - 4,350 OB zone. On the support side, the near zone is 4,275, and the level that would invalidate today's bullish bias is a clean break below 4,250, the original sweep low.
Today's suggested play: Favor buys on a hold of the 4,275 - 4,283 zone rather than chasing strength, and stay alert around the Michigan inflation expectations release — a hot print could quickly override the bullish technical setup given how sensitive the market has been to rate expectations this week.
This reflects a personal view and technical read from FN Trading Lab based on current market structure, not financial advice or a specific buy/sell recommendation. Please watch price reaction at the levels mentioned and make your own decisions in line with your own strategy. Long 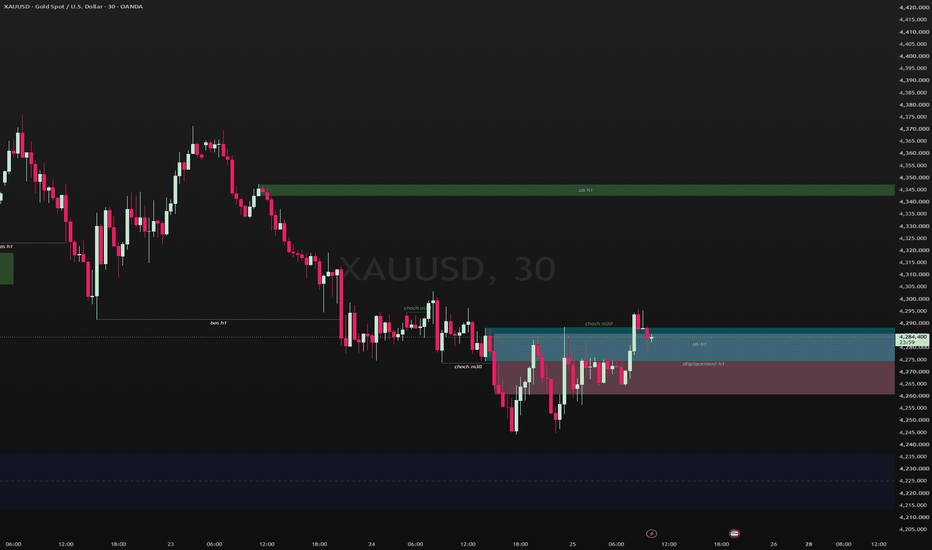
ONDO: $0.485 Is the Confirmation LevelONDO is trading around $0.43, but the important part of the current setup is slightly higher: $0.48546.
That is the level marked on the daily chart as the confirmation of the missing Wave (Y). Until price clears it, the projected upside remains a scenario rather than a confirmed continuation.
Fundamental / News Catalyst
Ondo's tokenization business has had several notable developments in September.
On September 21, Ondo announced in-kind conversion for institutional clients, allowing eligible institutions to mint and redeem tokenized stocks and ETFs directly against the underlying securities rather than first converting through cash. The initial implementation supports Ethereum and BNB Chain.
A few days earlier, Ondo's subsidiary Oasis Pro Markets became the first tokenization platform to join DTCC's Fund/SERV, a network that processes more than 85% of U.S. mutual-fund transaction activity. The integration is intended to connect Ondo's tokenized funds with traditional fund-distribution infrastructure.
Ondo also went live on near.com and NEAR Intents on September 22, bringing 20 tokenized stocks, ETFs and commodity-linked products into the platform. Ondo says its platform now has more than $1 billion in TVL and more than $26 billion in cumulative trading volume.
These developments strengthen the broader tokenization narrative, but they are separate from the technical confirmation on the chart.
Technical Analysis
The daily structure shows ONDO completing a large corrective sequence from the late-2025 highs into the $0.20 area, followed by a recovery and a developing structure higher.
The current count is looking for a missing Wave (Y).
Price is currently around $0.43, just below the key $0.48546 level marked as the confirmation of the missing Wave (Y).
This makes $0.48546 the immediate level that matters.
If price confirms the structure above that area, the first marked target is $0.65650.
The second target sits at $0.86736, corresponding with the 0.618 extension shown on the chart.
There is also a clearly defined invalidation level at $0.29016. A move below this level invalidates the current Triangle of Wave (X) count.
So the setup is relatively straightforward: the structure is developing, but the missing Wave (Y) still needs confirmation.
Key Levels
$0.48546 — Confirmation of missing Wave (Y)
$0.65650 — Wave (Y) first target
$0.86736 — Wave (Y) second target / 0.618
$0.29016 — Wave (X) triangle count invalidation
Bullish Scenario
A sustained move above $0.48546 confirms the missing Wave (Y) according to the current count and opens the path toward $0.65650, followed by $0.86736.
Bearish Scenario
Failure to confirm the Wave (Y), followed by a move lower, would keep the current structure unresolved. The key invalidation sits at $0.29016.  Long
Long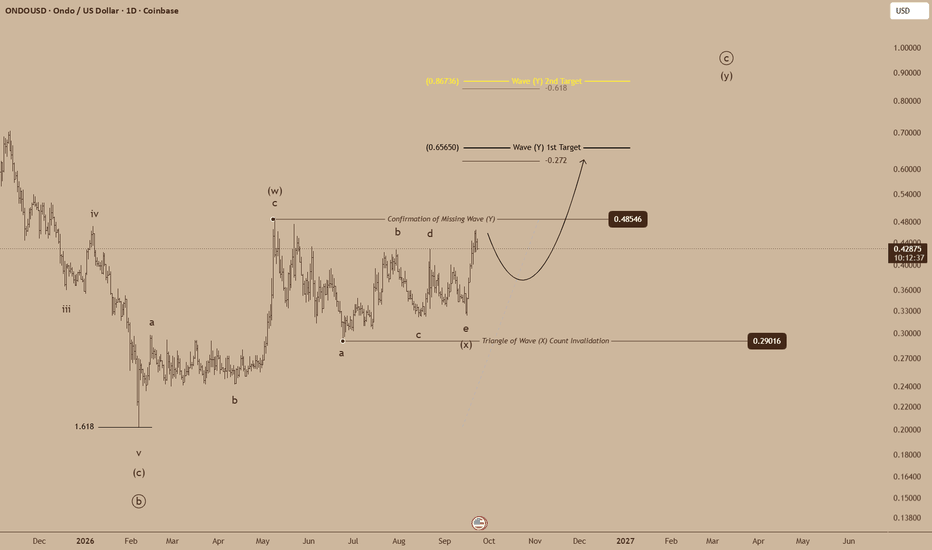
NEAR: $5.45 Is the Next Target if Rally ContinuesNEAR has accelerated sharply from the August lows, reaching $4.6585 on the supplied daily chart. The move has now brought price into the next important area of the Elliott Wave structure, with $4.3953 as the immediate reference and $5.4569 as the next marked target.
Fundamental / News Catalyst
The recent move has coincided with several developments around NEAR's cross-chain infrastructure.
On September 23, NEAR was deployed on Hyperliquid's spot market, adding NEAR/USDC trading alongside the existing perpetual market. Reporting on the launch showed roughly $344 million of NEAR perpetual open interest on Hyperliquid, highlighting the significant derivatives activity surrounding the token.
NEAR also recently expanded its Intents ecosystem through an integration with Ondo Finance, allowing eligible users to access tokenized U.S. stocks, ETFs and commodity-linked assets through NEAR's infrastructure.
These developments provide a stronger fundamental narrative around NEAR's cross-chain and financial infrastructure, but the chart remains the primary guide for the current setup.
Technical Analysis
The daily structure shows NEAR advancing from the $0.8415 swing low, which is marked as the invalidation area for the broader macro triangle and daily impulse.
The initial advance developed into a five-wave structure before a larger (b) correction unfolded through the summer. Price has since reversed sharply from that correction and is now progressing higher in the (c) wave.
NEAR has already moved through the $4.3953 level and is now trading around $4.66, leaving $5.4569 as the next marked upside reference.
The chart also identifies a higher validation area at $8.9862. A move beyond $6.8695 would trigger the alternative count, which places $12.7740 as its first target for Wave (iii).
That distinction matters: the current count and the alternative count are not the same path. The chart therefore has specific levels where the interpretation changes rather than relying on a single unconditional projection.
Key Levels
$5.4569 — Next marked target
$6.8695 — Level beyond which the alternative count is triggered
$8.9862 — Bullish continuation validation area
$12.7740 — Alternative-count Wave (iii) first target
$0.8415 — Macro triangle / daily impulse invalidation area
Bullish Scenario
NEAR continues to hold above the current structure and advances toward $5.4569. Further strength through $6.8695 would trigger the alternative count, while $8.9862 is the chart's broader bullish continuation validation area.
Bearish Scenario
Failure to sustain the current advance would challenge the developing (c) wave structure. The larger daily structure remains invalidated only if the $0.8415 swing low is breached.  Long
Long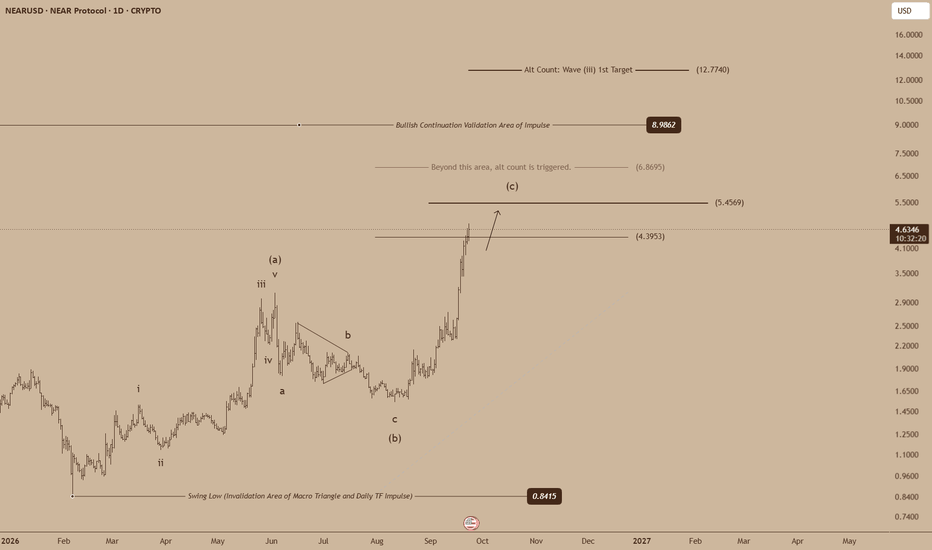
Long 
 Long
Long
Short 
Long 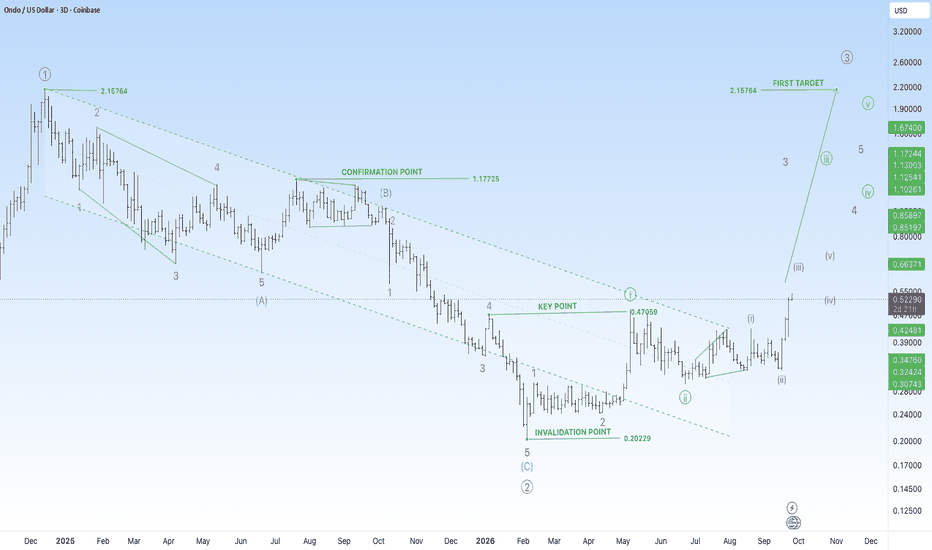
Silver | Has the Structure Chosen Its Path?⏱️ Reading Time: ~2 minutes
In our previous analysis, we had two possibilities on the table: Wave IV had completed and a new bullish move was beginning, or the larger correction was still unfolding.
Now, the price structure has moved one step further and given us clearer levels to monitor for both scenarios.
🟦 Scenario 1 — Bullish Path
If the recent decline was a Wave 2, the current move could be the beginning of a new impulse.
In this case, a break and sustained move above the bullish confirmation levels would strengthen this scenario, opening the path first toward 67.73 and then 71.18.
If the structure continues to develop, the higher targets at 74.45 and 76.49 remain on the table.
But for us, price going up is not enough.
The internal five-wave structure must reveal itself.
⬛ Scenario 2 — Bearish Path
On the other hand, if the larger correction is not yet complete, the current move could still be part of a broader corrective structure.
A break and confirmation below the key levels would strengthen this scenario and could open the path toward 63.53, 62.30, and 60.55, with further extension possible if the structure continues.
So, we are still not here to tell the market what it must do.
We simply follow the structure,
watch the confirmation levels,
and let the market choose the scenario.
Patterns whisper. We listen.
Mr. Nobody | Elliott Wave Principle Research
Silver / U.S. Dollar
2 days ago
Silver | One Structure, Two Possible Paths
10 year US Notes Broke Lower, Keeps Dollar StrongUS yields are pushing higher again as strong US data keeps expectations for more Fed tightening alive, supporting the dollar and weighing on stocks. The US-China meeting is in focus today, with trade, tariffs, rare earths and technology likely key topics. Oil is seeing some rebound after the recent sharp pullback, but there is no major new escalation in the Middle East so far. For now, higher yields and a stronger dollar remain the main drivers across markets.
Looking at the US 10-year Treasury note, we see price broke to the downside, and it looks like we are now in wave five of an extended wave three decline. More importantly, the market broke out of a triangle, and we know that moves out of triangles are often final legs within a higher-degree impulsive sequence. So some stabilization could show up soon, but ideally only for a wave four recovery before another decline in bonds pushes US yields even higher.
This also suggests that the US dollar can remain in an uptrend after some corrective pullbacks. In fact, this makes sense when we look at the Dollar Index on the 4hour time frame, where price is also trading in wave five and potentially moving into the late stages of the recovery from the September lows. Resistance is around 101, while much more important support on a pullback would be around 100.00–100.50.
But right side remains bullish for the dollar, but we should now be aware of some near-term slowdown.
Grega Bitcoin 2H | An Impulse at the Crossroads⏱️ Reading Time: ~3 minutes
Hey everyone,
In this 2H Bitcoin update, I’m focusing on one main question:
Is the recent bullish structure still developing as an impulsive pattern, or has that impulse already been completed and the market entered a higher-degree correction?
🟦 Scenario 1 | Bullish Case
In the bullish scenario, as long as price does not enter the territory of Wave 1, the current structure can still be considered a potential Impulse.
One interesting feature of this count is the relationship between the internal waves within the larger Wave (V). The approximate equality between the initial wave and Wave 3 is particularly interesting from a structural perspective.
If these five waves complete, the next important question is not simply whether price moves up or down, but what type of corrective structure develops afterward and at what degree.
If this entire move is actually part of a larger Wave (III), then after the correction is complete, Bitcoin could potentially continue higher and even return toward its previous all-time high, allowing the larger structure to develop into a more complete impulsive move.
⬛ Scenario 2 | Bearish Case
In the bearish scenario, the assumption is that the recent impulse has already been completed, and the current decline could be the beginning of a correction to that impulsive structure.
At this stage, the exact form of the correction is still unknown. It could develop as a Zigzag, Double Zigzag, Flat, or a more complex corrective structure.
After three corrective waves are completed at a higher degree, another downward move could potentially follow.
There is also a possibility that the current sharp decline is only the beginning of a sharp corrective pattern, followed by stronger downside pressure.
However, even in that case, I would not judge the larger trend simply by the strength of the decline. The bearish structure would need to develop wave by wave and degree by degree before we could connect it to a larger-degree structure.
🔎 The Key Question
For now, both paths remain structurally open:
Completion of an Impulse and continuation higher,
or
Completion of the Impulse followed by a higher-degree Correction.
For me, the most important thing at this stage is not simply whether the market moves up or down, but what structure the next move creates and at what degree it develops.
The market will reveal the answer through structure.
We follow the structure, not the prediction.
– Patterns whisper. I listen. – Mr. Nobody 🎧📊
Bitcoin
Jul 4
Bitcoin 4H | Is the First Bearish Leg Complete.
Long 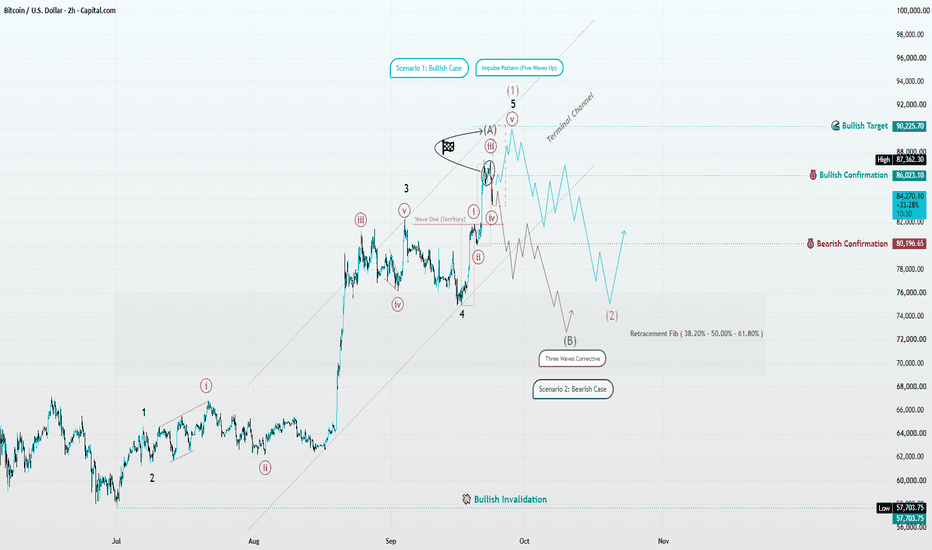
🇺🇸 DXY | Short-Term Strength or the Start of a Larger Move? ⏱️ Reading time: about 3 minutes
In this update, we are taking another look at the DXY structure, this time with greater focus on the behavior we are seeing from the U.S. dollar in the short term.
At the moment, significant short-term strength is visible, and price is approaching several important levels marked on the chart.
But from an Elliott Wave perspective, simply seeing price move higher is not enough for us.
The key question is:
Is this advance the beginning of a new bullish structure, or is it simply part of a correction before a deeper decline?
🟦 Scenario 1 — Bullish Case
If DXY can break through the confirmation levels and then develop a valid motive structure, the recent strength would become much more significant.
In that case, the bullish scenario could develop beyond a simple corrective move and potentially create the conditions for a larger bullish structure.
But to reach that conclusion, the market needs to build the required structure itself.
Under such conditions, dollar strength may not remain limited to DXY and could potentially be reflected in the behavior of other markets as well.
From my personal perspective, one area worth watching is the behavior of oil and capital flows in the Gulf region, along with the reaction of other dollar-sensitive assets.
This does not mean there is a fixed or certain relationship. Rather, these relationships can serve as clues when examining how different markets are behaving together.
⬛ Scenario 2 — Bearish Case
On the other hand, an important possibility remains that the current rise in DXY is simply part of a corrective structure.
If price fails to develop a strong bullish structure and turns lower again, the deeper bearish scenario could regain importance.
In that case, structures such as a Simple Zigzag or Double Zigzag could still be considered as part of the larger correction.
So even if the dollar rises in the short term, we cannot conclude from price direction alone that the larger trend has changed.
The quality of the structure matters more than the direction of the move itself.
🔄 DXY Footprints Across Other Markets
In my own observations, I have seen the relationship between DXY and gold, oil, and the cryptocurrency market change across different periods.
But this correlation is not always the same.
Sometimes dollar strength can occur alongside strength in another asset, sometimes an inverse relationship develops, and at other times two markets may move in the same direction for a while before their relationship reverses.
That is why I do not treat these relationships as fixed market laws.
For me, the structure of each individual market against the U.S. dollar remains the key factor.
If DXY develops a bearish structure, then—provided the corresponding structures confirm it—the possibility of strength in gold, oil, or cryptocurrencies may become more relevant.
But even then, an asset may initially move alongside the dollar and later reverse its path. Everything depends on the internal structure of that particular market.
🌍 A Personal View of the Future
From my personal perspective, global markets are more than just a collection of charts. Behind these movements are economic decisions, capital flows, energy resources, technology, and the choices made by the global community.
In the future, changes in energy, technology, and especially artificial intelligence may influence the way capital flows and assets are valued.
But this part is my personal view of the future and should not be interpreted as a certain prediction.
When analyzing the market, we still follow the same simple principle:
We see the structure first; then we build the scenario.
For now, DXY's short-term strength is significant, but we need to see whether this strength develops into a valid bullish structure, or whether it ultimately proves to be only part of a correction before a deeper decline.
The market will give us the answer through its structure.
Structure First. Scenario Second.
Patterns whisper. I listen.
— Mr. Nobody
U.S. Dollar Currency Index
Jul 6, 2023
Big Correction DXY
US Dollar Index
7 days ago
DXY 2H | The Next Structure Will Define the Larger Path
 Short
Short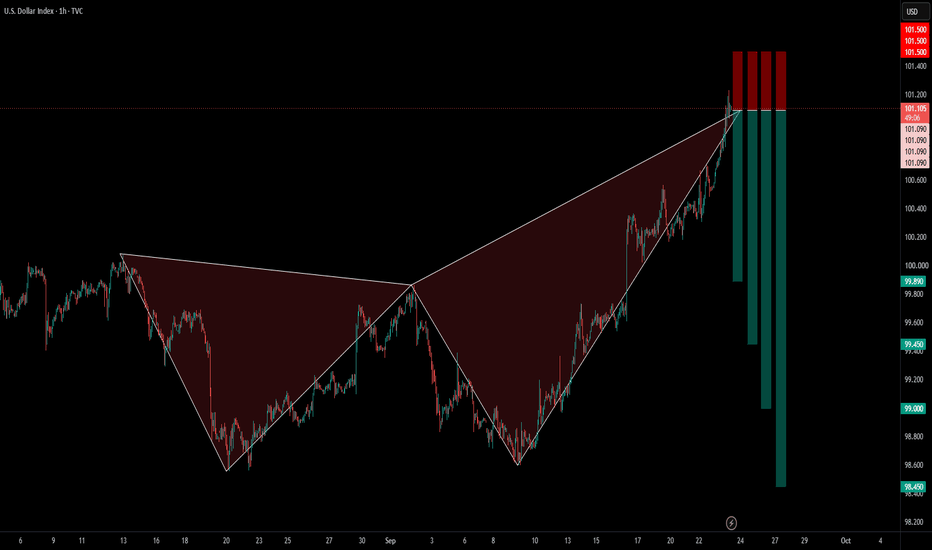
 Short
Short