Bitcoin - Starting a 20% correction! 69k soon.Bitcoin is probably starting a massive 20% correction - my target is 69k. Why? I have many reasons.
The first reason is that from a technical point of view, Bitcoin just finished an impulse wave 12345 from the bottom of the bull market. Elliott Wave theory tells us that after an impulse wave we should expect a corrective wave, such as ABC, WXY or WXYXZ. Let's predict a standard ABC correction, and you can see the prediction on the chart.
The second reason is that we have an unfilled FVG betwe
Elliott Wave
XAUUSD — Bullish Recovery From Wave 5 Low
Gold is showing a bullish recovery after completing the previous bearish wave near the lower support area. From Kelly’s view, the chart suggests that XAUUSD may be shifting into a short-term upside structure, with price now building higher lows above the recent wave (5) bottom.
The key idea is simple: gold may pull back slightly into the buy zone first, but as long as buyers defend that area, the next bullish wave can continue toward the Fibonacci target and the upper resistance zone.
⟡ Marke
XAUUSD — Bullish Wave Setup From Buy Zone
Gold is showing a potential bullish recovery structure after reacting from the lower support area. From Kelly’s view, the chart suggests that XAUUSD may be building a new upside Elliott Wave sequence, with price currently holding above the Buy zone wave 3.
The key idea is simple: if buyers continue defending the lower buy zone, gold may push higher toward the resistance levels above, then extend toward the final wave 5 target.
⟡ Market structure
Gold is currently trading around 4,167, after bo
Bitcoin: Wave 2 Could Target $75,000Bitcoin appears to have completed a five-wave advance in wave 1. The current pullback is likely developing as wave 2, taking the form of a downward double zigzag, with a possible extension into a triple zigzag.
Within this scenario, wave is complete, while wave may still be unfolding. Once this connecting wave ends, I expect another leg lower in wave .
The main area to watch is around $75,000, near the low of the previous wave . This zone is a potential target for the completion of wave
DXY pulls back after PCE — wait for three legs, then more gainsFollowing the PCE data, the Dollar Index can see some retracement now as markets price in higher odds of a hold in October compared with a week ago, alongside end-of-month and Q3 flows.
On the chart, price is coming out of the upward channel after an extended five-wave rally. We wait for a three-leg corrective pullback, then look for more gains in the broader bullish dollar trend, with support around 100.60–99.90 still in focus.
GH
NIFTY Futures — Elliott Wave Count: Wave 5 Downside SetupThe chart presents a larger ABC corrective structure from the previous high, with the current decline developing as the next impulsive leg.
Short term - Bullish...
Elliott Wave Structure
* Wave A: The initial major decline from the ~26,500 area toward 22,050, completing the first leg of the correction.
* Wave B: A complex corrective recovery followed, forming an A-B-C structure and ultimately reaching the ~24,800 region.
* From the Wave-B peak, the market appears to be developing the final
Bitcoin 4H | Bullish Structure & The Golden Possibility⏱️ Reading Time: ~3 minutes
Hey everyone,
In this update, I’m focusing only on the bullish scenario for Bitcoin, looking at it from two different structural perspectives.
At first glance, the larger-degree structure suggests that a motive pattern is developing or approaching completion. If this interpretation is correct, then after the current advance, I would expect the market to develop at least a three-wave corrective structure.
That’s why I’ve mapped the potential correction in blue. I s
WTI Crude Oil | Testing a Nested Wave III Structure⏱️ Reading Time: About 2 Minutes
For this update, I am focusing only on the bullish scenario and allowing price action to show us whether this structure can continue to develop.
One possibility I am currently tracking is a sequence of three nested 1–2 structures across different degrees. If this interpretation is correct, the market may be building the early stages of a larger Wave III, with each lower-degree structure preparing the next impulsive advance.
The recent decline is important, but
Bitcoin Breakout Retest — Is $90K the Next Target?Bitcoin ( BINANCE:BTCUSDT ) appears to have successfully broken above the Heavy Resistance Zone and is now completing a pullback toward this area.
BTC also reacted very well to the Cumulative Long Liquidation Leverage($83,220-$82,300) and started to move higher from this zone.
Can Bitcoin confirm the breakout and extend its bullish move above $87,000?
Technical Analysis
From an Elliott Wave perspective, Bitcoin appears to have completed Primary Wave 4, suggesting that the next Impulsive Wave
Bitcoin 4H | Two Paths, One Structure⏱️ Reading Time: ~3 minutes
Hey everyone,
In this 4H Bitcoin update, I’m looking at two main scenarios. Both are based on the rules and guidelines of the Elliott Wave Principle, but each one suggests a different structural path for the market.
🔴 Scenario 1 | Bearish Case
In the bearish scenario, the assumption is that the recent bullish structure has been completed and the market is now developing a higher-degree corrective pattern.
The current structure could develop into an Expanded Flat,
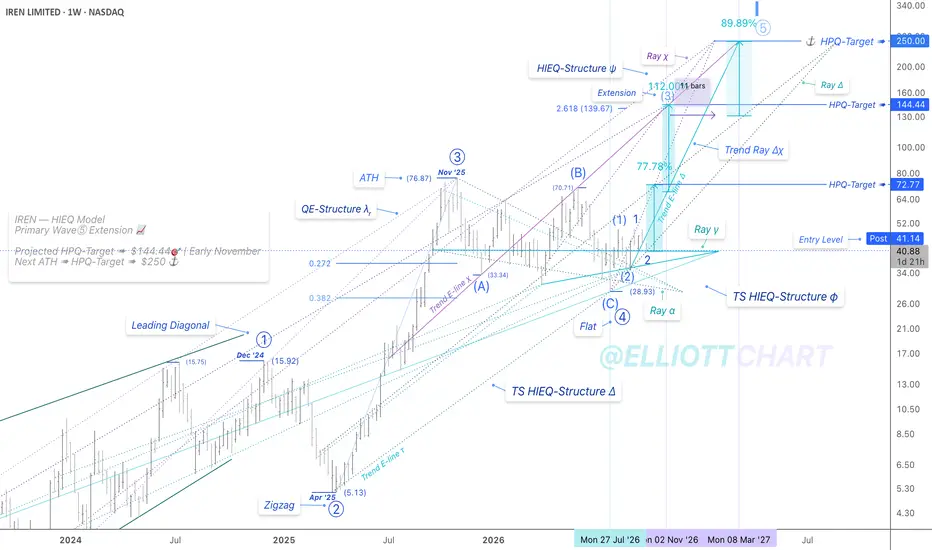
IREN | WeeklyNASDAQ:IREN — Enhancing the HIEQ Model
Trend Analysis 📈
During this structural data transmission from the Corrective Phase Rays toward the Trend Ray Advance, we are surrounded by misleading news and conflicting narratives, as you all know—I call them foggy days.🌫️
No specific change to my analysis; I’ve just designed a T ransition- S upport HIEQ-Structure φ , with Rays ➤ α and γ , in which Ray γ functions as a structural launchpad, as highlighted on the chart.
With the preset now fully
XRPUSDT
XRP is showing strong upward momentum, and my outlook remains bullish.
Based on the current price action, I believe XRP could potentially reach the $3 level sooner than expected if the current momentum continues. Buying activity also appears to be strong, with significant demand supporting the upward movement.
For now, I expect the bullish trend to continue, with the possibility of short periods of sideways consolidation during pullbacks or corrections.
This is a general market analysis an
Silver | Behind the Structure of Wave IV⏱️ Reading Time: ~3 minutes
On the 4-hour timeframe, Silver remains at a point where the structure has not yet revealed its final path. The recent decline may still be part of a more complex correction, and in the bearish scenario, it could continue developing as a Double Zigzag.
🔵 Bullish Scenario
If Silver avoids a deeper decline from the current area and instead develops a valid motive structure, the picture changes. In that case, we could see at least three bullish waves at a larger degre
AVAX EW counts shows initial signs of breakout On the weekly chart, AVAX is now testing and beginning to break its long-standing local downtrend resistance. Since this is the first major test of that trendline, I would not be surprised to see an initial rejection before a more convincing breakout develops. From an Elliott Wave perspective, the move from the recent lows can currently be interpreted as three waves higher. For a cleaner confirmation that a new impulsive structure is developing, I would ideally like to see a complete five-wave a
Solana Shows Potential For Further UpsideSolana continues to show a constructive Elliott Wave structure on the daily chart, with the larger trend developing within a potential five-wave impulse. While a correction could still occur along the way, the current structure suggests that the broader bullish setup may have further room to develop.
On Solana’s daily chart, the advance from the major low can be interpreted as a developing five-wave impulse. This is important because even if SOL enters a larger correction, it would not necessar
EURUSD: Correction Before the Next Major Rally?EURUSD remains in a bullish Elliott Wave structure on the daily chart.
The major low around 0.95–0.96 appears to have completed wave (B). Since then, the pair has been developing a large corrective advance in wave (C).
My primary scenario suggests that wave (C) is forming as a complex W–X–Y–X–Z tripple zigzag.
Primary scenario
The first part of the structure W–X–Y — appears to be complete. EURUSD is now likely developing the second X wave, which should produce a larger correction before t
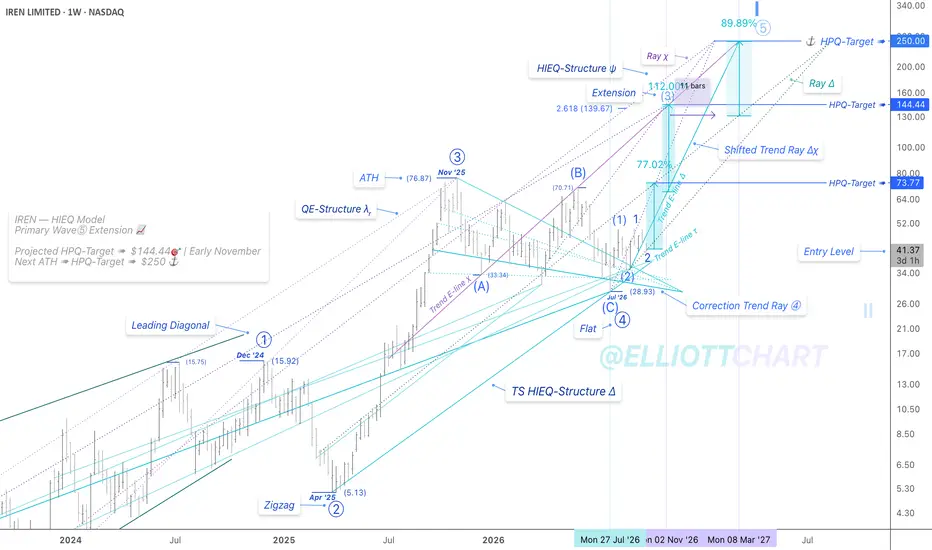
IREN | WeeklyNASDAQ:IREN — HIEQ Model
Trend Analysis | How Do Defined HP Trend Rays Transmit Data Structure?!
As you may see on the chart, I’ve just highlighted the Primary-degree Correction ⓸ Trend Ray—visualizing the transition from the corrective phase to the extension phase advance.
Based on Quantum Entanglement, as the structure reaches the Trend Ray’s convergence zone, where substantial structural information converges, it generates a high-frequency vibration that must eventually release into an exten
Bitcoin: Wave 1 Near Completion — Correction Ahead?Bitcoin remains in a bullish Elliott Wave structure on the 4-hour chart.
The advance from the July low around $58,000 can be counted as a developing five-wave impulse. Waves , , and are already complete, while wave of 1 appears to be close to completion around the recent highs.
Primary scenario
My primary scenario suggests that wave 1 is either complete or very close to completion.
If this count is correct, Bitcoin may start a larger wave 2 correction over the coming days or weeks.
Gold | When the Structure Hasn’t Had the Final Word YetOn the 4-hour timeframe, the current structure can still support more than one path. If the recent decline has actually completed a corrective structure such as a triangle, the market now needs to reveal its next direction through Price Action followed by a valid motive structure.
In Scenario 1: Bullish Case, we would expect at least one recognizable bullish structure to develop after the correction is complete, allowing the market to extend higher. But even in this path, simply breaking a pric
ETHUSDT
Similar to Bitcoin, Ethereum is also showing strong upward movement. In my analysis, ETH appears to be moving almost in competition with Bitcoin, with the overall bullish structure still intact.
My current expectation remains bullish. However, I also see the possibility of Ethereum entering a sideways consolidation phase for a period of time, potentially extending toward the U.S. midterm elections, as political and macroeconomic developments can influence the cryptocurrency market.
This is