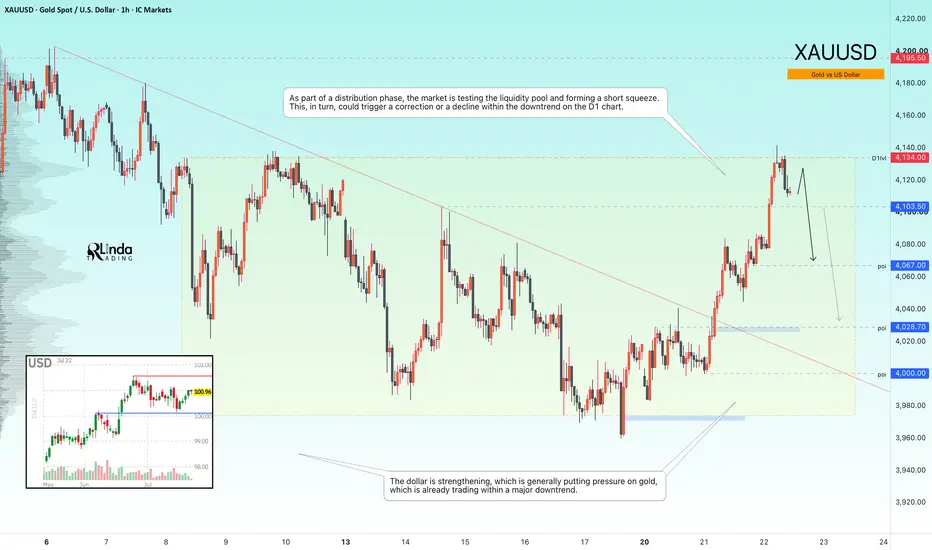
GOLD - A false breakout of resistance within a bearish trendICMARKETS:XAUUSD has broken out of its short-term descending channel within the current distribution phase and is now testing the 4134 liquidity zone while printing fresh intermediate highs. Despite the technical recovery, the broader fundamental backdrop remains weak
Gold remains caught between geopolitical support and pressure from hawkish Federal Reserve expectations and elevated real yields. Analysts note that a sustainable recovery would likely require lower oil prices, declining bond yields, and softer expectations for further monetary tightening. Until then, the upside potential is expected to remain limited.
At the moment, oil prices continue to rise, while the U.S. dollar has strengthened for a fifth consecutive session, maintaining its broader bullish trend.
Bullish drivers: Geopolitical de-escalation, Falling oil prices, A weaker U.S. dollar, Softer expectations for Fed rate hikes
Bearish drivers: Escalation of geopolitical tensions, Rising oil prices, Hawkish Fed rhetoric, Continued U.S. dollar strength
Resistance levels: 4124, 4134, 4195
Support levels: 4103, 4067, 4028
Technically, the market is testing a key liquidity pool within the current distribution phase and may be forming a short squeeze. If bears manage to keep price below the 4124–4134 resistance zone, it could trigger another leg lower in line with the broader daily bearish trend
Best regards,
R. Linda  Short
Short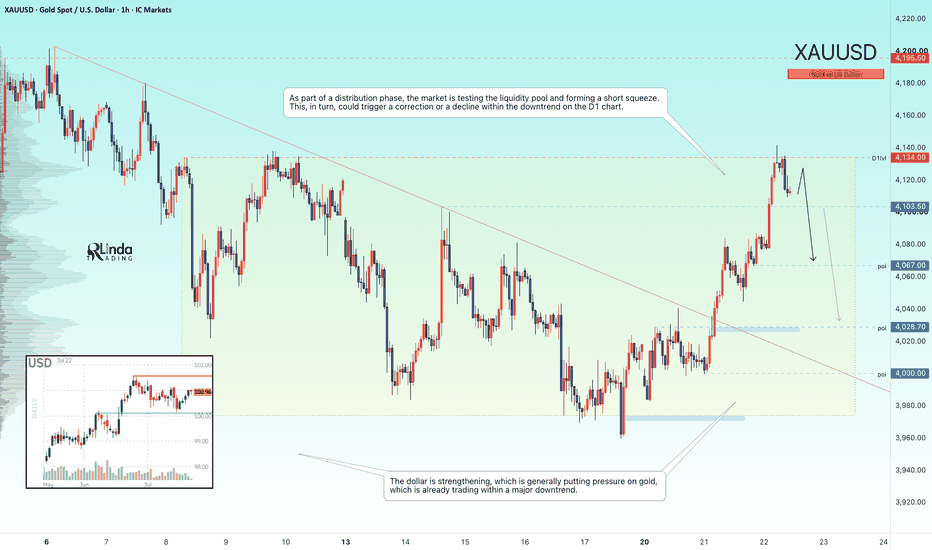
GOLD - The Hunt for Liquidity (Correction) Before the Drop ICMARKETS:XAUUSD is recovering after Thursday's sharp decline, trading around $4,060 on Friday. This rebound may represent nothing more than a liquidity-building move before the broader downtrend resumes
The U.S. dollar continues to strengthen, while gold remains under selling pressure, reinforcing the prevailing bearish market structure. The broader trend remains firmly bearish.
From a technical perspective, gold continues to face pressure from geopolitical uncertainty and hawkish Federal Reserve expectations. The current recovery appears to be a countertrend correction toward key liquidity zones, potentially building momentum for another decline toward the 4000–3983 support area. The next directional move will largely depend on the U.S. dollar, oil prices, PMI data, and developments surrounding the geopolitical conflict.
Bearish drivers: Stronger hawkish Fed expectations, Rising oil prices, Continued U.S. dollar strength, Profit-taking, Bearish technical structure
Bullish drivers: U.S. dollar weakness triggered by new tariff developments, Geopolitical de-escalation, Weaker-than-expected PMI data
Resistance levels: 4061, 4067, 4109
Support levels: 4021, 4000, 3983
Within the current countertrend correction, gold is testing the first trigger zone at 4061–4067. A short squeeze around this area could trigger another reversal and send price back toward support. However, a deeper correction toward the 4109–4134 liquidity zone before the next bearish leg cannot be ruled out
Best regards,
R. Linda Short 
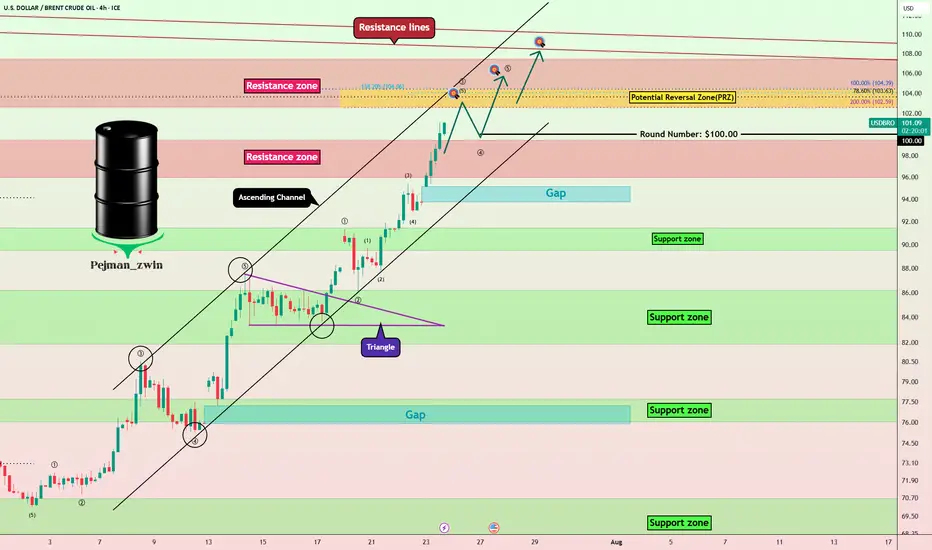
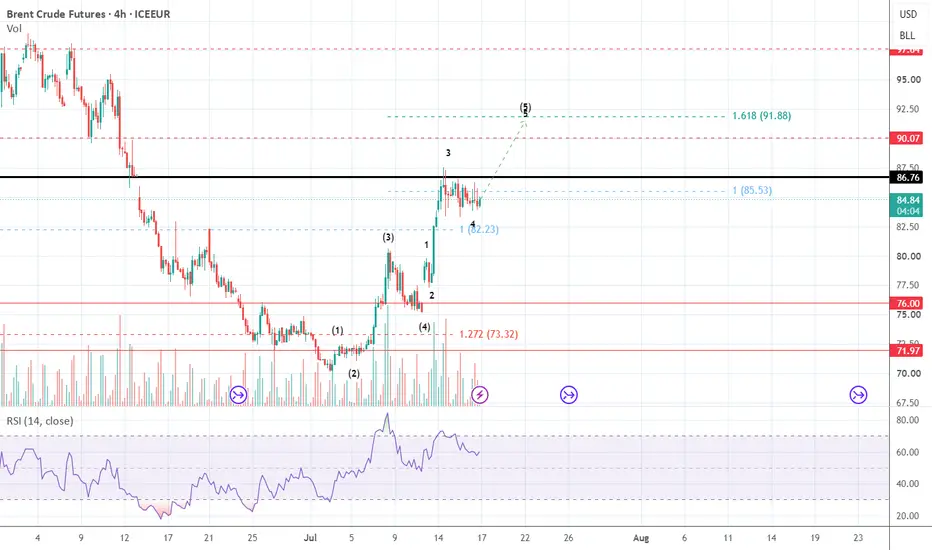
Crude Oil Above $100 — Is the Next Stop $105-$107?Following the increasing possibility of further tensions in the Middle East, crude oil ( FX_IDC:USDBRO ) has gained more than +8% over the past 24 hours. If oil manages to remain above the psychological level of $100, it could continue its bullish trend.
Over the past 15 days, crude oil has been moving inside an ascending channel. It is currently trading above $100 and has successfully broken above the resistance zone($99.50-$96.00).
From an Elliott Wave perspective, it appears that crude oil is currently completing main wave 3, which could potentially end around the Potential Reversal Zone (PRZ) .
I expect crude oil to continue its bullish move toward at least the $105 level. If oil manages to break the key trading level of $107, we could expect further upside toward the resistance lines.
First Target: $105.00
Second Target: $107.00
Third Target: Resistance lines
Stop Loss(SL): $95.60(Worst)
Points may shift as the market evolves
Gap: $95.16-$93.76
Gap: $79.50-$77.22
What’s your view on crude oil? Do you think oil can hold above the $100 level and continue its bullish momentum?
Note: Any news, statements, or developments related to the ongoing Middle East tensions could quickly affect Oil’s price.
💡 Please respect each other's opinions and express agreement or disagreement politely.
📌U.S. Dollar/Brent Crude OIL Analysis (USDBRO), 4-hour time frame.
🛑 Always set a Stop Loss(SL) for every position you open.
✅ This is just my idea; I’d love to see your thoughts too!
🔥 If you find it helpful, please BOOST this post and share it with your friends.  Long
Long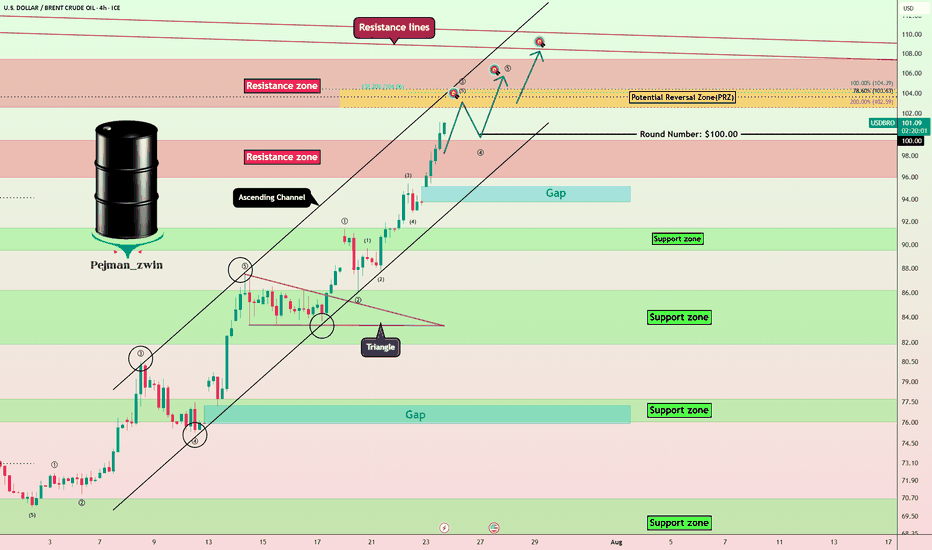
Gold Eyes $4,150 — Are Bulls Ready for the Next Rally?Gold ( OANDA:XAUUSD ) has once again moved below the resistance zone($4,138-$4,091) and is currently trading near the Support Lines and the Fibonacci Levels.
From an Elliott Wave perspective, it appears that Gold is still completing main wave 4, while main wave 3 was an Extended Wave.
I expect Gold to rebound from the current support lines and resume its bullish trend, with an initial target of at least $4,115. If Gold manages to break above the key trading level of $4,117, we could expect a confirmed breakout of the resistance zone($4,138-$4,091) and a continuation of the bullish trend.
First Target: $4,115
Second Target: $4,142
Third Target: $4,160
Stop Loss(SL): $4,057(Worst)
Note: Since tensions in the Middle East continue to escalate, any related news could have an immediate impact on the Gold. Therefore, be sure to monitor geopolitical developments closely and manage your risk carefully.
What’s your view on Gold? Do you think gold can move above $4,150, or will it remain below the resistance zone($4,138-$4,091)?
💡 Please respect each other's opinions and express agreement or disagreement politely.
📌 Gold Analysis (XAUUSD), 4-hour time frame.
🛑 Always set a Stop Loss(SL) for every position you open.
✅ This is just my idea; I’d love to see your thoughts too!
🔥 If you find it helpful, please BOOST this post and share it with your friends.
Long 
XAUUSD (H1) | Gold Coils Below $4,080 Resistance Weekly Close Shakeout or Pre-FOMC Bear Trap?
The Gold market (XAUUSD) enters a highly anticipated Friday session under tight technical compression as market participants prepare for the upcoming weekly close. With the crucial US Federal Reserve policy decision looming next week, institutional desks (Smart Money) are actively de-risking and rebalancing positions.
Fundamentally, the intraday order flow is guided by automated trading algorithms capitalizing on pre-FOMC positioning. As broader macroeconomic uncertainty keeps volatility compressed, gold remains structurally capped beneath major overhead supply layers. Unless safe-haven buyers force a decisive breakout above key technical pivots, the path of least resistance favors a targeted liquidity sweep to rebalance lower structural inefficiencies before the weekend.
Analyzing the H1 market geometry, the key coordinates to track for today's session include:
Major Overhead Resistance: 4,080.000 – 4,120.000 – Premium supply confluence zone and dynamic channel ceiling. This acts as the primary invalidation threshold for short-term bears.
Immediate Trading Pivot: 4,020.000 – 4,040.000 – Near-term horizontal checkpoint where high-frequency algorithms are executing intraday order-matching.
Major Liquidity Target (Demand Floor): 3,940.000 – 3,960.000 – Major institutional accumulation floor and structural liquidity pool containing resting buy-limit clusters.
Will algorithmic sellers force a clean Friday flush toward the $3,940 demand floor, or will pre-weekend short-covering spark an unexpected squeeze back above $4,080?
The Bearish Case (Sellers): The H1 bearish order flow remains structurally dominant beneath the $4,080 resistance. With traders de-risking ahead of next week's Fed meeting, buyers lack the aggressive volume to break dynamic ceilings. A puncture below $4,020 will trigger stop-loss cascades, driving a swift capitulation sweep straight into the $3,940 demand matrix.
The Bullish Case (Buyers): Shorting at the bottom of a compressed range ahead of the weekly close is a high-risk trap. The $3,940 – $4,000 zone represents a heavily defended institutional discount floor. If buyers absorb intraday supply and print a lower-timeframe Change of Character (CHOCH) above $4,040, a sharp V-shaped short-squeeze will catch breakout sellers off guard.
💬 What is your execution playbook for today's Friday close? Are you shorting the resistance retest or waiting to buy the extreme liquidity sweep? Share your charts below! Short 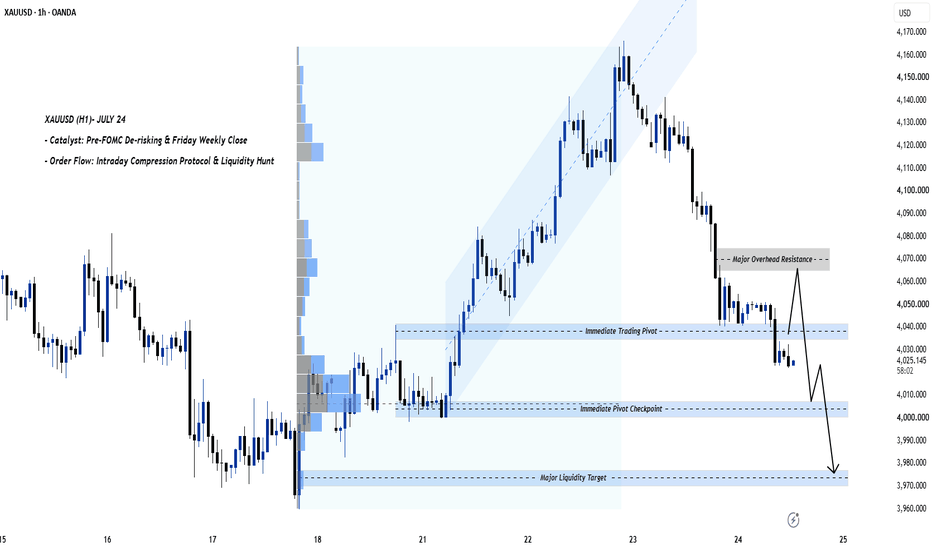
Bitcoin Fake Breakout — Is a Bigger Correction About to Begin?Bitcoin ( BINANCE:BTCUSDT ) has experienced an upward trend over the past few days, and many traders were expecting Bitcoin to at least reach the 200_EMA(Weekly). However, due to the increasing geopolitical tensions in the Middle East and the possibility that these tensions could intensify in the coming days and nights, the market situation has changed.
At the same time, U.S. stock indices such as the S&P 500 ( CAPITALCOM:SPX500 ), as well as precious metals like Gold ( OANDA:XAUUSD ) and Silver ( OANDA:XAGUSD ), have started to decline, while the Dollar Index ( TVC:DXY DXY) has started to rise. Therefore, it seems unlikely that Bitcoin can continue its rally against this increasing macroeconomic pressure.
Before starting the technical analysis, it is important to mention that any news, statements, or developments related to the Middle East tensions over the next 24 hours could have a significant impact on risk assets such as Bitcoin.
Bitcoin has once again moved below the resistance zone($65,630-$64,650) and the 50_EMA(Daily), which could be considered a potential fake breakout.
From an Elliott Wave perspective, it appears that Bitcoin’s recent upward move could be part of a corrective structure, potentially forming a Double Three Correction(WXY).
Also, we can see a bearish Butterfly Harmonic Pattern in the 4-hour time frame.
Based on the points mentioned above, I expect Bitcoin to continue its bearish trend. After breaking the Ascending Channel support line, Bitcoin could decline at least toward the $63,300 level. If bearish momentum increases, we could expect a deeper correction.
First Target: $63,300
Second Target: $62,180
Stop Loss(SL): $66,400
Key levels: $64,120 _ $62,800 _ $66,000
Cumulative Short Liquidation Leverage: $67,700-$67,100
Cumulative Long Liquidation Leverage: $64,440-$63,460
Cumulative Long Liquidation Leverage: $61,830-$60,550
What’s your view on Bitcoin? Do you think Bitcoin can resume its bullish trend, or should we expect a correction similar to other markets?
Note: Any news, statements, or developments related to the ongoing Middle East tensions could quickly affect Bitcoin’s price action and other risk assets.
💡 Please respect each other's opinions and express agreement or disagreement politely.
📌Bitcoin Analysis (BTCUSDT), 4-hour time frame.
🛑 Always set a Stop Loss(SL) for every position you open.
✅ This is just my idea; I’d love to see your thoughts too!
🔥If you find it helpful, please BOOST this post and share it with your friends.  Short
Short
 Long
Long
Long 
 Long
Long
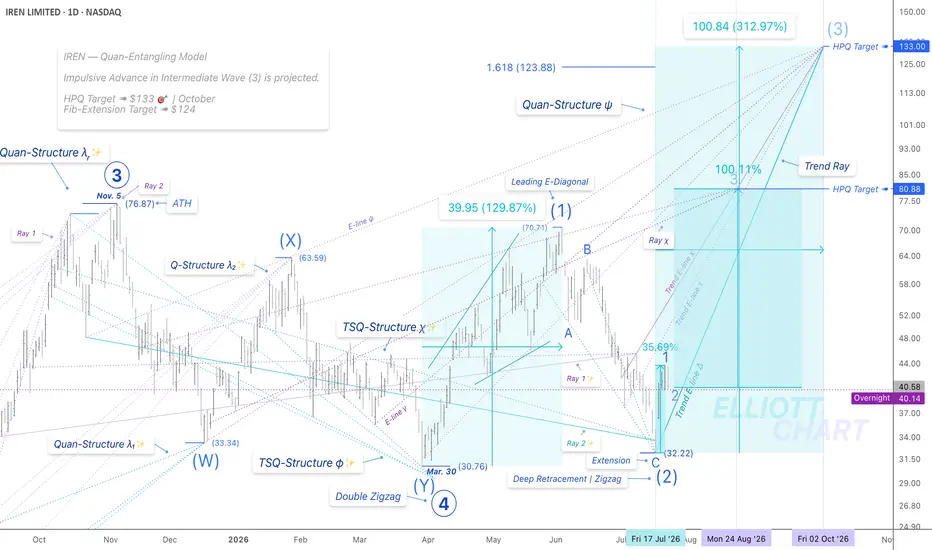
SPACE EXPLORATION TECHNOLOGIES [$SPCX] ELLIOTT WAVE ANALYSISSpace Exploration Technologies appears to be approaching the final stages of a corrective ABC decline. Following the impulsive Wave A from the all-time high, price completed a three-wave Wave B rally before rolling over into Wave C. The current decline is unfolding as an ending diagonal—a terminal Elliott Wave pattern that typically reflects trend exhaustion rather than the start of a fresh impulsive decline.
Unlike established securities, however, SPCX has virtually no historical price data. The absence of higher-timeframe structure significantly reduces analytical confidence, as Elliott Wave analysis relies heavily on historical context to validate wave degrees and identify long-term market cycles. With only a limited trading history available, all wave counts should therefore be treated with greater caution than would normally be the case.
Even so, price is now testing an important confluence of support around the IPO level near $135, while the lower boundary of the ending diagonal converges with long-term trendline support. One final marginal low remains possible to complete Wave C, but the risk of downside continuation appears increasingly balanced by the potential for a meaningful reversal.
Ending diagonals often conclude with a brief capitulation before reversing sharply, with the entire pattern frequently retraced in relatively short order. A decisive breakout above the diagonal’s upper boundary would provide the first technical confirmation that the correction has ended and that a larger recovery phase is underway. Until then, the preferred outlook remains that the market is completing, rather than initiating, a bearish sequence.
Not financial advice. Like and follow for more Elliott Wave and macro crypto analysis.
 Long
Long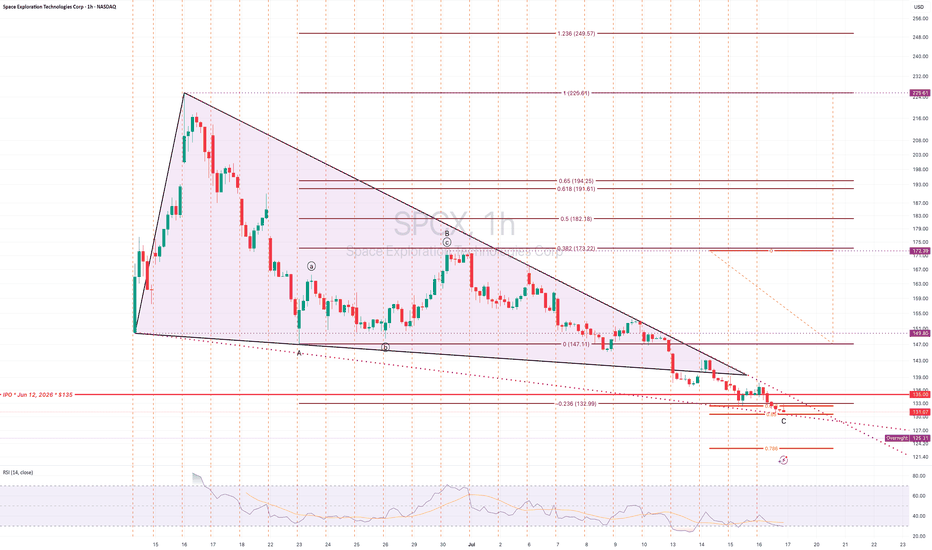
S&P 500 at Potential Reversal Zone—Is a Bigger Correction Next?The S&P 500 ( FOREXCOM:SPX500 ) reacted strongly to the recent support zone($7,463-$7,430) and Support Lines, which led to another bullish move. However, the index is currently trading near the key trading level of $7,500 and the Potential Reversal Zone (PRZ) .
From an Elliott Wave perspective, Wave C appears to have been completed through an Ending Diagonal pattern. The lower trendline of this pattern has already been broken, and the S&P 500 is currently pulling back to retest it.
I expect the S&P 500 to break below the support zone($7,463-$7,430) and support lines in the coming sessions and decline at least toward the $7,413 level.
Target: $7,413
Stop Loss(SL): $7,548
Note: Since tensions in the Middle East continue to escalate, any related news could have an immediate impact on the S&P 500. Therefore, be sure to monitor geopolitical developments closely and manage your risk carefully.
Note: If the S&P 500 begins to decline with strong bearish momentum, it could have a rapid and direct impact on the cryptocurrency market, especially Bitcoin ( BINANCE:BTCUSDT ).
What’s your view on the S&P 500? Do you think it can print new all-time highs again, or should we expect a deeper correction?
💡 Please respect each other's opinions and express agreement or disagreement politely.
📌 S&P 500 Index Analyze (SPX500USD), 4-hour time frame.
🛑 Always set a Stop Loss(SL) for every position you open.
✅ This is just my idea; I’d love to see your thoughts too!
🔥 If you find it helpful, please BOOST this post and share it with your friends.  Short
Short
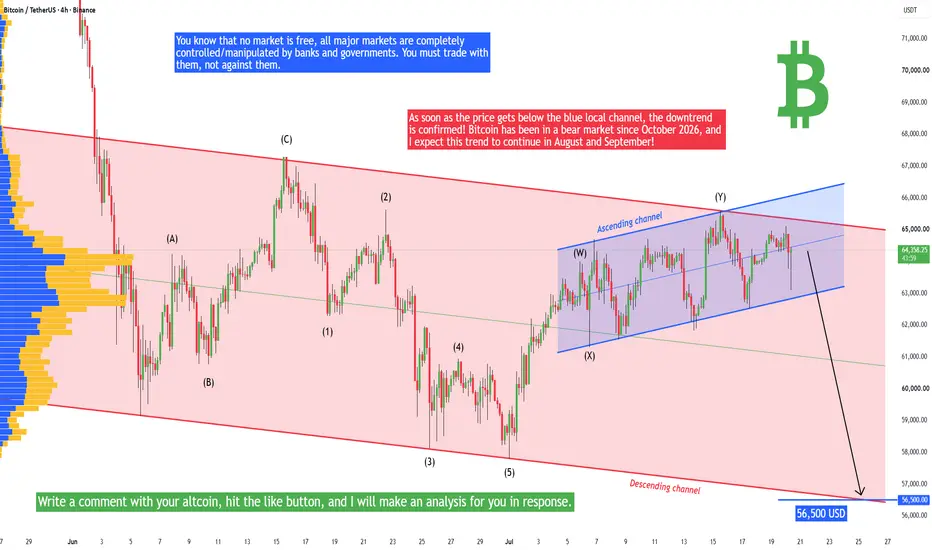
Bitcoin - Starting another big drop! 56k soon (42k then?)Bitcoin will soon enter a capitulation phase. Right now it's a good time to sell or short Bitcoin on futures. Why? The current price is at the top of the channel, which acts as a strong resistance. As soon as the price gets below the blue local channel, the downtrend is confirmed! Bitcoin has been in a bear market since October 2026, and I expect this trend to continue in August and September! In the short term my target is 56,500, as you can see on the chart. But my midterm target is around 42,000, and I expect this target to be hit in September/October. We should see some very bad news during this event, such as a hack of a major exchange or capitulation of major players/miners in the crypto space.
From a technical point of view of this chart, I think we can expect a bounce from the bottom of the descending channel. It does make sense also from a point of view of taking liquidity below the previous swing low.
NUMBER 1 RULE: You know that no market is free, all major markets are completely controlled/manipulated by banks and governments. You must trade with them, not against them. Make sure your strategy is optimized to this behavior. You want to buy where all people have their stop losses and sell where all people have their buy orders.
Write a comment with your altcoin + hit the like button, and I will make an analysis for you in response. Trading is not hard if you have a good coach! I am very transparent with my trades. Thank you, and I wish you successful trades! Short 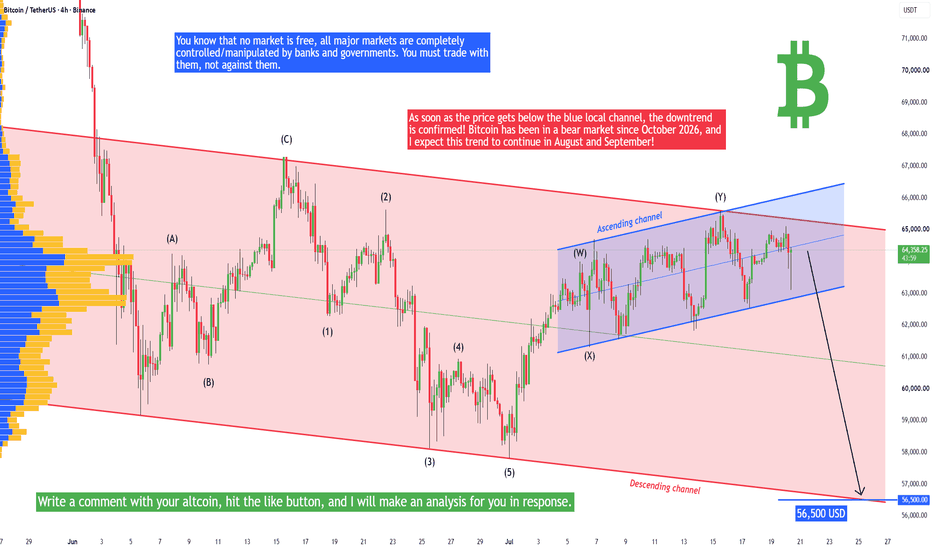
Long 
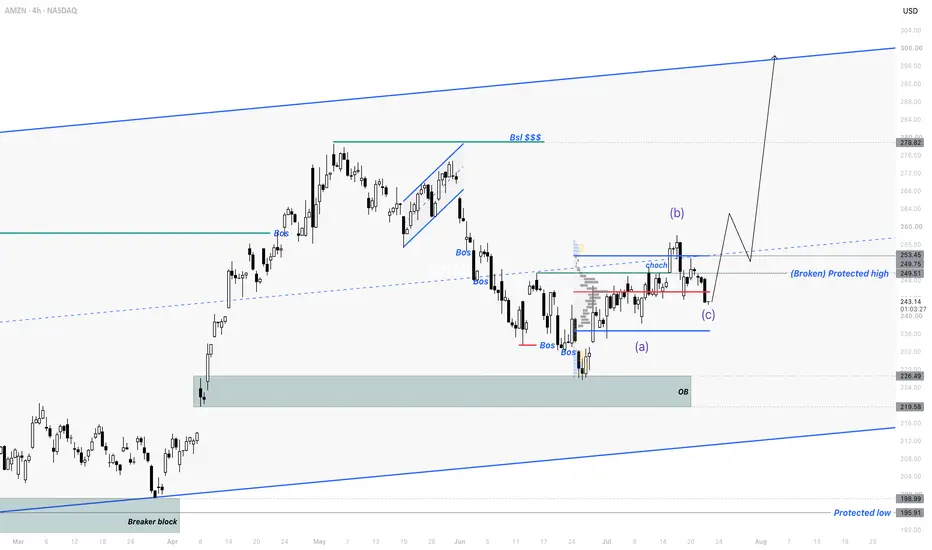
AMZN | ABC Correction Done — Break The HVA And Run!
By analyzing the #AMZN (Amazon) chart on the 4H timeframe, we can see that the broader trend remains bullish, and the internal corrective phase looks to be wrapping up. Price is now compressing at a decisive volume level — and a clean break of it is the trigger for the next leg toward the liquidity above.
📊 4H Timeframe
On the 4H, the bigger picture is an uptrend riding inside its rising channel, with price holding comfortably above the Protected Low at $195.91 . Within that uptrend, price went through an internal correction: it printed a bearish internal CHoCH, followed by several bearish BOS on the way down, taking price into the demand area near the Order Block ( $219.58 – $226.49 ).
That corrective phase is now over. Price broke the Protected High of the internal downtrend at $249.51 with an impulsive wave — the structural signal that buyers reclaimed control. Since that break, price has been unwinding in a three-wave (a)-(b)-(c) correction, and it's currently trading around $242.89 , sitting right at the High Value Area (HVA) of the volume profile — the heaviest-traded level on the chart and the battleground that decides the next move.
🎯 The Bias
My base case is bullish continuation, but it needs confirmation. The trigger I want is a clear candle close above the High Value Area — that would confirm buyers have absorbed the heaviest volume on the chart and complete the corrective structure. On that break, the path opens toward the levels overhead at $249.75 and $253.45 , and then the buy-side liquidity (BSL) resting at $278.82 , with the trend continuing inside its channel. In my view, as long as AMZN holds above the Protected Low ($195.91), the uptrend stays intact and every dip remains constructive — but until that HVA gives way on a decisive close, price can keep consolidating here.
📰 Fundamental Backdrop
The technical setup lines up with a strong catalyst calendar. Amazon reports Q2 2026 results on July 30 after the US close — the key near-term event, with Wall Street modeling EPS of $1.82 (up from $1.68 a year ago) on revenue near $196 billion, and the company itself having guided to $194–199 billion. The quarter is expected to benefit from Prime Day shifting into Q2, continued AWS acceleration, and a record advertising business. Sentiment into the print is bullish: analysts carry a Strong Buy consensus, KeyBanc just raised its target to $335, and Bank of America projects around $198.8 billion in revenue with roughly 33% AWS cloud growth on enterprise AI adoption — noting that Amazon's expanding relationship with Anthropic alone could add more than $1.5 billion in sequential AWS revenue. The risk to respect is the spending: 2026 capex is tracking toward roughly $200 billion (BofA thinks the outlook could rise to ~$210 billion on higher memory costs), Amazon launched a $25 billion bond sale to fund it, and there's about $1 billion in incremental costs from the Leo satellite build ahead of a Q3 launch — all of which could pressure near-term margins. Net-net: the fundamentals support the bullish structure, but July 30 is a binary event that could easily be the catalyst that resolves this HVA battle in either direction.
This analysis will be updated as the market evolves. If this breakdown added value, drop a like 👍 and a comment 💬 to support the work — and share where you see Amazon heading next! Best Regards, BigBeluga 🐳  Long
Long
XAUUSD: ABC Pullback May Prepare the Next Bullish Wave
Gold is still holding a constructive bullish structure after the strong recovery from the lower base. From Kelly’s view, the market has already created an impulsive move higher, and the current pullback may simply be an ABC correction before price attempts another upside continuation.
The key idea is simple: gold may correct first, but the bullish structure remains active while price holds above the trendline and the main buy zone.
⟡ Market structure
The chart shows gold recovering strongly from the 3,960 area, then building higher lows along the rising trendline. Price pushed into the 4,130–4,140 region before slowing down, which is normal after a strong bullish leg.
Gold is now trading around 4,118, close to the short-term support area. The first reaction zone sits around 4,100–4,105, where a small buy scalping setup may appear.
The more important zone is the 4,068–4,075 area. This is marked as the possible end of the ABC correction. If buyers defend this zone, gold may start a new upward wave towards the upper trendline and the 4,150–4,160 target area.
➤ Key levels
◌ 4,100–4,105: buy scalping zone and short-term reaction area
◌ 4,068–4,075: main buy zone and possible ABC completion
◌ 4,118–4,123: current price reaction area
◌ 4,130–4,140: nearest resistance zone
◌ 4,150–4,160: upside target and trendline target area
◌ Below 4,068: area where the bullish setup starts to weaken
⌁ Elliott Wave view
From an Elliott Wave perspective, gold appears to have completed a short bullish wave sequence from the lower base. After that, the current movement may be forming an ABC correction.
Wave A is the first pullback from the recent high.
Wave B may form a small rebound around the 4,100 zone.
Wave C may complete around 4,068–4,075 if price continues to correct deeper.
If wave C ends inside this buy zone and a bullish confirmation candle appears, gold may begin the next continuation phase. The next target would be 4,130–4,140 first, then 4,150–4,160 if momentum expands.
▸ Trading scenario
Preferred scenario: wait for gold to complete the ABC correction around the buy zone before looking for continuation.
Entry zone: 4,068–4,075 if bullish confirmation appears
Scalping entry zone: 4,100–4,105 only if price reacts strongly
Stop loss: below the confirmed wave C low or below 4,060
Take profit 1: 4,130–4,140
Take profit 2: 4,150–4,160
Take profit 3: higher trendline area if bullish momentum continues
Alternative scenario: if gold breaks below 4,068 with strong bearish pressure, the ABC bullish setup weakens. In that case, price may need to form a deeper base before the next recovery becomes reliable.
⌁ Kelly’s view
For Kelly, this is a bullish continuation structure, but the market needs a healthy correction before the next strong move. Buying directly after a strong push is not the cleanest plan.
The better setup is to wait for gold to pull back into support, then watch whether buyers defend the ABC completion zone.
Gold is correcting inside a bullish structure.
If the buy zone holds, the next upside wave may continue towards 4,150–4,160.
Share your view below.
Long 
GOLD (XAUUSD) 1H Analysis: Wave E Completed, Eyeing 4200 Before Overview:
Looking at the 1-hour (1H) chart for Gold, we can observe some compelling structural developments. The price recently completed a corrective A-B-C-D-E sequence, establishing a solid base at the wave E low. This was followed by a strong impulsive breakout to the upside, signaling that market momentum has officially shifted to the buyers.
Technical Breakdown:
Completed Correction: The A-B-C-D-E pattern indicates that the recent phase of consolidation has ended. The sharp rally originating from point E confirms massive buying interest at lower levels.
Current Price Action: After breaking through initial resistance, the price is currently accumulating around the 4095 level, preparing for its next directional move.
Projection & Key Levels: Based on the projected path drawn on the chart, the primary objective is a push higher to test the psychological resistance level at 4200 first. Once that peak is reached, we anticipate profit-taking and a significant retracement. The target for this deeper pullback is the Demand Zone / Support Block, highlighted by the grey box in the 4025 - 4030 area.
Trade Idea / Strategy:
Short-term Plan: For active day traders with an appetite for risk, there may be short-term opportunities to follow the bullish momentum targeting the 4200 level.
Medium-term Plan (Swing Trade): The 4200 area carries a high risk of rejection, so chasing the price at those highs is not recommended. A much safer strategy is to wait for the anticipated drop into our highlighted Demand Zone (4025-4030). If the price tests this area and prints bullish reversal signals (like a strong rejection wick), it will present a low-risk, high-reward opportunity to enter a Long position.
Key Levels to Watch:
Target Resistance: 4200
Major Support (Demand Zone): 4025 - 4030
Disclaimer: This post is for educational and technical analysis purposes only and does not constitute financial advice. Always do your own research and use strict risk management. Long 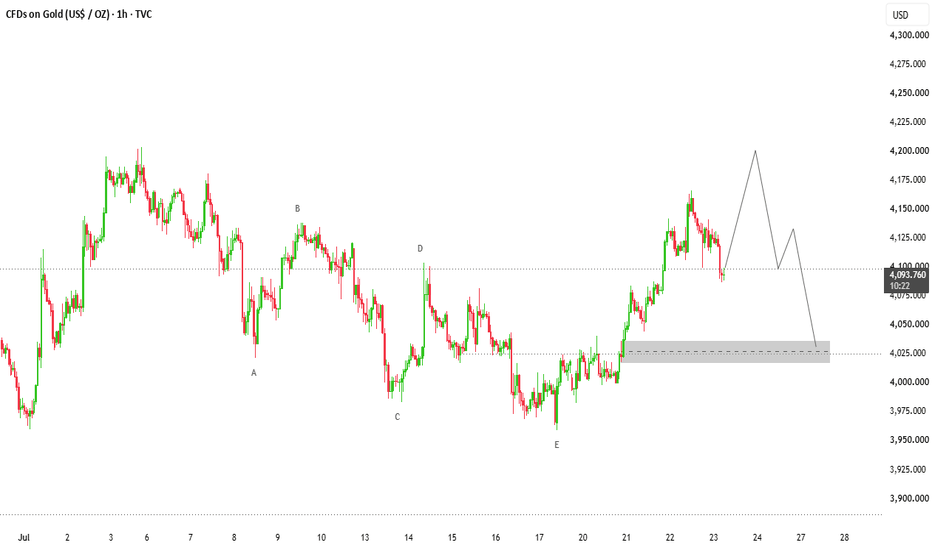
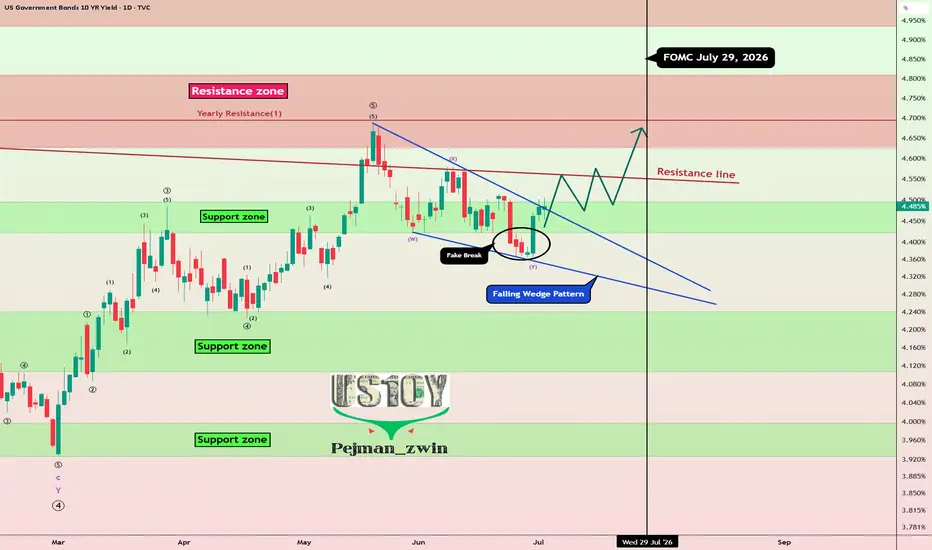
US10Y Fake Break:Is a New Bond Yield Rally About to Shake MarketToday, I want to analyze the U.S. 10-Year Government Bond Yield ( TVC:US10 ), as it is one of the key financial market indices that can show us the broader market direction for various assets like Gold ( OANDA:XAUUSD ), Silver ( OANDA:XAGUSD ), U.S. stock indices (including the S&P 500 ( FOREXCOM:SPX500 )), and especially Bitcoin ( BINANCE:BTCUSDT ) in the crypto market. Stay with me.
On the daily timeframe, the U.S. 10-Year Government Bond Yield is currently moving near a support zone (4.24%-4.10%) and has formed a fake break. Typically, after fake break patterns, the market tends to move in the opposite direction, with upward momentum (educational note).
From a classical technical analysis standpoint, the U.S. 10-Year Government Bond Yield seems to have formed a falling wedge pattern, which could signal a potential upward breakout.
From an Elliott Wave perspective, after breaking the upper line of the falling wedge pattern, we could anticipate the start of the next impulsive wave upward.
I expect the U.S. 10-Year Government Bond Yield to continue its upward trend in the coming days and at least reach the next resistance zone(4.64%-4.50%). This rise could lead to a decline in risk assets such as U.S. equities, gold, silver, and even the crypto market, including Bitcoin.
Target: Resistance zone(4.64%-4.50%)
Stop Loss(SL): 4.35%
Note: The U.S. 10-Year Government Bond Yield could potentially maintain its upward trend ahead of the FOMC meeting on July 29. After the release of new economic data and once we hear Warsh’s latest remarks, we may get a clearer signal about the next major move or a possible trend reversal.
------------
How Rising 10-Year Bond Yields Influence Major Assets
When 10-year government bond yields move higher, they tend to reshape investor behavior across markets:
Bitcoin & Cryptocurrencies
As yields climb, capital often rotates toward safer, income-generating assets like bonds. This shift can reduce demand for high-risk assets such as Bitcoin, potentially leading to price pressure.
Gold
Gold typically struggles in a rising yield environment. Since it doesn’t generate income, higher bond yields increase the opportunity cost of holding gold, which can weigh on its price.
U.S. Equities
Stocks, especially growth and tech sectors, may face headwinds. Higher yields usually mean higher borrowing costs, which can compress margins and slow down expansion for companies reliant on financing.
------------
What’s your view on US10Y? If US10Yr rises, could we see declines in gold, U.S. stock indices, and the cryptocurrency market?
💡 Please respect each other's opinions and express agreement or disagreement politely.
📌 US 10-Year Government Bond Yield Analyze (US10Y%), Daily time frame.
🛑 Always set a Stop Loss(SL) for every position you open.
✅ This is just my idea; I’d love to see your thoughts too!
🔥 If you find it helpful, please BOOST this post and share it with your friends.  Long
Long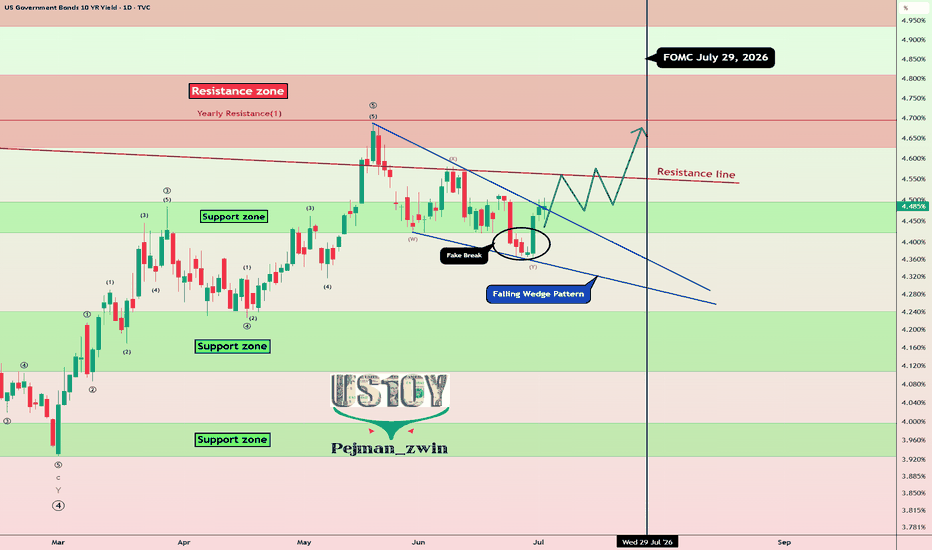
Long 
Long 

 Long
Long