Bitcoin - Starting a 20% correction! 69k soon.Bitcoin is probably starting a massive 20% correction - my target is 69k. Why? I have many reasons.
The first reason is that from a technical point of view, Bitcoin just finished an impulse wave 12345 from the bottom of the bull market. Elliott Wave theory tells us that after an impulse wave we should expect a corrective wave, such as ABC, WXY or WXYXZ. Let's predict a standard ABC correction, and you can see the prediction on the chart.
The second reason is that we have an unfilled FVG between 65k and 75k. This is seriously one of the biggest FVG Bitcoin ever created, and what is the probability that Bitcoin will at least test the top of the FVG? Very big, I think around 95%. Sooner or later Bitcoin will go here.
The third reason is that Bitcoin got rejected from the 20 monthly SMA (simple moving average). That's really one of the strongest resistances currently.
Why is 69k a strong support? Mainly because of the 0.618 Fibonacci level. This Fibonacci level is very popular among banks and big institutions, they just love buying here.
I am very curious, where do you want to buy BTC for the long term? Write me a comment, I read all comments. Also, write a comment with your altcoin + hit the like button, and I will make an analysis for you in response. Thank you, and I wish you successful trades!  Short
Short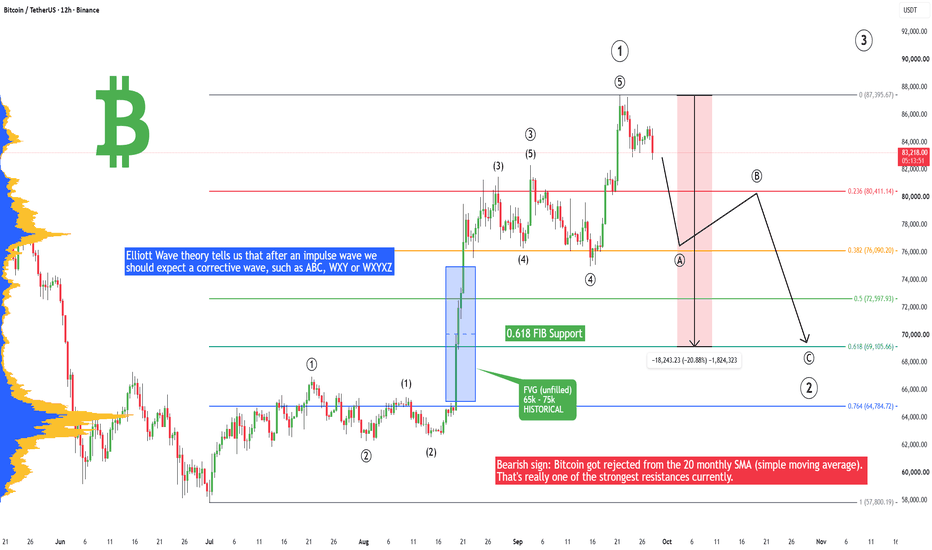
XAUUSD — Strong Bearish Start Inside Channel
Gold is opening the new week with strong bearish pressure after failing to recover above the descending channel structure. From Kelly’s view, the chart suggests that XAUUSD is still trading inside a clear downtrend, and the current movement may continue lower to complete the next bearish Elliott Wave sequence.
The key idea is simple: gold remains below the Sell zone wave 5, and as long as buyers cannot reclaim this area, the bearish channel may continue pushing price toward the lower Fibonacci targets.
⟡ Market structure
Gold is currently trading around 4,160, after a strong rejection from the recovery area. Price is still moving inside the descending channel, with lower highs forming under the trendline.
The short-term resistance now sits around 4,175–4,190, marked as the Sell zone wave 5. This zone is important because it may act as the next rejection area before sellers continue the downside move.
The next support to watch is the Buy zone Fibonacci around 4,080–4,100. If this area fails to hold, gold may continue toward the deeper End wave 5 target near 3,970–4,000.
➤ Key levels
◌ Current price area: 4,160
◌ Sell zone wave 5: 4,175–4,190
◌ Buy zone Fibonacci: 4,080–4,100
◌ Main bearish target: 3,970–4,000
◌ Strong channel resistance: 4,220–4,240
◌ Bearish invalidation: above 4,240
⌁ Elliott Wave view
The chart shows a bearish Elliott Wave continuation inside the descending channel.
Wave (1) started after price failed from the upper channel area.
Wave (2) created a corrective rebound but could not break the downtrend structure.
Wave (3) pushed price lower with strong momentum.
Wave (4) may create a short rebound into 4,175–4,190.
Wave (5) could then continue toward 4,080–4,100, and if selling pressure expands, the larger target remains around 3,970–4,000.
This is why Kelly is not treating the current price as a confirmed bullish reversal. The market is still under the channel pressure, and the cleaner plan is to watch for rejection from resistance.
▸ Trading scenario
Preferred bearish scenario
Entry: Sell around 4,175–4,190 if price gives bearish rejection
Stop Loss: Above 4,240
Take Profit 1: 4,080–4,100
Take Profit 2: 4,000
Take Profit 3: 3,970–3,980
Alternative scenario
If gold breaks above 4,220–4,240 and holds above the descending channel, the bearish structure becomes weaker. In that case, price may attempt a stronger corrective recovery before the next sell setup appears.
◌ Invalidation
The bearish view becomes weaker if gold reclaims 4,240 with strong bullish momentum. A clean hold above this level would suggest that sellers are losing control of the current wave structure.
⌁ Kelly’s view
Kelly’s main view remains bearish for the start of the week while gold stays below 4,175–4,190 and inside the descending channel.
If sellers defend the sell zone, gold may continue toward 4,080–4,100, then the deeper End wave 5 target near 3,970–4,000.
Do you think gold will reject from the sell zone first, or continue falling directly toward the Fibonacci buy zone?  Short
Short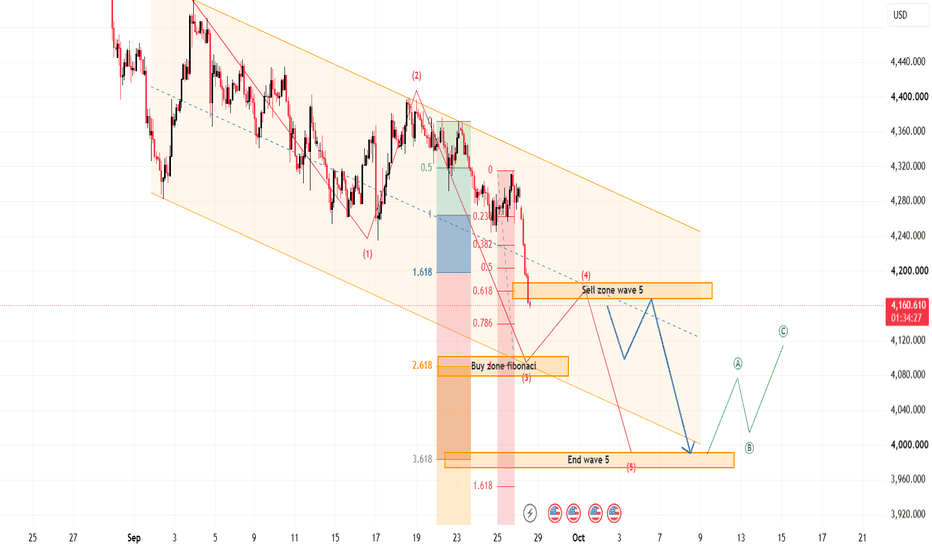
Mr. Nobody | Bitcoin Daily — Structure Before Prediction⏱️ Reading Time: ~4 minutes
I want to begin this analysis with one simple rule:
We are not here to prove the bullish scenario or the bearish scenario. First, we read the structure and let price show us which path is developing.
On the Daily timeframe, Bitcoin’s larger structure still allows for more than one interpretation. The recent decline can be viewed as a five-wave impulse at a higher degree, while the sideways structure that followed may be part of a more complex correction.
But this raises an important question:
After a five-wave structure, must we always expect a simple three-wave correction?
Not necessarily.
According to the Elliott Wave Principle, corrections can become much more complex. Smaller-degree structures may also become compressed, meaning that what initially looks like a large correction could still be part of a higher-degree motive structure.
🟦 Bullish Scenario
In the bullish path, Bitcoin could first develop another corrective or sideways structure before entering a stronger motive move.
If that advance develops with a clear five-wave structure, the possibility that we are seeing a higher-degree third wave becomes increasingly important.
The paths shown on the chart range from a more ordinary advance to a much larger Big Move to the Upside, including what I call the “Golden Possibility.”
The Golden Possibility may look extremely ambitious at first glance. But if the lower-degree structures have genuinely become more compressed, it deserves to remain on the research table as a structural possibility, not as a price prediction.
🟥 Bearish Scenario
On the other side, the current structure may still be developing as an Expanded Flat, as marked on the chart.
If this interpretation remains valid, the market could eventually complete the current structure and develop the next bearish leg.
However, there is an important point to watch.
If the current structure changes and Wave C of this Expanded Flat develops into a powerful motive move, the expected pattern could fail. Instead of continuing lower, Bitcoin could build a larger corrective advance.
In that case, further upside would become possible—but initially, I would still want to see it as a three-wave structure, rather than immediately calling it a new bullish trend.
If that advance fails to develop a valid motive structure, a sharp decline—or even a prolonged and grinding decline—would remain possible.
🔍 What Am I Watching?
For me, the main question is not:
“Will Bitcoin go up or down?”
The real question is:
How many waves will the next structure contain, and at what degree?
My research in Gold, Oil, DXY, Silver, AAPL, TSLA, Gas Oil, EUR/USD and other currency pairs will continue. But from now on, you will probably see me spending much more time in the crypto markets.
This journey did not begin today.
I started with candlesticks and Price Action, then moved into chart patterns and harmonic structures, and eventually arrived at the Elliott Wave Principle—where, for me, it became a powerful framework for understanding the structure and language of the market.
I have no disrespect for any other method. Every trader has their own path.
But through my own experience, I have found Elliott Wave to be a remarkably useful framework for studying market behavior.
When I look at crypto markets, I sometimes feel that the footprints of larger market participants can be observed through price structure.
Bulls, bears, and whales all live within these waves.
Our job is simply to learn how to read their language.
I will never tell you that a scenario is 100% certain. The market gives that guarantee to no one.
When structure, evidence, and experience align, I may assign something like 75% probability to one scenario—but it is still a hypothesis that price must confirm or invalidate.
This project is a living laboratory for me: a place to observe the market, test ideas, make mistakes, refine them, and keep learning.
And now, I want to continue that journey with you.
I give you my experiences, observations, and understanding of the market and the Elliott Wave Principle as a gift—to your eyes, freely, forever.
Not as a guru.
Not with promises of predicting the future.
But as Mr. Nobody — an independent researcher, an Elliott Wave student, and a fellow traveler for those who love the Wave Principle.
In the end, price will determine the correct scenario through the structure it develops.
– Patterns whisper. I listen. – Mr. Nobody 🎧📊
Bitcoin
2 days ago
Bitcoin 15M | Structure Must Confirm the Path
 Short
Short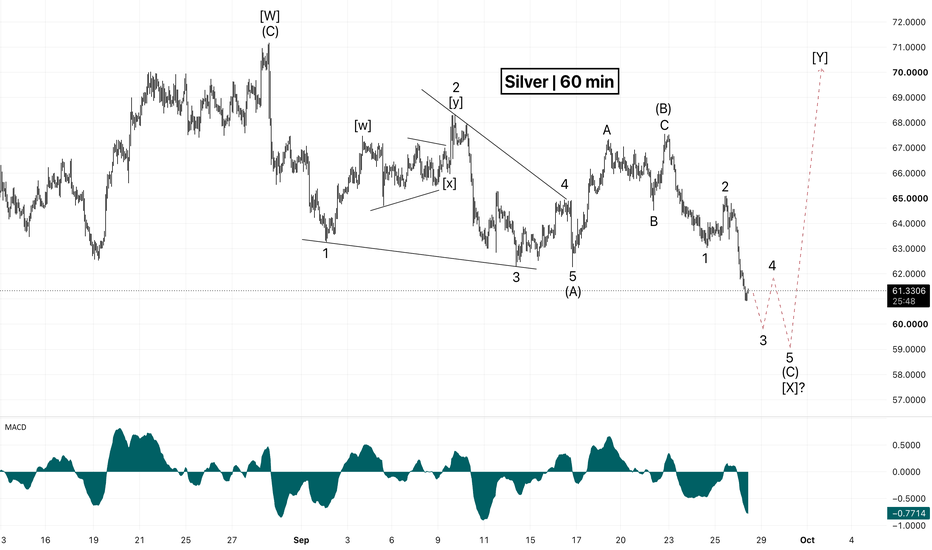
Gold Tests 61.8% Fibonacci — Is the Correction Almost Over?Gold ( OANDA:XAUUSD ) has been in a bearish trend over the past 6–7 days, but the decline has developed with relatively weak momentum.
Interestingly, the bullish move completed in less than two days has still not been fully retraced after nearly a week of declining prices, suggesting that buyers continue to show relative strength.
Can gold defend the Heavy Support Zone and begin another bullish move, or is a deeper correction approaching?
Macro Outlook
The U.S. 10-Year Treasury Yield(US10Y) could also begin a bearish move.
If Treasury yields decline, this could provide additional support for gold and strengthen the short-term bullish scenario.
Technical Analysis
Gold is currently trading near the important 61.8% Fibonacci level on the Daily time frame and inside the Heavy Support Zone($4,274-$4,178).
From an Elliott Wave perspective, on the 4-hour time frame, gold appears to still be completing a Double Three Correction(W-X-Y).
I initially expected this corrective structure to complete earlier, but as long as gold remains above $4,233, the current scenario remains valid.
💡 Educational Note: The 61.8% Fibonacci retracement is one of the most closely watched levels during corrections and can become an important reaction area when it overlaps with a major Support Zone.
I expect gold to start a bullish move after breaking above the key trading level of $4,284, with an initial target around $4,337.
If gold successfully breaks above the key $4,355 level, the bullish move could extend toward $4,381 and potentially higher levels.
Trade Setup
First Take Profit(TP): $4,337
Second Take Profit(TP): $4,381
Stop Loss(SL): $4,229
Key Trading Levels: $4,284 _ $4,355 _ $4,400
Which level do you think gold will reach first?
🟢 $4,381
🔴 $4,229
📌 Gold Analysis(XAUUSD), 4-hour time frame.
🛑 Always use proper risk management and set a Stop Loss(SL) for every position.
🚀 If this analysis helps your trading plan, a BOOST would help more traders discover it. Long 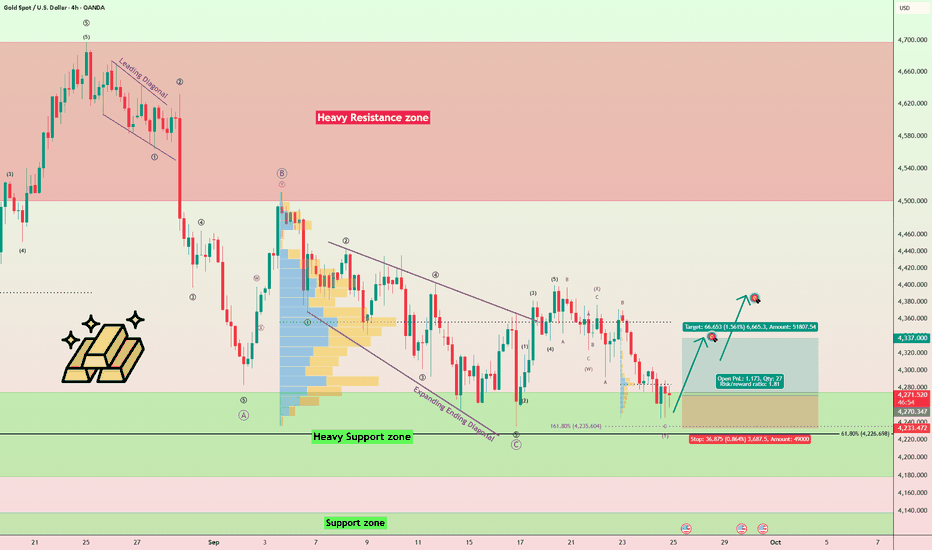
Long 
 Short
Short
Bitcoin 1H | Understanding Structure, Not Predicting Price⏱️ Reading Time: ~2 minutes
The Daily chart gives us the bigger picture.
The 1H chart helps us understand what Bitcoin may do next as that structure develops.
Right now, Bitcoin is still forming a corrective structure, so both paths remain on the table.
🟦 Bullish Scenario
If the current structure breaks higher and develops into a clear five-wave move, the bullish scenario gains strength.
The first key confirmation level is around 84,601.
Above that, the next important levels are:
85,662 → 89,269 → 92,237
But simply reaching these levels is not enough for us.
What matters is the internal structure of the move and whether a valid five-wave pattern develops.
🟥 Bearish Scenario
If the current structure fails to break higher and price establishes itself below 83,091, the bearish path becomes active.
The main levels to watch are:
82,326 → 80,510 → 77,542
If the decline develops as a five-wave structure, it could support the idea that the larger corrective structure discussed on the Daily chart is still unfolding.
🔍 What Are We Watching?
This is not about predicting the future.
We are trying to understand the structure and study Bitcoin’s possible next behavior based on what the market is actually building.
Price does not tell us what must happen.
The structure it creates shows us what may develop next.
Structure first. Scenarios second.
– Patterns whisper. I listen. – Mr. Nobody 🎧📊
Bitcoin
37 minutes ago
Mr. Nobody | Bitcoin Daily — Structure Before Prediction
Bitcoin
2 days ago
Bitcoin 15M | Structure Must Confirm the Path
ADA Elliott wave analysis From an Elliott Wave perspective, this is how I currently see the larger ADA structure. My primary view is that ADA is still working through a macro Wave 4 correction, with a larger Wave 5 potentially still ahead. The main issue is that I am not fully convinced the Wave 4 correction has completed yet, because there is still meaningful room for price to move lower. That does not mean ADA has to reach the lower green target zone, but historically we have seen many corrections complete around the 1:1 measured move of Wave A, and in this case that level has not yet been reached. There are essentially two ways I think this correction can develop. The first is a relatively simple ABC correction. Under that interpretation, ADA would currently be within Wave 3 of the C-wave decline. It is also possible to argue that the C wave has already completed, because internally we can identify what looks like a five-wave structure. However, as long as ADA remains below roughly $0.38, I think the possibility remains that price continues lower and eventually seeks the 1:1 extension of Wave A, which falls inside the lower green support zone. That makes the $0.38 area the first major hurdle ADA needs to reclaim. A sustained break above it would weaken the immediate bearish C-wave interpretation considerably. Even after that, however, there is a second possibility that needs to be considered: Wave 4 may be developing as a more complex correction rather than a simple ABC. In that scenario, ADA could rally first, potentially back toward the $0.76–$0.80 region shown on the chart, only for that move to become another leg within the broader corrective structure and eventually send price back toward the lower green zone. So for me, the $0.76–$0.80 region becomes the second and much more important hurdle. If ADA can reclaim that area and establish itself above it in a convincing impulsive structure, the probability that the macro Wave 4 correction is finished would increase significantly. At that point, I would be looking much more seriously toward the macro Wave 5 scenario shown on the chart. And if that larger Wave 5 does begin, I currently do not see a major Elliott Wave structural reason for ADA to stop before challenging its previous all-time high, with the larger upside target zone on the chart becoming relevant after that. The key point is that the bullish macro structure remains intact in my view, but ADA still has two important confirmation levels to clear before I would consider the corrective phase decisively behind us. The Market’s Phase TransitionThe Market’s Phase Transition
In physics, matter can exist in different states. Water can be ice, liquid, or vapor, and each state behaves differently even though it is made from the same basic substance. A change in temperature or pressure can cause one state to transform into another. Financial markets can behave in a similar way. The same market can spend weeks trending, move into a range, become increasingly quiet, and then suddenly expand into a powerful move. The market has not changed completely, but its state has changed.
A Trend Is a State of Imbalance
A trend exists when one side of the market consistently has more influence than the other. In an uptrend, buyers are willing to accept higher prices, while in a downtrend, sellers continue accepting lower prices. This creates directional persistence and produces familiar structures such as higher highs and higher lows or lower highs and lower lows. But a trend eventually loses some of this imbalance. Price may still move in the same direction, but the movement becomes less efficient. Pullbacks become deeper, momentum weakens, and the market begins spending more time around certain prices. This can be the first sign that the market is preparing to enter a different state.
Trend → Equilibrium
After a sustained directional move, the market can enter a period where neither buyers nor sellers have enough strength to maintain control. Price starts moving sideways and repeatedly returns toward the same area. Traders usually call this consolidation, but another way to view it is equilibrium. The market is searching for a price where enough participants are willing to transact. Existing positions are closed, new positions are built, and expectations begin to change. What looks like boring sideways movement can actually be a period in which the market is reorganizing itself.
Equilibrium → Compression
Sometimes equilibrium becomes even tighter. The trading range contracts, candles become smaller, and volatility starts declining. Price may repeatedly move between two nearby areas without making meaningful progress in either direction. This is where the physics analogy becomes interesting. Think about a spring being compressed. It may appear quiet from the outside, but its internal condition has changed. A compressed market behaves similarly. Compression does not tell us whether the next major move will be higher or lower, but it tells us that the current quiet state may eventually give way to a larger movement.
Compression → Expansion
Eventually, the balance can break. Price leaves the compressed range, volatility increases, candles become larger, and momentum begins to accelerate. The market suddenly looks completely different from the market that existed only a few sessions earlier. This is the phase transition. However, the transition is not necessarily the breakout candle itself. The breakout is simply the point where the change becomes obvious. The conditions for that move may have been developing much earlier through declining volatility, narrowing ranges, repeated tests, and failed attempts to escape the established area.
Why Traders Often Enter After the Transition
This is where the concept becomes useful for trading. Imagine a market that has been trending upward for several weeks. A trader uses a trend-following strategy and continues buying pullbacks. Eventually, the trend weakens and the market enters a range. The trader continues using the same strategy and starts experiencing failed breakouts. Then, after several attempts, the market finally breaks out and begins another strong move. The trader waits for confirmation and enters. The direction may have been correct, but the market state was recognized too late. The trader was still treating a range like a trend and only changed their approach after the new trend had already become obvious.
What Changes Before the Phase Transition?
There is no single indicator that can tell us exactly when a market will change state. Instead, we can look for changes in behavior. Volatility is one of the most useful clues. ATR, historical volatility, and Bollinger Band width can show whether the market's normal movement is expanding or contracting. Range structure is another clue. A market that once produced large directional candles may begin producing smaller and more overlapping candles. Repeated failed breakouts can also show that the market is testing its boundaries without yet finding enough participation to establish a new direction.
Failed Breakouts Are Information
A failed breakout is not necessarily meaningless noise. When price repeatedly attempts to leave a range and returns inside, the market is effectively testing whether participants are willing to accept prices outside the established area. If those attempts repeatedly fail, the market may still be in equilibrium. But when price eventually breaks out and remains outside the previous range, something different may be happening. The important distinction is not simply whether price crossed a level. It is whether the market accepted or rejected the new prices.
Acceptance Is More Important Than the First Breakout Candle
A candle closing above resistance can look impressive, but the real information often comes afterward. Does price immediately fall back into the previous range, or does it continue trading around the new area? Does volume support the movement? Does the old resistance become support? Does price begin building value above the previous range? These questions help distinguish a temporary price excursion from a genuine change in market behavior. A phase transition is therefore better understood through what happens after the breakout rather than through the breakout candle alone.
Different Market States Require Different Thinking
This also explains why a trading strategy can work extremely well for several months and then suddenly start producing poor results. Trend-following strategies depend on directional persistence. Mean-reversion strategies depend on equilibrium. Breakout strategies depend on expansion. A strategy does not necessarily become useless just because its performance changes. The market environment may simply no longer support the conditions that strategy needs. The important question is therefore not only, “Is my setup present?” but also, “Is the current market state suitable for this setup?
The Market Does Not Have to Follow a Perfect Cycle
The phase-transition model should not be treated as a fixed formula. Markets do not always move neatly from trend to equilibrium, then compression, then expansion. A breakout can fail. A range can continue for months. A trend can accelerate without meaningful compression. The value of the model is not in predicting a perfect sequence. It is in helping traders recognize that market behavior changes and that the same strategy should not automatically be applied to every environment.
The Most Important Move May Begin Before the Breakout
When traders look back at a large market move, they often focus on the candle that started it. But the more interesting information may have appeared much earlier. The range may have been getting smaller. Volatility may have been declining. Price may have repeatedly tested the same boundaries. Failed breakouts may have become more frequent. These changes can reveal that the market is approaching a different state before the final expansion becomes obvious.
Stop Asking Only Where Price Is Going
The usual question in trading is, “Where will price go next?” But perhaps another question is just as important: “What state is the market currently in?” A market in a strong trend should not be approached in exactly the same way as a market trapped inside a narrow range. A compressed market should not be treated like an already-expanded market. Recognizing the state can help traders understand why a setup that worked yesterday may fail today.
The Market Is Constantly Changing State
Markets are not permanently bullish, bearish, trending, or ranging. They are constantly transitioning between different conditions. Trend can become equilibrium. Equilibrium can become compression. Compression can become expansion. Expansion can develop into another trend or fail and return to equilibrium. The exact sequence cannot be known in advance, but the changes in behavior can be observed.
The breakout, therefore, may not be the beginning of the story. It may be the moment when the market's hidden transition finally becomes visible.
Markets do not simply move from one price to another. They move through different states. The real skill may not be predicting the next candle, but recognizing when the state of the market is beginning to change.  Long
Long
Gold: Fear or Structure?⏱️ Reading Time: ~2 minutes
In the market, no structure is carved in stone.
Price itself creates the structure with every move—and as its behavior changes, that structure can change with it.
On the Gold chart, what matters to me is not simply where the market goes next. The real question is:
What structure are the bulls and bears building?
Sometimes price looks calm and corrective, while underneath it, a force is developing that could completely change the path. At other times, a structure that looks perfectly logical can lose its validity after only a few new moves.
And somewhere in this battle, the whales may also decide to make their move.
But we cannot directly read their minds.
All we have is the footprint of their decisions on the chart.
That is why, instead of trying to predict who will win, I watch the structure.
Is price building three waves or five?
Is the structure expanding, or is the movement becoming compressed?
Is current behavior consistent with the previous structure—or is the market beginning to tell a different story?
For me, the Elliott Wave Principle is a language for reading this behavior.
We cannot see the future.
But we can see what the market has carved into the chart so far.
And perhaps that is the best way to understand the endless battle between bulls, bears, and the larger players in the market.
Yes, Gold could still experience a very deep decline.
That possibility is part of the structure—and there is no reason to hide from it.
Fear and doubt are natural when the market reaches important structural territory.
But instead of letting fear decide the story, let price speak.
I am simply sharing my interpretation of what price has carved so far.
The next chapter belongs to Gold itself.
– Patterns whisper. I listen. – Mr. Nobody 🎧📊
Gold Spot / U.S. Dollar
2 days ago
Gold | Has the Triangle Completed and Is the Next Bearish Wave B
 Long
Long
Long 
Short 
 Long
Long
Long 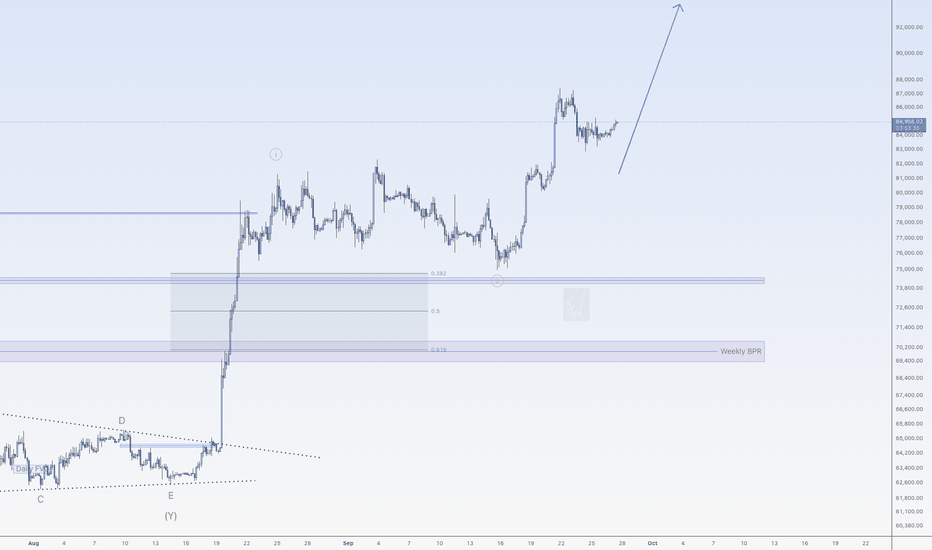
Short 
Long 
 Long
Long