XAUUSD — Weekly Bearish Map Toward 3,850
Gold is entering next week with a heavy structure after failing to hold above the recovery zone. From Kelly’s view, the chart suggests that XAUUSD is still trading under the larger downtrend pressure, and the current price action looks more like a bearish continuation setup than a confirmed bullish reversal.
The key idea is simple: gold is still below the main sell zone and below the larger downtrend structure. If buyers cannot reclaim resistance, sellers may continue to push price toward the lower support zones next week.
⟡ Market structure
Gold is currently trading around 4,284, right below the short-term sell zone near 4,300–4,330. This area is important because price has already reacted from the upper FVG and failed to maintain bullish momentum.
The larger chart still shows a clear bearish pressure from the previous downtrend. Gold attempted to recover from the lower base, but the rally was rejected below the FVG resistance zone around 4,480–4,560. This tells us that buyers are still not strong enough to shift the full structure.
For next week, the first key support is around 4,202. If this level breaks, gold may continue lower toward the stronger support near 3,964, and then the larger Fibonacci / Elliott target near 3,820–3,850.
➤ Key levels
◌ Current price area: 4,284
◌ Short-term sell zone: 4,300–4,330
◌ Resistance buy level: 4,401
◌ FVG resistance: 4,480–4,560
◌ Strong resistance: 4,696
◌ First strong support: 4,202
◌ Major support: 3,964
◌ Main bearish target: 3,820–3,850
◌ Bearish invalidation: above 4,401–4,450
⌁ Elliott Wave view
The chart suggests that gold may still be inside a larger bearish Elliott Wave sequence.
Wave (1) started after price failed from the upper resistance area.
Wave (2) created a recovery into the FVG zone but could not continue higher.
Wave (3) may now develop if price breaks below 4,202.
Wave (4) could create a short rebound from lower support.
Wave (5) may complete the larger downside move near 3,820–3,850.
This is why Kelly is watching the current sell zone carefully. If gold cannot reclaim 4,300–4,330, the market may continue to favor sellers next week.
▸ Trading scenario
Preferred bearish scenario
Entry: Sell around 4,300–4,330 if price gives bearish rejection
Stop Loss: Above 4,450
Take Profit 1: 4,202
Take Profit 2: 3,964
Take Profit 3: 3,820–3,850
Alternative scenario
If gold breaks above 4,401 and holds above this level, the bearish pressure may weaken in the short term. In that case, price could attempt another recovery toward the 4,480–4,560 FVG resistance before sellers return.
◌ Invalidation
The bearish weekly view becomes weaker if gold breaks above 4,401–4,450 with strong bullish momentum. A clean hold above this zone would suggest that buyers are trying to shift the structure back into recovery mode.
⌁ Kelly’s view
Kelly’s main view for next week remains bearish while gold stays below 4,300–4,330 and under the larger downtrend structure. The chart still favors selling rebounds rather than chasing buys too early.
If sellers defend the sell zone, gold may continue toward 4,202, then 3,964. If bearish momentum expands, the bigger Elliott Wave target remains near 3,820–3,850.
Do you think gold will reject from the sell zone next week, or will buyers try to reclaim 4,401 first?  Short
Short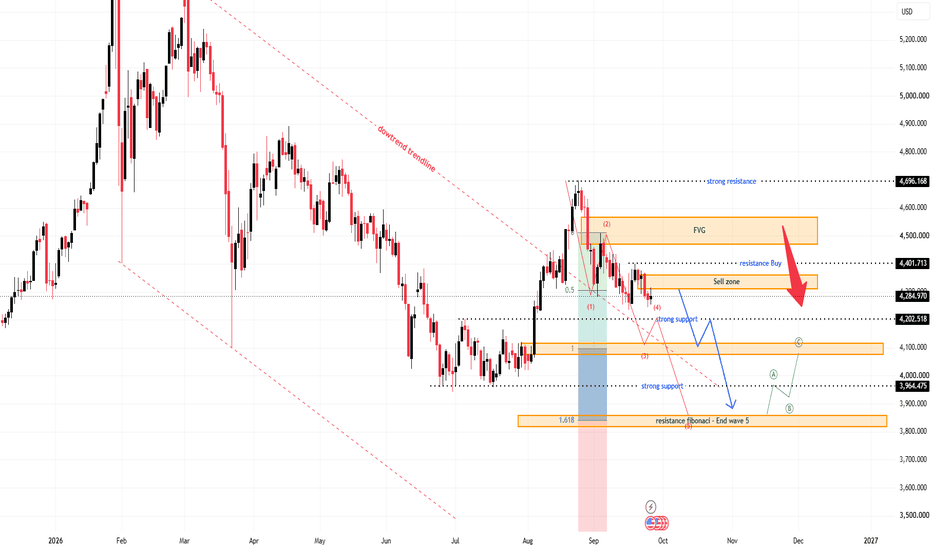
 Long
Long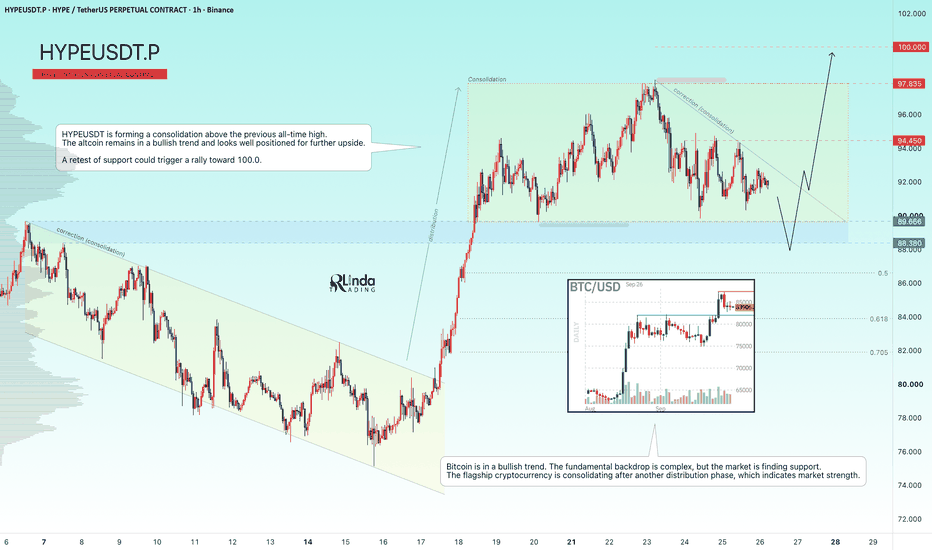
BITCOIN - Bullish trend. Consolidation before rallyBINANCE:BTCUSDT.P previously went through a trend reversal phase and broke above the key 83K resistance. Consolidation is forming above this zone, hinting at further upside, however...
The fundamental backdrop remains unstable. However, profit-taking in BTC is currently not particularly strong, and there is no significant selling pressure. Consolidation following the strong rally, along with the weak reaction to negative news, points to market strength. Spot ETF inflows are gaining momentum. Trading volumes are increasing. Altcoins are showing strong growth, so far without significant leverage. Technically, the backdrop is becoming increasingly favorable...
Bitcoin is breaking through the 83K resistance and consolidating above this zone, indicating readiness for a rally. The market is confirming the trend reversal; however, a correction aimed at hunting liquidity could occur before further upside. The key focus is on 82,300–80K.
Resistance levels: 87,400, 90,000, 100K
Support levels: 82,800, 82,300, 80K
The retest of the May support level formed a 82,800–82,300 liquidity pool, which could be tested before another move higher. A long squeeze could shift the balance of power in favor of buyers and trigger further upside toward 90K–100K.
Best regards, R. Linda!  Long
Long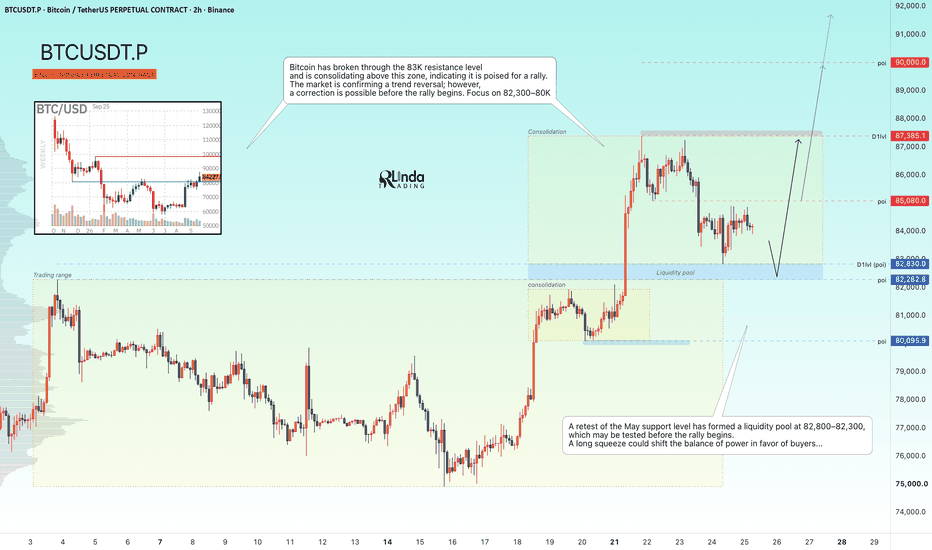
Bitcoin Breakout Retest — Is $90K the Next Target?Bitcoin ( BINANCE:BTCUSDT ) appears to have successfully broken above the Heavy Resistance Zone and is now completing a pullback toward this area.
BTC also reacted very well to the Cumulative Long Liquidation Leverage($83,220-$82,300) and started to move higher from this zone.
Can Bitcoin confirm the breakout and extend its bullish move above $87,000?
Technical Analysis
From an Elliott Wave perspective, Bitcoin appears to have completed Primary Wave 4, suggesting that the next Impulsive Waves could begin developing over the coming hours.
The current pullback toward the previously broken Heavy Resistance Zone could also act as a retest before another bullish move.
💡 Educational Note: After a resistance breakout, a pullback toward the broken zone can act as a bullish retest if buyers successfully defend the area as new support.
I expect Bitcoin to rise at least toward the Cumulative Short Liquidation Leverage.
If bullish momentum increases, BTC could extend the move toward the major Potential Reversal Zone(PRZ) .
Trade Setup
First Take Profit(TP): $86,870
Second Take Profit(TP): $88,810
Stop Loss(SL): $81,770
Cumulative Long Liquidation Leverage: $83,220-$82,300
Upper CME Gap: $87,825-$87,700
Potential Reversal Zone(PRZ): $91,860-$88,760
Do you think Bitcoin can move back above $87,000?
🟢 Yes
🔴 No
📌 Bitcoin Analysis(BTCUSDT), 4-hour time frame.
🛑 Always use proper risk management and set a Stop Loss(SL) for every position.
🚀 If this analysis helps your trading plan, a BOOST would help more traders discover it. Long 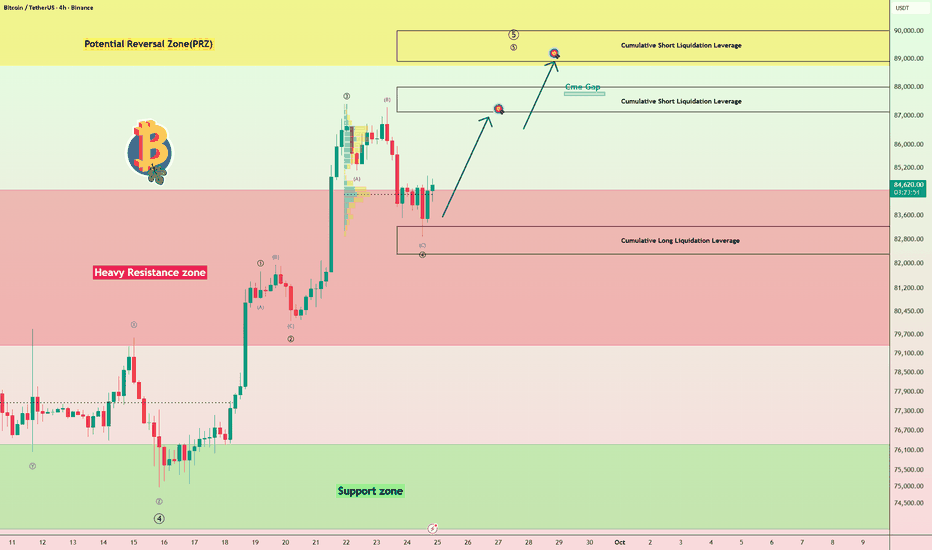
Gold Tests 61.8% Fibonacci — Is the Correction Almost Over?Gold ( OANDA:XAUUSD ) has been in a bearish trend over the past 6–7 days, but the decline has developed with relatively weak momentum.
Interestingly, the bullish move completed in less than two days has still not been fully retraced after nearly a week of declining prices, suggesting that buyers continue to show relative strength.
Can gold defend the Heavy Support Zone and begin another bullish move, or is a deeper correction approaching?
Macro Outlook
The U.S. 10-Year Treasury Yield(US10Y) could also begin a bearish move.
If Treasury yields decline, this could provide additional support for gold and strengthen the short-term bullish scenario.
Technical Analysis
Gold is currently trading near the important 61.8% Fibonacci level on the Daily time frame and inside the Heavy Support Zone($4,274-$4,178).
From an Elliott Wave perspective, on the 4-hour time frame, gold appears to still be completing a Double Three Correction(W-X-Y).
I initially expected this corrective structure to complete earlier, but as long as gold remains above $4,233, the current scenario remains valid.
💡 Educational Note: The 61.8% Fibonacci retracement is one of the most closely watched levels during corrections and can become an important reaction area when it overlaps with a major Support Zone.
I expect gold to start a bullish move after breaking above the key trading level of $4,284, with an initial target around $4,337.
If gold successfully breaks above the key $4,355 level, the bullish move could extend toward $4,381 and potentially higher levels.
Trade Setup
First Take Profit(TP): $4,337
Second Take Profit(TP): $4,381
Stop Loss(SL): $4,229
Key Trading Levels: $4,284 _ $4,355 _ $4,400
Which level do you think gold will reach first?
🟢 $4,381
🔴 $4,229
📌 Gold Analysis(XAUUSD), 4-hour time frame.
🛑 Always use proper risk management and set a Stop Loss(SL) for every position.
🚀 If this analysis helps your trading plan, a BOOST would help more traders discover it. Long 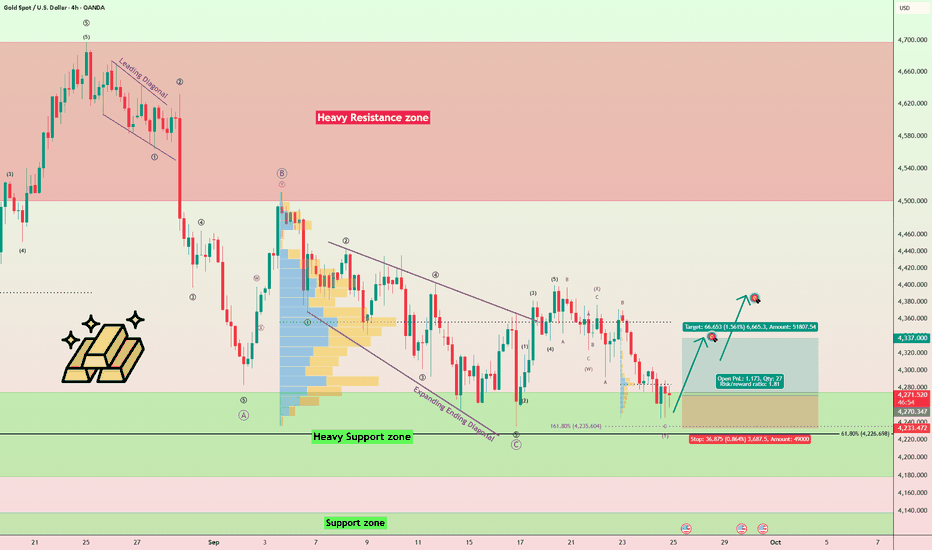
GOLD - The Hunt for Liquidity (Correction) Before the Drop ICMARKETS:XAUUSD has paused its decline but remains under pressure. Market stagnation could trigger a rebound before another move lower. The key events are the Trump–Xi meeting, oil price dynamics, and Treasury yields.
The fundamental backdrop for gold remains weak. The market could form a correction amid the meeting between the U.S. and Chinese presidents, but the medium-term tone for the metal remains bearish, driven by a strong dollar and rising oil prices. The dollar and major indices are temporarily correcting, which could allow gold to rebound toward the 4,322–4,333 liquidity zone before continuing lower toward 4,230–4,200.
Drivers:
Downside: rising oil prices and yields, dollar strength, hawkish Fed, escalation in the Middle East.
Upside: falling oil prices and yields, softer U.S. data, progress in trade negotiations, de-escalation.
Resistance levels: 4300, 4322
Support levels: 4275, 4250, 4200
Technically, the market remains in a medium-term bearish trend amid the weak fundamental backdrop. Against the backdrop of the upcoming news, gold could retest the 4,320 liquidity zone, while a short squeeze could in turn trigger further downside.
A close below 4,275 would also increase selling pressure, which could lead to further downside toward 4,200.
Best regards, R. Linda! Short 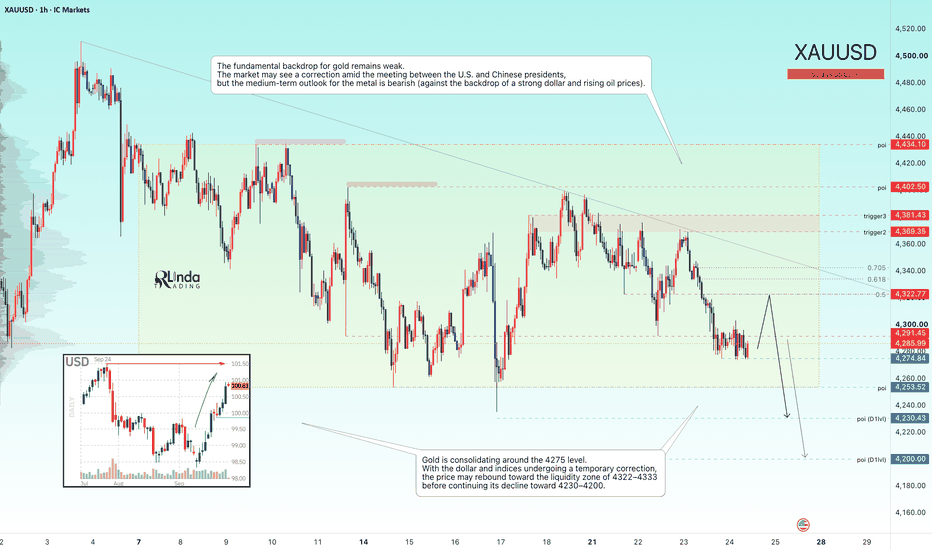
XAUUSD — Bullish Recovery Before Weekly Close
Gold is showing a bullish recovery attempt after reacting strongly from the lower end wave 5 area near 4,245–4,250. From Kelly’s view, the chart suggests that XAUUSD may be shifting from the previous bearish sequence into a short-term bullish correction, especially as price is now trying to hold above the Buy test liquidity zone before the weekly candle closes.
The key idea is simple: if gold can stay above the lower liquidity support, the market may continue recovering toward the next resistance zones before the week ends.
⟡ Market structure
Gold is currently trading around 4,296, right near the short-term sell scalping area around 4,295–4,305. This is the first decision zone for buyers.
The previous downside wave appears to have completed near 4,245–4,250, where price reacted strongly and started building a recovery structure. The current rebound is still early, but the reaction from the bottom shows that sellers are losing momentum in the short term.
The key support now is the Buy test liquidity zone around 4,280–4,288. If gold retests this area and buyers defend it, the bullish structure may continue toward 4,325–4,335, which is marked as the Sell zone wave 4.
A clean break above 4,325–4,335 would open the next bullish path toward the higher resistance area near 4,365–4,375.
➤ Key levels
◌ Current price area: 4,296
◌ Buy test liquidity: 4,280–4,288
◌ Lower wave 5 base: 4,245–4,250
◌ Short-term resistance: 4,295–4,305
◌ Sell zone wave 4: 4,325–4,335
◌ Main bullish target: 4,365–4,375
◌ Bullish invalidation: below 4,245
⌁ Elliott Wave view
The chart shows that the previous bearish wave 5 may have completed around 4,245–4,250.
After that low, gold started to form a new recovery structure:
Wave (1) may have started from the bottom reaction.
Wave (2) may retest the 4,280–4,288 liquidity support.
If this zone holds, wave (3) may push toward 4,325–4,335.
Wave (4) may create a small pullback after testing resistance.
Wave (5) could then extend toward 4,365–4,375.
This is why Kelly is watching the current weekly close carefully. If gold can close strong above the buy test zone, the bullish recovery structure becomes cleaner going into the next session.
▸ Trading scenario
Preferred bullish scenario
Entry: Buy around 4,280–4,288 if price gives bullish confirmation from the liquidity zone
Stop Loss: Below 4,245
Take Profit 1: 4,305
Take Profit 2: 4,325–4,335
Take Profit 3: 4,365–4,375
Alternative entry
If gold breaks above 4,305 and retests this area as support, buyers may look for continuation toward 4,325–4,335 first, then 4,365–4,375.
◌ Invalidation
The bullish view becomes weaker if gold breaks below 4,245 and fails to reclaim the buy liquidity zone. In that case, the recovery structure may fail, and sellers could regain control.
⌁ Kelly’s view
Kelly’s main view is cautiously bullish while gold holds above 4,280–4,288 before the weekly candle closes. The market has reacted strongly from the lower wave 5 zone, and the current structure suggests a possible recovery phase.
If buyers defend the liquidity support and price breaks above 4,305, gold may continue toward 4,325–4,335, then potentially 4,365–4,375.
Do you think gold will close the week above the buy zone, or retest liquidity once more before the next rally? Long 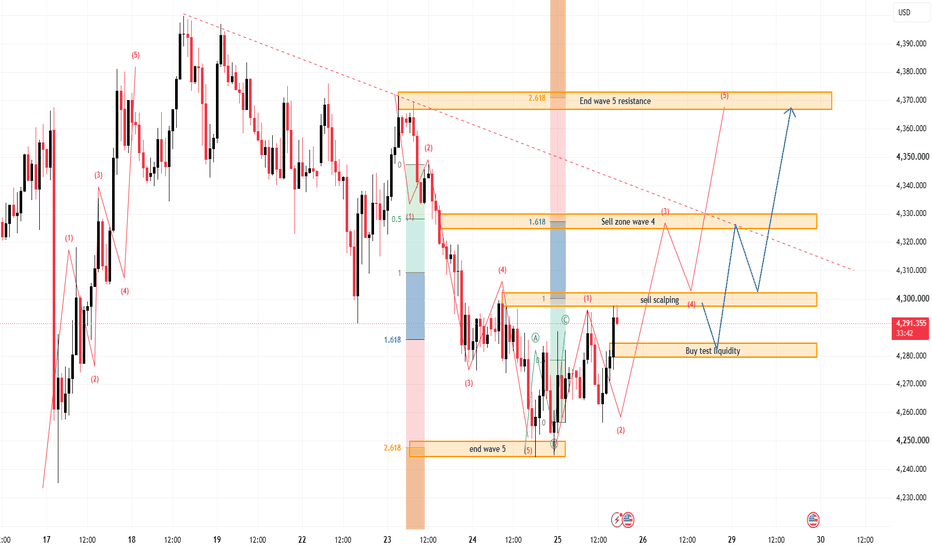
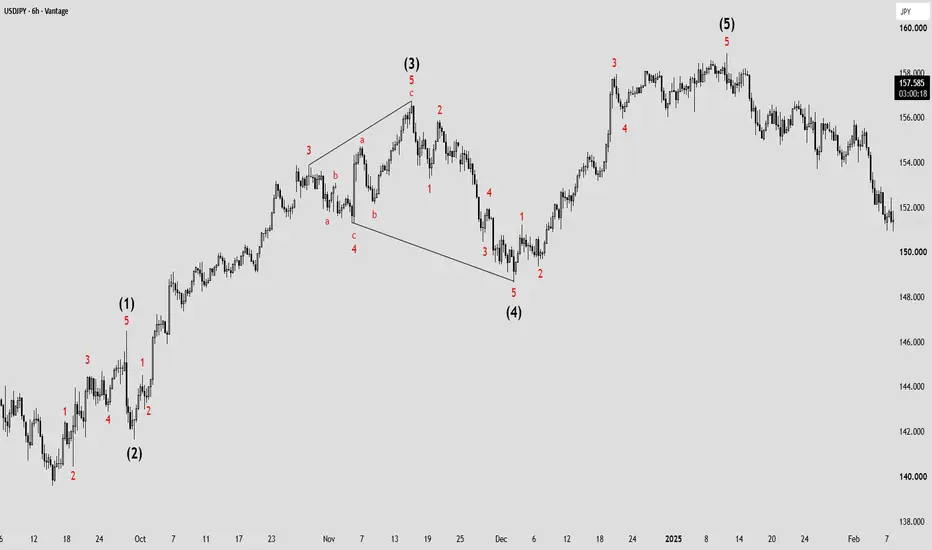
Deep Elliott Wave Lesson🇺🇸🇯🇵 USDJPY – 6H | Deep Elliott Wave Lesson | From the Simple Chart to the Full Count Step by Step
Today we have a very detailed and deep lesson in Elliott Wave.
My goal is not just for you to see the numbers on the chart. My goal is for you to understand why the count looks like this, how to build the count yourself from scratch, and how to distinguish between a correct count and a weak one.
We will go together through four charts of the same move on USDJPY 6-hour timeframe, from the simplest chart to the most detailed one.
Each chart represents a stage in building the wave count.
---
Chart 1 – The Main Count Only (The Big Picture)
This is the most important chart you must learn to see first.
In this chart we only see the five main waves:
(1) → (2) → (3) → (4) → (5)
There are no internal subdivisions, no a-b-c, no channels. Just the basic structure.
Why do we start this way?
Because most beginners (and even some professionals) jump straight into counting the small waves and then get lost. The result is a wrong wave count, or they keep changing the count every short while.
The golden rule:
The first thing you must see is the big five-wave structure.
Look at the move with me:
- Wave (1): Strong rally from the bottom, clearly impulsive.
- Wave (2): Clear correction where price dropped noticeably.
- Wave (3): The longest and strongest upward wave in the entire structure.
- Wave (4): Relatively deep correction, price dropped clearly.
- Wave (5): The final rally that took price to the ultimate high near 158.50 approximately.
If you cannot clearly see these five waves on the chart, the entire count is weak and not worth continuing with.
This chart teaches you to “see the forest before the trees.”
---
Chart 2 – Adding the Basic Internal Subdivisions
Now we move one step forward.
In this chart we started adding the internal subdivisions inside the larger waves.
Notice that:
- Wave (1) itself subdivided into 5 smaller waves.
- Wave (3) has clear subdivisions.
- Wave (4) showed a more detailed correction.
Why is this step important?
Because Elliott Wave is built on the principle of self-similarity (Fractal). This means every large impulsive wave must be made of 5 smaller waves, and every large corrective wave must be made of 3 waves (or a complex pattern).
If you find a large wave that is supposed to be impulsive, but when you look inside it you only find 3 waves, then there is a serious problem in the count.
This stage is where you start “testing” the validity of the main count you saw in the first chart.
---
Chart 3 – Deeper Details + Starting to Apply Advanced Rules
Now we enter a higher level.
In this chart we see:
- Clearer subdivisions inside wave (3).
- Wave (4) correction became more clear and complex.
- Sub-wave numbers (1)(2)(3)(4)(5) appeared in certain parts.
Here we start applying one of the most important rules that separates an average analyst from a strong one:
The relationship rule between wave 1-2 and wave 3-4 (Depth Alternation Rule)
This is a golden rule, and many people do not apply it:
- If wave 1-2 comes short and quick , wave 3-4 will often be a violent and deep correction .
- And the exact opposite is also true: if wave 1-2 comes as a deep and long correction , wave 3-4 will often be a quick and shallow correction .
Why does this happen?
Because the market always tends toward alternation. If the first correction is simple, the second correction tends to be more complex or deeper, and vice versa.
This rule gives you an early expectation of the shape of wave 4 before it fully forms.
In the current chart, notice how wave (2) was clear and relatively deep, while wave (4) came differently in both depth and time.
---
Chart 4 – The Complete Count with All Details and Channels
This chart is the final complete count that we actually use in professional analysis.
It contains everything:
- The main waves (1)(2)(3)(4)(5)
- Internal subdivisions of every wave
- a-b-c type corrections
- Price channels that help determine wave endings
- Relationships between the waves
Notice especially:
- Inside wave (3) there are clear internal corrections (a-b-c).
- Wave (4) came as a more complex correction rather than a simple zigzag.
- Wave (5) completed the rally and reached the final area.
The price channels in this chart are very important because they give you potential targets and confirm that the count is still valid.
---
Secrets of Correction Types (One of the Most Important Parts of the Lesson)
This point is considered by many professionals as one of the “secrets” of correct counting, because it helps you distinguish between a strong count and a weak count from the first look.
1. Wave 1-2 (The first correction):
Usually you will not see:
- Diagonal
- Triangle
- Complex or combination patterns
The most common patterns in wave 1-2 are:
- Zigzag
- Simple Flat
Meaning a relatively “clean” and simple correction.
If you see a triangle or diagonal in wave 2, there is often a problem in the count, or at least you should be very careful.
2. Wave 3-4 (The second correction):
Here the situation is completely different.
Wave 4 is often more complex, and the most common patterns in it are:
- Flat (in its various forms)
- Triangle
- Sometimes combination corrections
This is why we often see wave 4 moving sideways, taking more time, or being more complex than wave 2.
If you understand this point well, you will be able to anticipate the shape of wave 4 before it completes, and this gives you a big advantage in analysis.
---
How to Build the Count Yourself Step by Step (Practical Method)
1. Start with the big picture: Can you clearly see 5 main waves?
2. Identify wave (3): It should usually be the strongest and longest.
3. Look at wave (2) and wave (4): Is there alternation in depth and time?
4. Go into the internal subdivisions: Every impulsive wave must be 5, every corrective wave must be 3 or complex.
5. Apply the correction type rule (1-2 simple, 3-4 more complex).
6. Use price channels for confirmation.
7. If the price action violates the basic rules, do not force the count. Change it.
---
Common Mistakes You Must Avoid
- Counting the small waves before seeing the big structure.
- Forcing the count just to make it “look nice.”
- Forgetting the alternation rule between wave 2 and wave 4.
- Placing a triangle or diagonal in wave 2 without strong justification.
- Considering any rally as 5 waves without checking relative strength.
---
Final Summary
Wave counting is not random art. It is a system with clear rules.
The four charts we explained represent the stages of building the count:
- Chart 1: The big structure only
- Chart 2: Adding the basic subdivisions
- Chart 3: Deeper details + applying the rules
- Chart 4: The complete count with all tools
Always start from the simple, then move to the detailed.
And never forget:
- Short wave 1-2 → often violent wave 3-4
- Deep wave 1-2 → often quick wave 3-4
- Wave 1-2 is usually Zigzag or Flat
- Wave 3-4 is usually Flat or Triangle
If you apply these rules consistently, your analysis level will rise significantly.
Watch the structure, and do not force the count on the chart. The market decides, not you.
---
⚠️ Disclaimer
This lesson is purely educational and is based on Elliott Wave Theory and price action reading. It does not represent any financial advice or a direct call to buy or sell.
The wave count is subject to change as market movement develops, and levels and targets may differ if the structure changes.
Capital management and risk management are the full responsibility of the trader.
Trade with a plan. Trade with discipline. 📈 XAUUSD — Wave 5 Drop Before Rebound
Gold is still moving inside a bearish channel after failing to hold above the short-term support area. From Kelly’s view, the chart suggests that XAUUSD may still need one more downside leg to complete wave (5), before a light corrective rebound appears from the lower buy zone.
The key idea is simple: gold may continue lower first toward the End wave 5 / Buy zone, then create a short ABC recovery back toward the resistance area.
⟡ Market structure
Gold is currently trading around 4,263, after breaking below the previous support near 4,275. This shows that sellers are still controlling the short-term structure.
The market remains inside a descending channel, and price is still printing lower highs under the trendline. As long as gold stays below the 4,290–4,298 sell zone, the bearish wave structure remains valid.
The next important downside area is the 4,245–4,252 End wave 5 / Buy zone. This zone may act as the final reaction area for the current bearish wave. If buyers defend this area, gold may create a light rebound toward 4,275, then possibly 4,290–4,298.
➤ Key levels
◌ Current price area: 4,263
◌ Strong support turned resistance: 4,275
◌ End wave 5 / Buy zone: 4,245–4,252
◌ Short-term rebound target: 4,275
◌ Main sell zone: 4,290–4,298
◌ Bearish invalidation: above 4,305
⌁ Elliott Wave view
The chart shows a bearish Elliott Wave structure developing inside the descending channel.
Wave (1) started after price rejected from the upper area.
Wave (2) created a corrective rebound but failed under resistance.
Wave (3) pushed gold lower toward the lower channel structure.
Wave (4) created a small recovery near 4,290, but sellers rejected it again.
Wave (5) may now continue toward 4,245–4,252 to complete the bearish sequence.
After wave (5) completes, gold may form a small ABC correction. In that case, the rebound target could be 4,275 first, then the stronger sell zone around 4,290–4,298.
▸ Trading scenario
Preferred bearish scenario
Entry: Sell on rejection below 4,275–4,290
Stop Loss: Above 4,305
Take Profit 1: 4,252
Take Profit 2: 4,245
Rebound scenario after wave 5
If gold reaches 4,245–4,252 and gives bullish reaction, price may correct upward toward 4,275, then 4,290–4,298.
This rebound should be viewed as a correction first, not a confirmed bullish reversal, unless gold breaks and holds above the sell zone.
◌ Invalidation
The bearish view becomes weaker if gold breaks above 4,305 and holds above the sell zone. In that case, the current wave (5) downside setup may fail, and price could attempt a stronger recovery.
⌁ Kelly’s view
Kelly’s main view remains bearish first, with gold likely to complete wave (5) near 4,245–4,252. After that, a light corrective rebound may appear toward 4,275 or 4,290–4,298.
The cleaner plan is not to chase price at the current level, but to watch whether gold completes wave (5) at the lower buy zone and then reacts with a short recovery.
Do you think gold will complete wave (5) first, or rebound before reaching the lower buy zone? Short 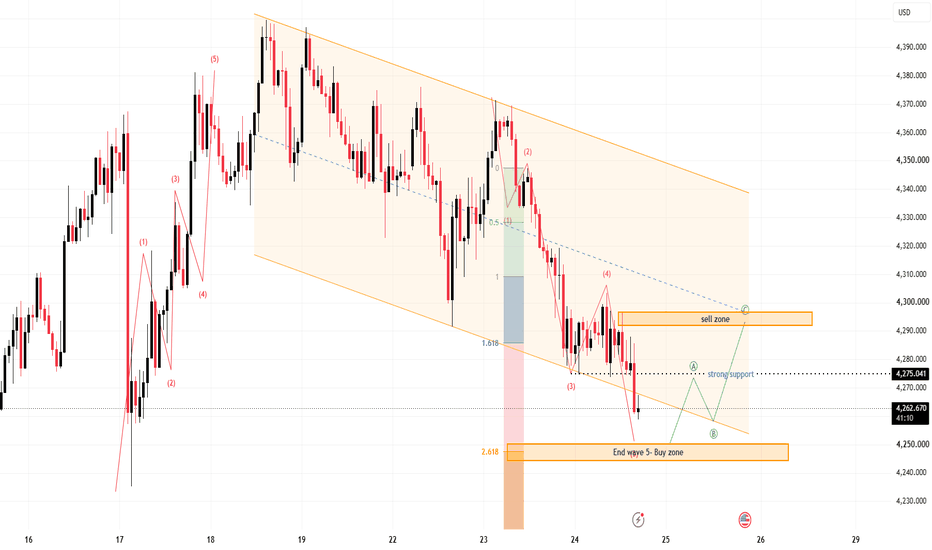
Bitcoin 15M | Structure Must Confirm the Path⏱️ Reading Time: ~2 minutes
Hey everyone,
In this short-term Bitcoin update, I’m looking at two main paths. At the moment, however, the bearish scenario has the stronger structural position.
🟢 Bullish Scenario
For the bullish scenario to become more convincing, the market needs to prove itself through a clear motive structure.
Simply breaking above a resistance level or making a sharp move higher is not enough for me. The new advance should develop a recognizable impulsive structure, followed by a correction that is proportional to the previous growth in terms of depth, time, and wave personality.
If the correction remains within an appropriate range and the internal structure continues to support the bullish case, the path toward the higher targets could become active again.
So in this scenario, the market needs to prove itself.
🔴 Bearish Scenario
On the other hand, the bearish scenario currently provides a simpler structural explanation for the recent price action.
If the latest bullish move fails to develop into a complete motive structure and price loses the key levels marked on the chart, the possibility increases that the recent rise was part of a corrective pattern.
In that case, the current decline could be a continuation of that corrective structure, potentially developing into a larger bearish sequence as the next waves unfold.
Even here, however, the size of the decline alone is not enough for me. We need to see whether the market actually develops a bearish structure wave by wave and degree by degree.
🔎 Final Thought
For now, the bearish scenario has the stronger structural position, but the bullish scenario is not invalidated.
For that to change, the market needs to build a clear motive structure on the upside and then show that the following correction is proportional to the previous advance and consistent with its wave personality.
Ultimately, what matters to me is not simply the direction of price, but the quality of the structure the market develops next.
The structure must prove itself; we simply listen.
– Patterns whisper. I listen. – Mr. Nobody 🎧📊
🔎 A Note on the Previous Decline
One important point I want to add is that, before the previous major decline, I was already considering the bearish scenario more likely based on the structure. The subsequent price action provided further confirmation of that interpretation.
This time, however, I’m not giving the bullish scenario the same level of structural confirmation yet. The bullish path still needs to prove itself through a clear motive structure and a proportional correction.
So for now, I’m keeping the bearish scenario structurally stronger, while allowing the market to show whether the bullish alternative can earn that confirmation.
Bitcoin
2 days ago
Bitcoin 2H | An Impulse at the Crossroads
Short 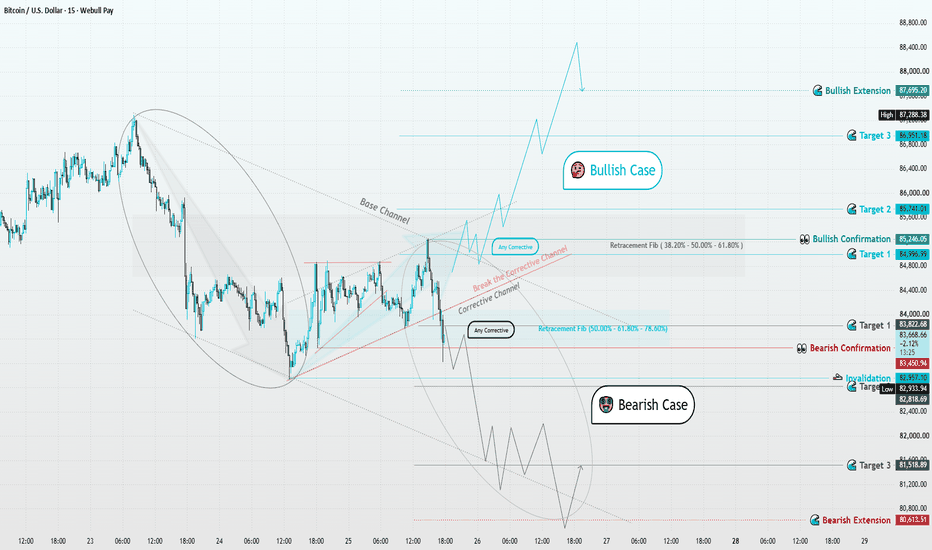
 Long
Long
US10Y Enters a Major PRZ: Is a Treasury Yield Correction Next?The U.S. 10-Year Treasury Yield ( TVC:US10Y ) is one of the most important benchmarks for global interest rates and financial conditions.
When US10Y rises sharply, it can tighten financial conditions and pressure stocks, gold, Bitcoin, and other risk assets. A decline in yields can have the opposite effect and support these markets.
US10Y has now entered an important technical area. Can the bullish trend continue, or is a correction about to begin?
Technical Analysis
US10Y has developed a strong bullish move over the past 2–3 days and has now entered the Resistance Zone(5.55%-4.93%).
It is also trading near the upper trendline of an Ascending Channel, the major Potential Reversal Zone(PRZ) , Monthly Resistance 5, and Yearly Resistance 2.
This technical confluence could become an important reversal area.
From an Elliott Wave perspective, US10Y appears to be completing Wave 5, after which corrective waves could begin developing to the downside.
💡 Educational Note: A decline in Treasury yields generally reduces pressure on financial conditions and can support non-yielding assets such as gold, as well as risk assets like Bitcoin and U.S. equities.
I expect the U.S. 10-Year Treasury Yield to begin a corrective move from this area.
If this scenario develops, lower yields could support higher prices in gold, Bitcoin, and major U.S. stock indices.
Trade Setup
First Take Profit(TP): 5.03%
Second Take Profit(TP): 4.95%
Stop Loss(SL): 5.29%
Which level do you think US10Y will reach first?
🔴 4.95%
🟢 5.29%
📌 U.S. 10-Year Treasury Yield(US10Y), Daily time frame.
🛑 Always use proper risk management and set a Stop Loss(SL) for every position.
🚀 If this analysis helps your trading plan, a BOOST would help more traders discover it.  Short
Short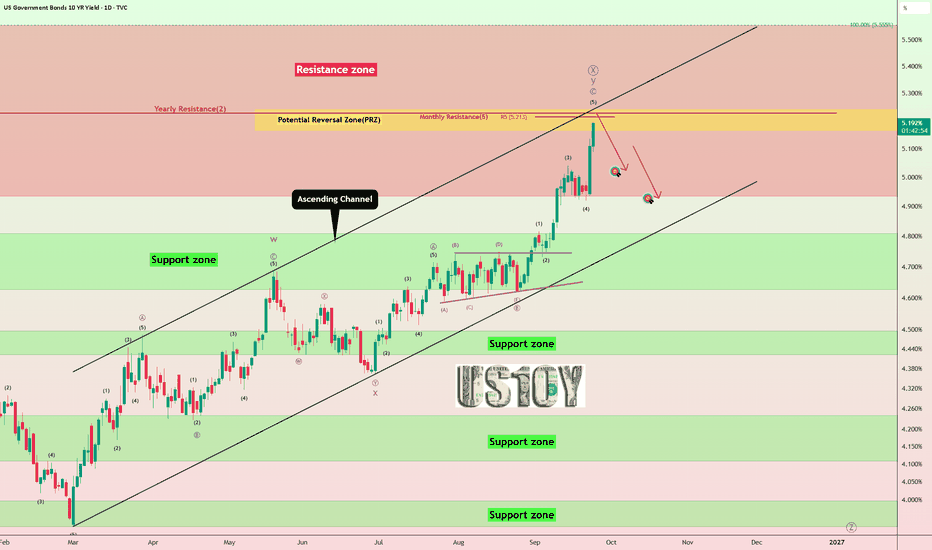
Gold | Has the Triangle Completed and Is the Next Bearish Wave B⏱️ Reading Time: ~2 minutes
In our previous analysis, we considered both bullish and bearish scenarios.
However, based on the current structure, the bullish scenario is temporarily off the table.
🔻 Bearish Scenario
If the Triangle shown on the chart has indeed completed, the current move may mark the beginning of a new bearish structure.
In this case, we would expect the decline to develop through at least a three-wave structure. The important point is that a deeper decline could retrace a significant portion of the recent advance, making that advance more consistent with a sharp correction rather than the beginning of a new bullish trend.
From a higher-degree perspective, there is another important possibility:
If the previous Daily structure was a Leading Diagonal, Elliott Wave guidelines allow for the correction that follows it to be sharp and deep.
For this reason, at this stage, we are not focused on price direction alone.
The way the next waves develop will be what confirms or challenges the bearish scenario.
🔍 Structure Before Forecast
For now, our focus is on how price reacts to the corrective channel and the confirmation levels marked on the chart.
If the bearish structure develops properly, lower targets may gradually come into play.
But if the market builds a valid bullish structure again, the current wave count will need to be reconsidered.
We are not here to guess the market’s path.
We wait for the structure to reveal it.
Patterns whisper. I listen. — Mr. Nobody 🎧📊
Gold Spot / U.S. Dollar
2 days ago
Gold: Listening to the Structure Behind the Next Move
Short 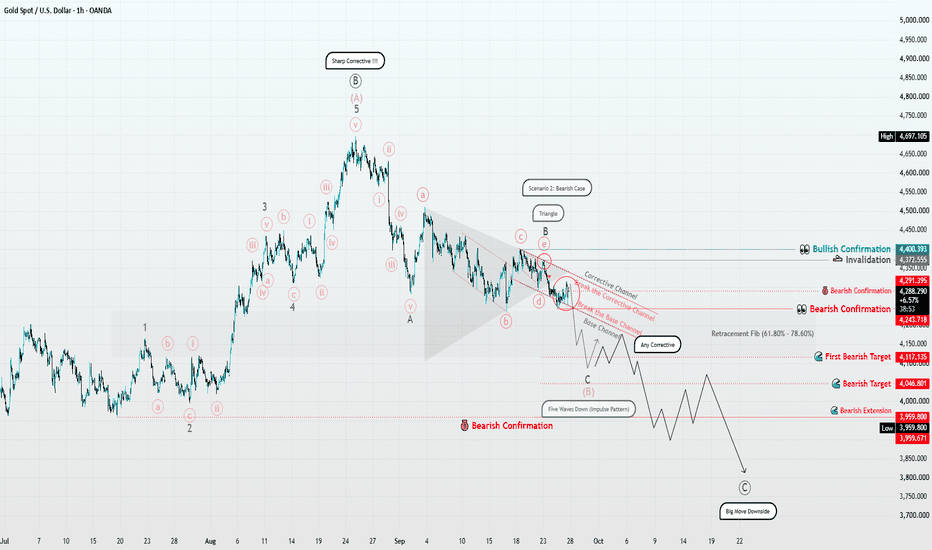
USDCHF – Potential Move UpOn the higher timeframe (3D) , the larger structure of USDCHF shows a completed ABC correction.
Wave A was completed in July 2023 and developed as a Leading Diagonal. This was followed by a large Triangle pattern forming Wave B , which was completed in January 2025.
From there, USDCHF developed a strong five-wave impulse to the downside, forming Wave C . This is an important confirmation of the larger structure, as Wave C needs to unfold with an impuslive character.
The fifth wave of Wave C eventually completed in February 2026, and since then, USDCHF has been developing a corrective move to the upside.
The current correction is taking the form of a complex W-X-Y-X-Z structure, with the final Z wave currently in progress.
On the lower timeframe (8H) , we can see the internal structure of this correction more clearly.
The W-X-Y-X portion appears to be completed, leaving the final Z wave to the upside.
The current Z wave is developing as a W-X-Y structure. Wave W is currently unfolding as an ABC correction, with Wave A and B already completed. This leaves us in the final Wave C to the upside.
The subwaves are indicating that a short-term correction could develop from the current area before another push higher potentially completes Wave C of W and thats exactly where we could be looking for another trade .
Additional confluence comes from a bullish MACD cross on the 3D timeframe and Seasonality , which is also pointing towards further upside into the end of November, which would fit well with the expected completion of Wave Z.
The last time we covered USDCHF here on TradingView, the structure resulted in a successful trade. The current Elliott Wave structure is now presenting another interesting setup to watch.
This is a scenario based on structure and confirmation its not just a prediction. The count remains subject to change if the market invalidates the current structure. Brent Crude Oil | Is a Nested Structure Developing?⏱️ Reading time: About 2 minutes
In this latest 4H update of Brent crude oil, the main focus remains on the bullish structure. However, this scenario can only become stronger if the market continues to maintain a sequence of nested structures across multiple degrees.
At the moment, after the initial wave, we are watching the development of 1&2 structures across different degrees. The recent decline does not invalidate this scenario by itself, as it could still be part of a lower-degree correction.
It is even possible that the current decline is only the first leg of a smaller corrective structure. Therefore, what matters is not simply how deep the decline becomes, but where it fits within the overall structure and how price responds afterward.
As long as the important lows of the previous structures hold, and each Wave 2 does not move beyond the origin of its corresponding Wave 1, the nested structure remains valid for consideration.
However, if the decline continues and the lower-degree structures fail to hold, the probability of a larger-degree correction, potentially Wave II?, would increase.
For now, the bullish scenario still needs price action after each correction.
The market needs to show impulsive behavior again, maintain the sequence of nested structures, and, most importantly, demonstrate increasing strength as the upside structure develops.
If this behavior continues, each new meaningful low could provide valuable information about the development of a larger Wave III.
For me, the main question remains:
Is the market actually building a nested structure at the beginning of Wave III, or was this advance part of a larger corrective structure?
For now, the chart does not give us a definitive answer.
So we let price reveal the next structure.
Patterns whisper. I listen.
— Mr. Nobody 🎧📊
CFDs on Crude Oil (WTI)
4 days ago
Crude Oil | What Is the Current Wave Structure Telling Us?
EURCHF – The Next Scena🇪🇺🇨🇭 EURCHF – 6H | Elliott Wave Analysis | The Next Scenario
In this analysis, we are tracking the movement of EURCHF on the 6-hour timeframe , with a focus on the Elliott Wave structure, the main price channel, and the key levels that may guide the next phase of the market.
📐 1. The Bigger Picture
The current price structure appears to be part of a larger bullish wave sequence, which can be interpreted as:
(1) → (2) → (3) → (4) → (5)
Wave (1) was completed around the 0.9250 area, followed by a corrective Wave (2) that ended near 0.9090 .
From there, the current bullish movement began.
🔹 2. Wave (3)
After the completion of Wave (2) , price started building a strong bullish move with a clear internal subdivision.
The internal count shown on the chart is:
(i) → (ii) → (iii) → (iv) → (v)
This sequence has gradually pushed price higher within the rising channel.
📈 3. Where Are We Now?
Price reached the 0.9450 area and then began a short-term correction toward the lower rising trendline.
This makes the current area important, as the illustrated scenario suggests that this correction may be part of the final phase of the internal structure before the bullish move resumes.
🟢 4. Bullish Scenario
If price maintains the rising channel and continues to hold above the current support areas, the projected path on the chart is:
Continuation of the current bullish move
⬇️
Breakout of the recent high
⬇️
Move toward 0.96747
⬇️
Correction forming Wave (4)
⬇️
Continuation toward Wave (5)
This is the path illustrated by the arrows and dashed lines on the chart.
🎯 5. Key Levels
0.9250
A previous key level and major resistance area that was broken during the current bullish move.
0.9350 – 0.9400
An area associated with the current rising trendline and worth monitoring during any corrective move.
0.96747
The level marked on the chart as a potential target for Wave (3) .
Around 0.9550
The potential correction area for Wave (4) within the illustrated scenario.
0.9770 – 0.9800
The potential Wave (5) target zone according to the projected path.
🔴 6. What If the Correction Continues?
The bullish scenario mainly depends on price maintaining the rising channel and preserving the current structure.
A continued decline and a clear break of the major support trendlines may indicate that the correction is deeper than expected. In that case, the Elliott Wave count would need to be reassessed rather than assuming that the bullish move will continue immediately.
🧠 7. The Core Idea Behind This Analysis
The purpose of this setup is not to assume that price must reach 0.96747 or 0.9800 with certainty.
The idea is that the current structure allows us to interpret the movement as part of a larger bullish Wave (3) . If continuation is confirmed, we can then monitor the next high, followed by a potential Wave (4) correction before another attempt to complete Wave (5) .
For that reason, the key elements to monitor are:
Channel → Highs & Lows → Breakout → Confirmation
📌 Conclusion
The current Elliott Wave count on EURCHF – 6H suggests a potential continuation of the bullish Wave (3) , with a key area of interest around:
0.96747
After that, the scenario suggests a possible correction toward approximately 0.9550 , followed by a potential continuation of Wave (5) toward:
0.9770 – 0.9800
However, this remains a potential technical scenario , not a guaranteed path. Price action itself will determine whether the Elliott Wave count is confirmed or invalidated.
Follow the structure, and do not get ahead of the market.
⚠️ Disclaimer
This analysis represents a technical view and potential scenario based on Elliott Wave theory and price action. It is not financial advice and does not constitute a direct recommendation to buy or sell.
The Elliott Wave count may change as market conditions develop, and the projected targets and levels may become invalid if the technical structure changes.
Risk management and capital management are entirely the responsibility of the trader.
Trade with a plan. Trade with discipline. 📈
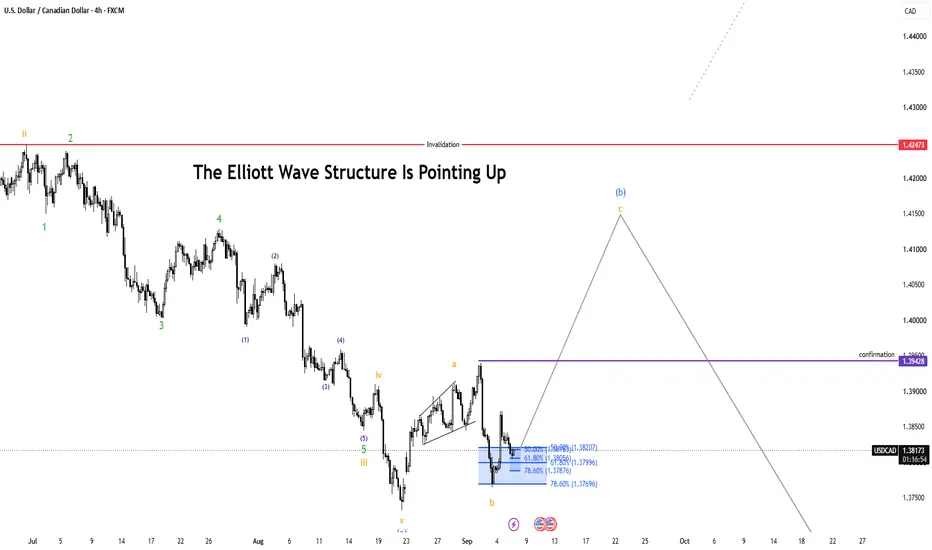
🇪🇺🇨🇭 EURCHF | 6H USDCAD – Potential Wave B / Wave 3 Upside SetupOn the higher timeframe (Daily) , the primary expectation is that USDCAD is developing a larger WXY correction to the downside.
Wave W and Wave X appear to be completed, with the market now developing Wave Y to the downside.
The structure also leaves room for an alternative count, where the WXY-pattern may have already been completed earlier. In this scenario, the current decline could represent a Wave 2, with a potential Wave 3 to the upside still ahead.
Interestingly, both scenarios currently point towards the same near-term direction: higher .
On the lower timeframe (4H) , Wave (a) of the current downside move developed as a clear five-wave impulse , with a strongly extended Wave iii- subwaves shown in green.
Following the completion of the impulse down, price formed a leading diagonal, marking the beginning of the new move to the upside. After this first move a small term correction has to happen and price has already shown a notable reaction from the relevant Fibonacci levels, giving us additional confluence for a potential continuation higher.
A first confirmation level for bullish price action is located at 1.38729. A break above this level would strengthen the case that the current corrective structure has completed and that the next move higher is beginning.
The key invalidation level for the primary count remains at 1.42473, the high of Wave X (highest degree).
The good part is that the alternative count would also support further upside from the current area. This means the exact count does not necessarily need to be resolved immediately. Both scenarios currently support the same directional bias.
Additional confluence comes from our current DXY structure, which also supports the bullish USD/CAD scenario.
This is a scenario based on structure and confirmation. The count remains subject to change if the market invalidates the current structure.
Nifty Elliott Wave Analysis | 15 Sep – 30 Sep 2026Wrap-up:-
As discussed in my previous Mid-Term NIFTY Analysis (Weekly Chart published on 11 July 2026 ), the market continues to trade within Wave Y of Wave X of the larger Major Wave 4 corrective structure .
Within Wave Y, Wave A concluded at 24,601, while Wave B is currently unfolding.
Based on the latest price structure, Wave B appears to be developing as an WXY Irregular Correction.
The internal structure is currently interpreted as follows:
Internal Wave W of Wave B completed at 23,070.
Internal Wave X is currently unfolding.
Within this Internal Wave X :
Internal Wave A concluded at 24,261.
Internal Wave B is currently unfolding.
Within this Internal Wave B :
Internal Wave W concluded at 24,606.
Internal Wave X concluded at 24,774.
Internal Wave Y is approaching completion and will be considered confirmed only after NIFTY registers a decisive breakout and sustains above 23,820 .
Upon confirmation of Internal Wave Y , the market is expected to transition into Internal Wave C , with a projected upside objective in the 25,500-25,900 Range .
What I'm Watching | 15 Sep – 30 Sep 2026
The immediate focus remains on the completion and confirmation of Internal Wave Y .
If the current Elliott Wave count remains valid and NIFTY sustains above 23,820 , it would increase the probability of Internal Wave C commencing.
Historically, Wave C often develops as the strongest and most directional leg within an ABC corrective sequence, making this an important phase to monitor.
A sustained move above the identified resistance levels would further strengthen the bullish outlook.
Key Levels to Watch
Immediate Resistance: 23,820
Minor Resistance: 24,184-24,311 Range
Major Resistance: 24,772-25116 Range
Bullish Projection: 25,500–25,900 (subject to wave confirmation)
Trend Bias: Bullish, unless the current Elliott Wave structure is invalidated.
Professional View:
The broader Elliott Wave structure continues to favour a bullish outlook, provided the current wave count remains valid. While short-term volatility may persist during the completion of Internal Wave B , a decisive breakout above 23,820 would significantly improve the probability of an impulsive advance toward the 25,500–25,900 region.
As always, confirmation through price action should take precedence over anticipation. Traders should monitor key validation levels, remain flexible if the wave structure changes, and apply disciplined risk management.
Disclaimer: This analysis reflects my personal interpretation of the market using Elliott Wave Theory and is shared strictly for educational purposes only. It should not be considered financial or investment advice.
"Don't predict the market. Decode it."  Long
Long
 Long
Long
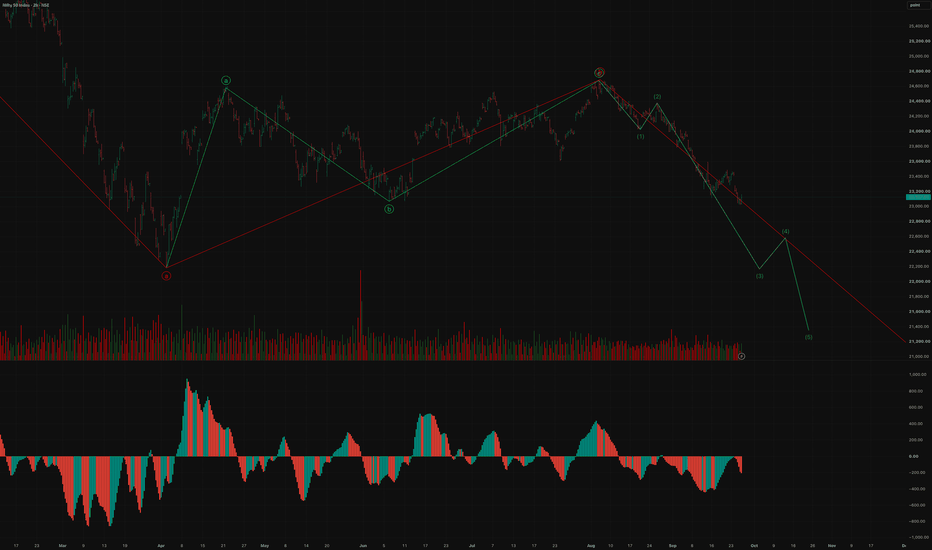
NIFTY 50 – Elliott Wave Bearish StructureNIFTY 50 appears to have completed a larger corrective ABC structure:
A → B → C
The C wave appears to have completed near the 24,700–24,800 zone, followed by the start of a new 5-wave impulsive decline.
Current structure:
(1) → (2) → (3) → (4) → (5)
Wave (1) and wave (2) appear to be completed, and the market is currently developing wave (3) on the downside.
Projected structure:
Wave (3) → around 22,200
Wave (4) → possible retracement toward 22,600
Wave (5) → projected toward 21,100–21,000
The red descending trendline is acting as an important structural resistance. As long as NIFTY remains below this trendline and continues forming lower highs and lower lows, the bearish Elliott-wave structure remains valid.
The projected wave (3) target around 22,200 is the immediate level to watch. A corrective wave (4) bounce from that zone could then provide the next setup for wave (5) toward the 21,000–21,100 region.
A sustained move back above the recent major high around 24,700–24,800 would invalidate this bearish wave interpretation and indicate that the current count needs to be reassessed.
Idea Rating: 8.8/10
Disclaimer: This analysis is for educational purposes only and is not financial advice. Elliott Wave counts are subjective and can change as price develops. Projected targets and wave structures are not guaranteed. Trading and investing involve significant risk. Independent verification and proper risk management are essential before making any trading decision.
Short