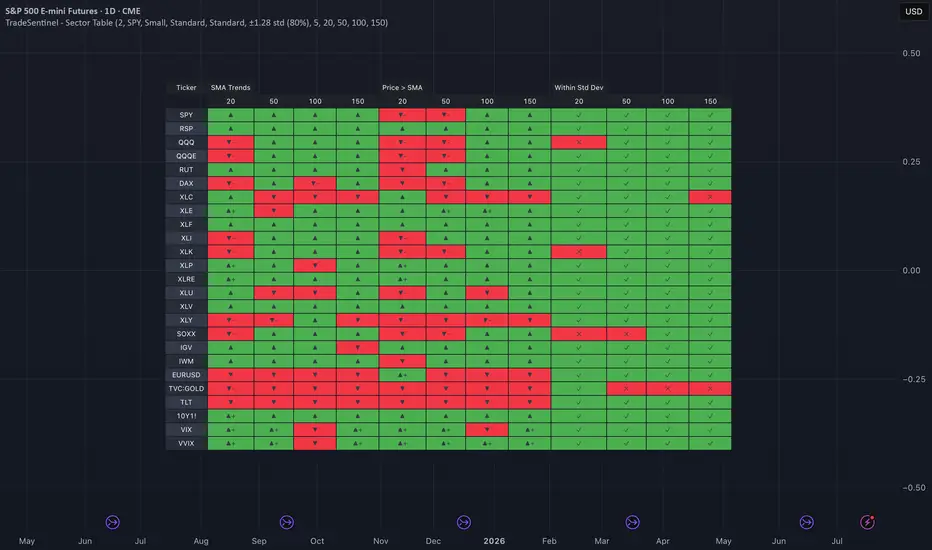
Sector View: Rotation, Not Breakdown--- TradingView Chart Processed by TradeSentinel AI ---
Markets finally showed a meaningful shift beneath the surface. While the headline indices softened, the internal picture is less about broad weakness and more about capital rotating away from mega-cap growth into a wider group of sectors.
1️⃣ Where is capital actually flowing?
Financials, Industrials, Energy, Health Care, Equal Weight indices and Small Caps continue to hold up better than the large-cap technology leaders.
Market breadth
Breadth remains constructive. Leadership is expanding beyond the handful of stocks that dominated the first half of the advance.
2️⃣ What matters
Equal Weight continues outperforming cap-weighted indices.
Small Caps remain resilient.
Financials and Industrials are becoming increasingly important leadership groups.
Mega-cap Technology is no longer the only engine driving the market.
3️⃣ What is mostly noise
One week of weakness in the headline index.
Daily swings in AI leaders.
Short-term pullbacks that occur while the broader trend and sector rotation remain intact.
4️⃣ TradeSentinel Takeaway
The healthiest bull markets evolve through rotation, not perfection. Rather than chasing yesterday's leaders, focus on where relative strength is quietly emerging. A broadening market offers more opportunities for momentum systems than a narrow rally driven by only a handful of stocks. The objective is to follow expanding leadership, not yesterday's narrative.
--More details---
SPY remains structurally healthy across the intermediate and long-term trend despite short-term weakness.
RSP continues to look healthier than the cap-weighted index, suggesting equal-weight participation remains constructive.
QQQ weakened noticeably over the short term, while QQQE remains comparatively stronger, implying mega-cap technology has lost momentum relative to broader technology.
Russell 2000 (RUT/IWM) continues to hold constructive trends and hasn't broken its broader structure.
Most notable deterioration:
QQQ
XLK
XLY
Communication Services
The market is rotating rather than collapsing.
Losing Relative Strength
QQQ/SPY
XLK/SPY
XLC/SPY
XLY/SPY
Mega-cap growth is no longer carrying the market.
Technology is fragmenting.
Equal-weight tech looks healthier.
Mega-cap tech has weakened.
Software and semiconductors remain constructive but have lost some momentum.
Leadership is broadening away from a handful of large-cap names.
Sector Rotation
Capital appears to be rotating toward:
Financials
Industrials
Energy
Defensive growth
Broader market participation
rather than concentrating exclusively in AI and mega-cap technology. Weekly Review: Acceptance (with emerging short-term stress)--- TradingView Chart Processed by TradeSentinel AI ---
The primary regime remains Acceptance, but this week introduced the first meaningful signs of internal pressure after several weeks of healthy participation.
The evidence is not yet consistent with structural deterioration, but it is no longer a one-sided expansion.
1️⃣ What is it today?
The market remains in an Acceptance regime, but this week introduced the first meaningful signs of internal fatigue. Price pulled back, volatility picked up, and short-term participation narrowed, while the long-term structure remains intact.
2️⃣ Thesis
This looks more like a healthy cooling phase than a structural breakdown. Long-term breadth remains strong and volatility is still below the stress threshold, but momentum has become more selective. Leadership is narrowing, particularly within the Nasdaq.
3️⃣ What validates the thesis?
VIX/VIX3M remains below 1.0, indicating no confirmed stress regime.
Around two-thirds of S&P 500 stocks remain above their 200-day moving averages, supporting the longer-term trend.
NYSE new highs continue to outnumber new lows.
The broader uptrend is still intact despite the weekly decline.
4️⃣ What invalidates the thesis?
VIX/VIX3M rising above 1.0 and remaining there.
Continued contraction in stocks above their 20-day averages.
Nasdaq leadership deteriorating further, with expanding new lows.
Multiple weeks where price advances but breadth continues to weaken.
-----
Trade Implications
Lean Into
Existing leaders that continue holding above key moving averages.
Stocks showing independent relative strength despite the broader pullback.
Strong trends that are consolidating rather than breaking.
Watch Closely
Whether Nasdaq breadth begins repairing over the coming week.
Whether VIX/VIX3M falls back below ~0.85, indicating renewed volatility normalization.
Expansion in new highs after this pullback.
Risk Signals
A sustained move of VIX/VIX3M above 1.0.
Continued deterioration in % of stocks above the 20-day moving average.
Nasdaq new lows continuing to expand while price attempts new highs.
Current Bias
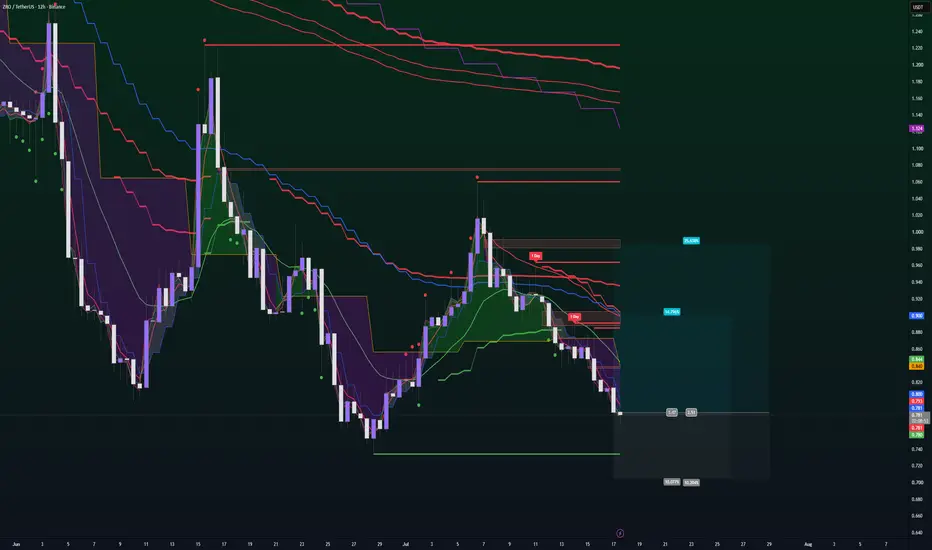
This remains a buy-the-pullback environment, but with greater selectivity than in recent weeks. Position sizing should reflect the increase in short-term uncertainty until breadth begins to improve again. ZRO LONG — 12H ALMA Setup (WR 78%)█ SETUP
BINANCE:ZROUSDT · 12H · long only.
(Context: LayerZero — cross-chain / infra beta; trades with alt liquidity and bridge-narrative flows.)
ALMA Averaging Strategy: ALMA 3 / σ2, SD band 2, min diff 6 bars to add / 3 bars to exit, 25% per bar, up to 4 adds, hard stop −10% from average entry.
Strategy Tester (ZRO 12H):
Win rate 78% · profit factor 3.4 · max drawdown 13%
Avg winning trade +21.9% · avg losing trade −9.8%
Typical hold ~19×12H bars on winners — infra / bridge mean-reversion grid · 40-trade sample
═
█ WHY NOW
Friday 12-hour cluster — two ALMA long lots on the same 78% WR template:
· 17 Jul 00:00 UTC ~ $0.813
· 17 Jul 12:00 UTC ~ $0.784 (second add · pyramid 2 of 4)
Working blend ~ $0.7985 . Bar-close scale-in into the BTC risk-off wash — not a discretionary LayerZero roadmap trade.
Hard stop zone −10% from blended average ~ $0.719 . Exits follow Pine ALMA flip + min diff or the hard stop.
═
█ MACRO
Sector: ZRO = LayerZero omnichain messaging / OFT rails — beta to bridge volume, alt liquidity, and interoperability share vs Chainlink CCIP / Wormhole / Axelar.
Fundamental (30d → 18 Jul): Partnerships still Bid — Robinhood Chain named LayerZero as native cross-chain bridge (01–02 Jul · ZRO +~10% 24h); 14 Jul LayerZero Labs joins Linux Foundation x402 as General Member (AI-agent payments). Competitive overhang: >$7.2B announced migrations LayerZero → Chainlink CCIP since May · Mantle Super Portal (~$2.5B MNT) OFT→CCT Jul 9–15. Reputation tape: Bonzo/Hedera exploit loot bridged via LayerZero (11 Jul · not a protocol bug) · Executor-wallet scare then clarified as routine ops (15 Jul). Supply: ~25.71M ZRO unlock ~20 Jul (~2.6% supply · ~$24M notional). Price path in window: ~$0.735 (28 Jun) → ~$1.01 early Jul → ~$0.78–0.81 into fills.
Tape (17 Jul): Bitcoin under ~$62.5K on Iran / US-equities pressure — alt/infra beta soft with BTC; unlock day is still ahead of the fill cluster.
Window read: mixed — Robinhood + x402 +, CCIP exodus + unlock + security headlines + macro beta −.
Execution is 12H ALMA at the ~$0.78–0.81 cluster — not a roadmap, migration, or unlock forecast.
═
█ OUTLOOK
Positive factors
- 78% WR · PF 3.4 · avg win +21.9% vs avg loss −9.8% · ~19×12H bars — solid payoff skew in a 40-trade sample
- Fresh twin adds inside the 24h window on the same Averaging template
- Fundamental — partnership stack: Robinhood Chain native-bridge narrative + x402 Foundation membership keep the long-cycle infra story alive under the wash
- ALMA — 4H / 1D stretch below: 4H Signal SHORT · S:4 vs SAvg:3.5 · OVERHEAT-S · 1D Signal SHORT · S:10 vs SAvg:4.0 · OVERHEAT-S — time stretched below the band into the add (mean-reversion fuel)
- EMA — below-session stretch: 1H Below · 1H Cur S:49 vs Avg S:6.5 · +1.4% dev · 4H Below · 4H Cur S:36 vs Avg S:13.5 · +7.7% · 3D Below · 3D Cur S:31 vs Avg S:9.8 · +42% — sell-time overheated on the execution ladder
- SMC — demand at the add: 4H FVG Raid Bull ~ $0.784 (17 Jul) — bid-side tag on the second fill print
- 1W EMA deep Below: 1W Cur S:109 · +115% stretch — slow mean still far overhead; discount context for the 12H grid
Negative factors
- Fundamental — CCIP share loss: >$7.2B migrations to Chainlink · Mantle portal exit — market-share / OFT narrative headwind into any bounce
- Supply calendar: ~25.71M ZRO unlock ~20 Jul (~2.6% supply) sits inside a typical ~19×12H hold — vesting overhang before “Zero” L1 narrative (fall 2026)
- Reputation tape: Hedera loot routed via LayerZero + mid-Jul Executor scare (later clarified) keep bridge-risk headlines sticky
- ALMA — slow grids not fully stretched: 3D Signal SHORT · S:3 vs SAvg:4.1 — young below-session on the 3D clock; bounce may not be mature there
- EMA — daily below still young vs average: 1D Below · 1D Cur S:9 vs Avg S:13.8 · +13.9% — daily sell-time not overheated yet; downside can extend before mean-reversion completes
- SMC — daily bull FVG referenced higher: 1D FVG Enter Bull ~ $0.821 — demand pocket sits above spot; reclaim needed for a clean expansion
- PA: HTF bear FVG formed + fractal low broken — two-way housekeeping, not a clean one-way reclaim
- 12H bars can gap on geo / BTC headline risk — stop slippage on BINANCE spot
- Past backtest ≠ live fills; 40-trade sample is thin vs large-cap equity templates
Takeaway: the 12H ALMA strategy and 78% WR skew support the long into a stretched 4H/1D short-phase band, and Robinhood/x402 keep a constructive partnership floor — but CCIP exodus, the ~20 Jul unlock, young 1D/3D below-sessions, and weekly bear OB near ~$0.775 cap upside — net read is a strategy-backed mean-reversion grind into a mixed fund + risk-off window, not a clean multi-TF reclaim; nominal risk stays on the −10% hard stop / Pine exit path.
Base case: 12H ALMA holds · 4H/1D OVERHEAT-S mean-reverts · drift toward the ~$0.82 daily FVG shelf if alt-beta stabilises with BTC after the unlock print.
Bear case: fail 12H ALMA · unlock / CCIP headlines extend · weekly bear OB ~$0.775 reasserts · −10% from ~$0.7985 blend toward ~$0.719 · BTC geo headline whipsaw through the spot book.
Chart: BINANCE:ZROUSDT 12H — ALMA Averaging Strategy.
Educational idea. Live position — past backtest ≠ future results. NFA.  Long
Long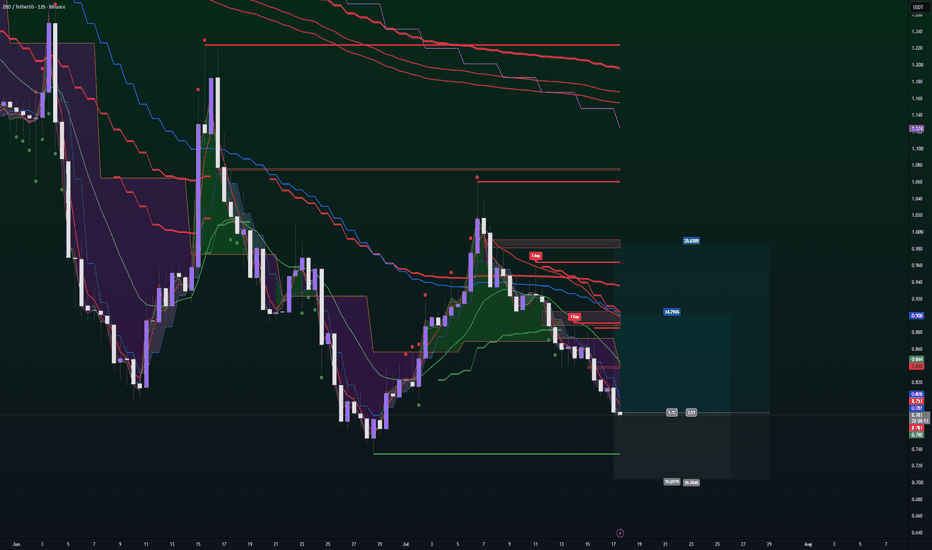
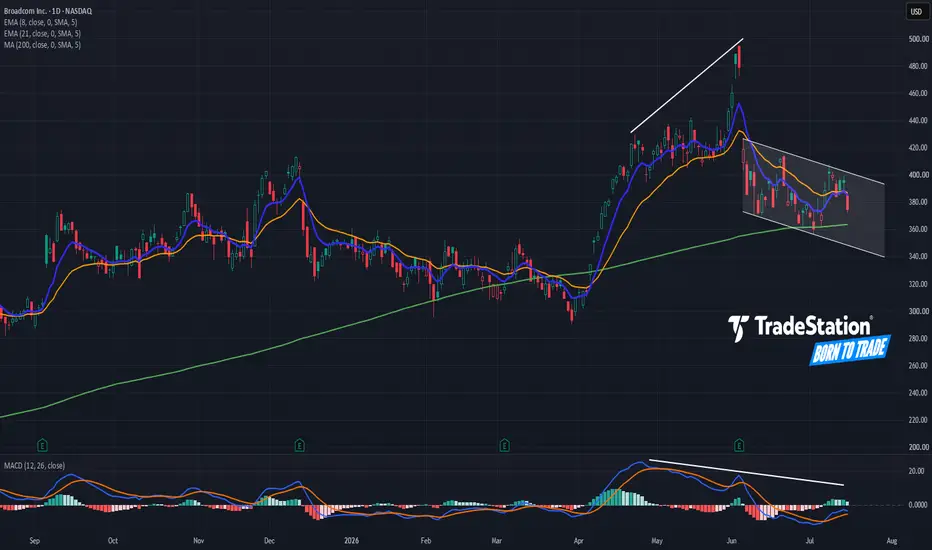
Broadcom May Be SlidingBroadcom began last month with a sharp selloff, and some traders may see further downside in the chip giant.
The first pattern on today’s chart is the June 4 drop following quarterly results. AVGO has remained entirely below that gap since, so it may represent a bearish reversal.
Second, the stock has made lower lows and lower highs since the decline. Does the resulting channel mark a new downtrend?
Third, falling MACD may reflect weak momentum. It also created potentially bearish divergence in June, failing to confirm new highs on the price chart.
Fourth, the 8-day exponential moving average (EMA) has stayed under the 21-day EMA. That may reflect a short-term downtrend.
Next, prices recently bounced at the 200-day simple moving average. Closing under that line could signal a longer-term breakdown.
Finally, AVGO is an active underlier in the options market. (Its average daily volume of 275,600 ranks 15th in the S&P 500, according to TradeStation data.) That could help traders take positions with calls and puts.
TradeStation has, for decades, advanced the trading industry, providing access to stocks, options and futures. If you're born to trade, we could be for you. Learn more here about TradingView’s Broker of the Year!
Past performance, whether actual or indicated by historical tests of strategies, is no guarantee of future performance or success. There is a possibility that you may sustain a loss equal to or greater than your entire investment regardless of which asset class you trade (equities, options or futures); therefore, you should not invest or risk money that you cannot afford to lose. Online trading is not suitable for all investors. View the document titled Characteristics and Risks of Standardized Options at www.TradeStation.com . Before trading any asset class, customers must read the relevant risk disclosure statements on www.TradeStation.com . System access and trade placement and execution may be delayed or fail due to market volatility and volume, quote delays, system and software errors, Internet traffic, outages and other factors.
Securities and futures trading is offered to self-directed customers by TradeStation Securities, Inc., a broker-dealer registered with the Securities and Exchange Commission and a futures commission merchant licensed with the Commodity Futures Trading Commission). TradeStation Securities is a member of the Financial Industry Regulatory Authority, the National Futures Association, and a number of exchanges.
Options trading is not suitable for all investors. Your TradeStation Securities’ account application to trade options will be considered and approved or disapproved based on all relevant factors, including your trading experience. See www.TradeStation.com . Visit www.TradeStation.com for full details on the costs and fees associated with options.
Margin trading involves risks, and it is important that you fully understand those risks before trading on margin. The Margin Disclosure Statement outlines many of those risks, including that you can lose more funds than you deposit in your margin account; your brokerage firm can force the sale of securities in your account; your brokerage firm can sell your securities without contacting you; and you are not entitled to an extension of time on a margin call. Review the Margin Disclosure Statement at www.TradeStation.com .
TradeStation Securities, Inc. and TradeStation Technologies, Inc. are each wholly owned subsidiaries of TradeStation Group, Inc., both operating, and providing products and services, under the TradeStation brand and trademark. When applying for, or purchasing, accounts, subscriptions, products and services, it is important that you know which company you will be dealing with. Visit www.TradeStation.com for further important information explaining what this means. (If) 62.5k Holds Again — Eyes Back on 65kHey traders!🌴
After yesterday’s failed attempt to establish itself above 65k, Bitcoin started a correction, initially not very convincingly but gradually gaining momentum 🔪
Yesterday I warned:
“If the correction gains momentum and starts breaking below both the 4H EMA 200 and EMA 100, the key support levels remain unchanged:
- 62,500 — Key support level where price has been consolidating since early June ✅
- 60,800 — Local horizontal support
- 60,000 — Strong horizontal support”
Unfortunately for the bulls, Bitcoin did break below both the 4H EMA 200 and EMA 100, activating this bearish scenario and correcting all the way to the first key support at 62,500 ✅, where it has since produced a fairly confident bounce.
🐻🪓 As long as I continue to see this type of reaction and no confirmed break below 62,500, I do not expect the correction to extend toward 60,800 or 60,000.
🦬🚀 Moreover, if Bitcoin manages to hold the current level during today’s U.S. session, I expect another attempt to reclaim the 65k level in the very near term.
Peace everyone 🌄  Long
Long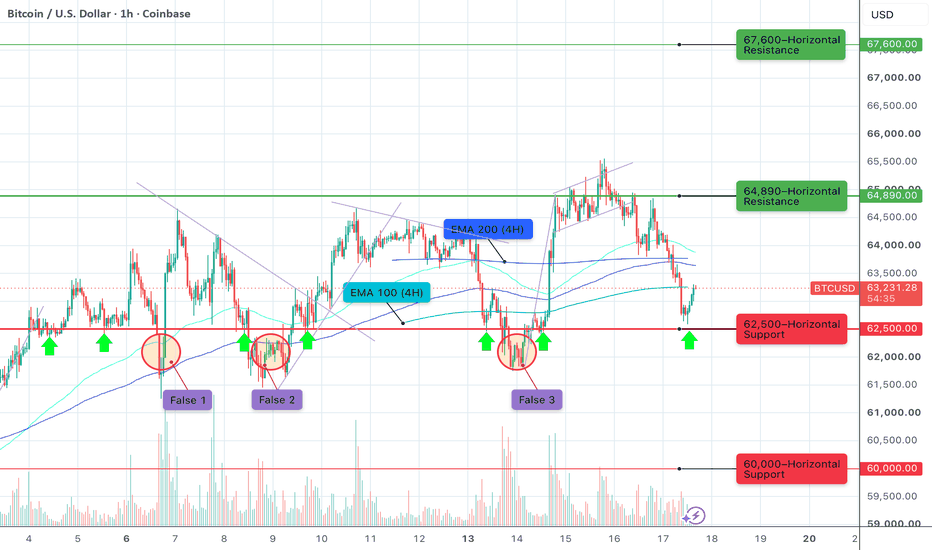
 Long
Long
 Long
Long
EUR/USD Holding Intact Despite Soft Inflation and Oil SpikeEUR/USD probed the top of its monthlong range on Wednesday, closing at a three-week high just below 1.1470, before easing back under 1.1450 through Thursday's U.S. session. The pair has largely absorbed this week's softer inflation prints and shrugged off the initial lift they provided, leaving it hemmed inside the roughly 1.1350 to 1.1450 band that has contained it for about a month. Rather than pressing the upside, EUR/USD has drifted back toward the middle of the range as the Dollar reasserts a firm tone.
The fundamental backdrop has quietly shifted beneath the price action. This week's CPI and PPI both landed below expectations, softening the near-term inflation picture, but a fresh climb in oil has since begun to overshadow those misses. Heightened geopolitical tension, with U.S. strikes against Iran intensifying and Brent pushing above $85, has revived inflation concerns and firmed the case for further tightening, while also lending the Dollar a safe-haven bid. The same oil shock cuts the other way for the Euro, weighing more heavily on Eurozone growth prospects given the region's reliance on imported energy. With the Fed and ECB otherwise viewed in broadly similar positions, that asymmetry in how the two economies absorb the oil move has been enough to keep the Dollar supported and the Euro capped.
In the above chart, EUR/USD rates continue to respect a monthlong consolidation, with ~1.1450 reasserting itself as former support turned resistance. Wednesday's close just under 1.1470 marked a brief peek above that hurdle, but the failure to hold there and the subsequent slip back below 1.1450 leaves the range unbroken and the breakout unconfirmed. Within the holding pattern, short-term traders can watch the 20-day EMA (exponential moving average), sitting right at today's low, to gauge whether it holds as near-term support. A decisive push through 1.1470 would reopen the path toward 1.16, while a move below 1.1350 would validate what is shaping up as a bear flag and shift focus to the downside. With no major data due between now and next week's ECB meeting, geopolitical developments may prove the most likely catalyst to break the pair out of its range.  Long
Long
Sandisk (SNDK) LONG — 1D ALMA Setup (WR 85%)█ SETUP
Sandisk · BATS:SNDK · 1D · long only.
ALMA Averaging Strategy: ALMA 3 / σ2, SD band 2, min diff 1/1, 25% per bar, up to 4 adds, hard stop −10% from average entry.
Strategy Tester (SNDK 1D):
Win rate 85% · profit factor 14.1 · max drawdown 38%
Typical hold ~17×1D bars on winners · high-payoff memory-name mean-reversion template
═
█ WHY NOW
Tuesday US cash close — fresh 1D ALMA long on 08 Jul 13:30 UTC ~ $1,618 .
First lot on the daily template after a sharp drawdown from the June highs — storage/memory beta on a bar-close signal, not an AI-headline chase. Snapshot ~ $1,657 on the 08 Jul board (~+2.4% from fill).
Hard stop zone −10% from entry ~ $1,456 . Exits follow Pine ALMA flip + min diff or the hard stop.
═
█ MACRO
Sector: SNDK = SanDisk · NAND flash / enterprise SSD · WDC spin-off (2025) — AI data-center storage and the NAND shortage thesis (Micron tight supply, multi-year LTAs with price floors), not GPU silicon.
Tape (Jun–8 Jul): Mixed supercycle → reset — June +~34% on Micron FQ3 blowout (25 Jun) and PT hikes (Citi $2,500, Bernstein $3,000, BofA $2,500, Goldman $2,200); early July sentiment reversal — Meta Compute oversupply scare (01–02 Jul, SNDK −~14%) and Samsung sell-the-news (06–07 Jul) erased most June gains (−31% from the June peak by 07 Jul). Analysts still cite ~$42B contracted backlog and LTAs — but late-window tape is profit-taking / glut narrative, not a fresh upgrade chase.
Near-term: SK Hynix (SKHY) Nasdaq listing (~10 Jul) — competition for US AI-memory flows; FQ4 earnings (~13 Aug, confirm IR) — NAND ASP / LTA guide.
Execution is 1D ALMA on the post-unwind bar (~$1,618 after the July flush), not an earnings preview or chase into June highs.
Book note: a separate 4H VWAP long from 02 Jul (~$1,759) remains underwater — this publish tracks only the fresh 1D ALMA lot.
═
█ OUTLOOK
Positive factors
- 85% WR · PF 14.1 — rare payoff skew on a 40-day US equity sample
- Fresh daily entry inside the 24h publish window — first bar on the high-WR template
- ALMA — daily stretch (fuel): 1D SHORT · S:5 vs SAvg 2.4 OVERHEAT-S — time below the daily band exceeds norm · MR fuel on the crash, not «SHORT = bearish»
- ALMA — execution ladder: 1H LONG · L:3 · 4H LONG · L:1 at the band — fast boards aligned with the new daily long · 15m S:1 first bar below fast ALMA (touch, not chase)
- EMA — overheated below (fuel): 1H Cur S:29 vs Avg S:6.7 · +4.5% dev — stretched below-session on the fast ladder after the July flush
- SMC — at the fill ~$1,618: 4H FVG Raid Bull bull-event bounce B 63.4% Br36.6% (n=71) · 1D raid B 68.4% Br31.6% (n=19) — close ≥ ref follow-through at the entry print · aligns with 1D ALMA long
- SMC — 4H: OB Enter Normal Bull @ ~$1,618 · bounce B55.6% Br44.4% (n=9) — bid-side structure at fill
- TL AI — Support Break 06 Jul: bounce B 81% Br19% (n=47) — elevated post-break bounce history on SNDK; supports the MR template despite the TL label
- Scoring: long +31.3 vs short −21.3 on the snapshot board
Negative factors
- EMA — young below (execution TF): 1D Cur S:4 vs Avg S:7.7 · +9.0% dev — below-session not yet overstretched on the daily chart; selloff can extend before the 1D ALMA band works
- EMA — overheated above (slow charts): 3D Cur L:78 vs Avg L:2.3 · −15.4% dev — long above-session on slow EMA after the June spike · giveback / coil risk even with price back near the line
- EMA — weekly crash context: 1W Above · L:23 · −51.2% dev — extreme unwind from the YTD memory rally; gap risk on headline opens
- ALMA — slow boards young: 3D/1W both SHORT · S:2 ≈ SAvg ~2.1 — higher-TF below-band time not stretched yet vs the overheated 1D read
- SMC — overhead ~$1,745 (02 Jul bull FVG): prior June shelf · bull-event bounce B 81.3% Br18.8% (n=16) — first test is a reaction zone, not a free pass; 06 Jul bear FVG formed/filled adds fresh supply into the same area
- Gap risk on memory-sector headlines — −10% stop can slip on the US open
Takeaway: the 85% WR daily template, 1D ALMA OVERHEAT-S, 1H below-EMA stretch, and SMC/TL bounce at ~$1,618 align with a post-crash MR entry — but 1D young below-EMA and 3D overheated above-time cap the first leg; exit path remains Pine / −10%, not a chase back to ~$1,745 without ALMA/EMA cooperation.
Base case: 1D ALMA holds ~$1,618–1,680 · 1H/4H long boards hold · slow grind toward prior supply ~$1,745 if memory sentiment stabilizes.
Bear case: lose daily ALMA · 1D young below extends · 4H liquidation flush · −10% toward ~$1,456 from ~$1,618 entry.
Chart: NASDAQ:SNDK 1D — ALMA Averaging Strategy.
Educational idea. Live position — past backtest ≠ future results. NFA.  Long
Long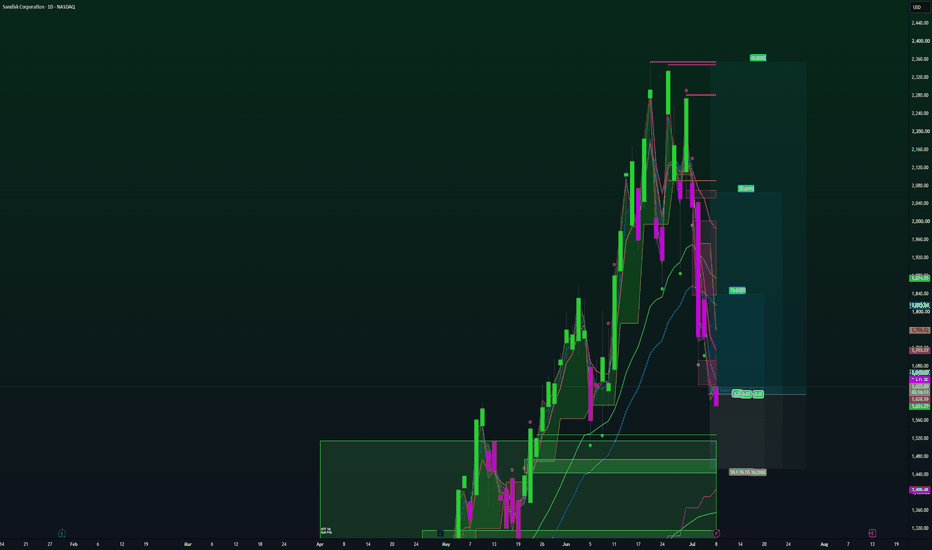
USA Rare Earth (USAR) LONG — 12H ALMA Setup (WR 77%)█ SETUP
NASDAQ:USAR · 12H · long only.
(Context: USA Rare Earth — Round Top TX mine-to-magnet · NdFeB magnets · US critical-minerals chain.)
ALMA Averaging Strategy: ALMA 3 / σ2, SD band 2, min diff 1/1, 25% per bar, up to 4 adds, hard stop −10% from average entry.
Strategy Tester (USAR 12H):
Win rate 77% · profit factor 2.6 · max drawdown 22%
Avg winning trade +33.8% · avg losing trade −8.9%
Typical hold ~15×12H bars on winners — US small-cap mean-reversion grid on the rare-earth sleeve
█ WHY NOW
Wednesday US cash close — fresh 12H ALMA long on 09 Jul 13:30 UTC ~ $18.43 .
First lot on the template after a brutal June unwind (−23% on the month per tape) and a fresh regulatory headline week — bar-close on the 12H ALMA sleeve, not a CHIPS-deal chase into the spring highs.
Hard stop zone −10% from fill ~ $16.59 . Exits follow Pine ALMA flip + min diff or the hard stop.
═
█ MACRO
Sector: USAR = Western rare-earth / critical minerals — Round Top (TX) → Wheat Ridge hydromet demo → Blacksburg SC magnets (target 2028). Policy tailwind (Commerce agreements, US govt equity stake) vs execution and dilution risk on a pre-revenue buildout.
Tape (Jun–9 Jul): June −23% on share-overhang narrative, China export-control list (22 Jun), Russell benchmark exit (forced selling), and MP Materials trade-secrets lawsuit escalation. 6–7 Jul: Senate Democrats probe the ~$1.6B Commerce placement / Cantor Fitzgerald role — shares −7–8% on the inquiry. Offset in-window: Wheat Ridge hydromet demo commissioned 15 Jun with first separated oxides targeted Q3 2026.
Execution is 12H ALMA on the post-selloff bar (~$18.43), not a Q3 oxide-catalyst preview or policy headline chase.
═
█ OUTLOOK
Positive factors
- 77% WR · PF 2.6 on a 95-day 12H US equity sample — workable skew for a volatile small-cap template
- Post-crash MR frame: June −23% + early-July probe selloff leaves price ~$18–19 vs 52-week span $10.50–$43.98 — selloff context for a mean-reversion sleeve, not a breakout chase
- Wheat Ridge Q3 2026 oxide milestone (15 Jun commissioning) — one operational proof point in the window if execution stays on schedule
- US critical-minerals policy support (Commerce / CHIPS equity path) — sector beta for Western REE names even when tape is messy
- Hard −10% stop from ~$18.43 (~$16.59) caps nominal script risk on the first leg
Negative factors
- Regulatory / legal overhang: Warren-led probe (6 Jul) + China export-control symbolism (22 Jun) — headline gap risk on US opens
- Russell exit-driven selling and S-3 share-overhang narrative still in recent tape — float pressure can extend below the first ALMA add
- MP Materials lawsuit / IP narrative — distraction and competitive noise in US magnet supply chain
- Pre-revenue, capital-intensive buildout — commercial magnet scale and Round Top PFS (~end 2026) not yet in hand
- Sparse live factor board on USAR in the desk snapshot batch — no fresh EMA/ALMA/VWAP/SMC rows to confirm discount stretch at paste time; technical confirmation lags the equity headline read
- Single first lot — no averaged discount yet if the 12H bar extends lower before adds qualify
- Small-cap gap risk — −10% stop can slip on a policy headline open
Takeaway: the 77% WR 12H template and post-June selloff context support a disciplined MR long at ~$18.43, but regulatory probe noise, index exit selling, and missing fresh technical board data cap conviction — script-backed bounce sleeve vs headline overhang, not a clean rare-earth breakout; nominal risk stays on −10% / Pine exit.
Base case: 12H ALMA holds ~$17.50–19.50 · headline noise fades into range · slow grind if Wheat Ridge Q3 narrative stays intact.
Bear case: lose 12H ALMA · probe headlines accelerate · China-list symbolism triggers another flush · −10% toward ~$16.59 from ~$18.43 entry.
Chart: BATS:USAR 12H — ALMA Averaging Strategy.
Educational idea. Live position — past backtest ≠ future results. NFA.  Long
Long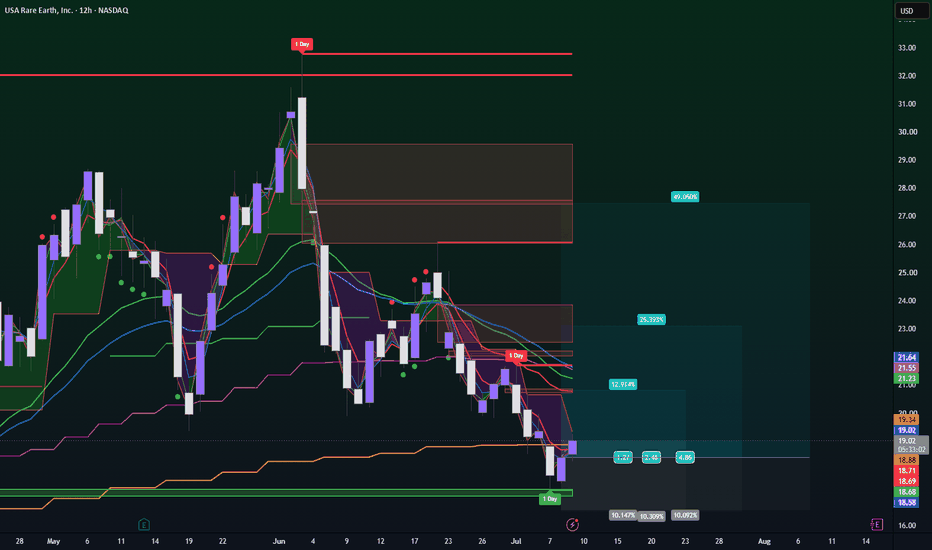
Pre-Earnings Triangle in Tesla Tesla has been struggling all year, and now some traders may see risk of a break to the downside.
The first pattern on today’s chart is the tight range since July 2. The EV giant has made lower highs while remaining above roughly $390.50. That could be viewed as a bearish triangle, with potential for a move lower if support breaks.
Second, TSLA tried unsuccessfully to break its late-2024 high in December before making lower weekly highs. That may be consistent with a longer-term top.
Third, the 50-, 100- and 200-day simple moving averages are close to each other and essentially moving sideways. Could that long-term neutrality morph into bearishness?
Next, some chart watchers may see potential for prices to slide toward the 52-week low below $300.
Finally, TSLA is a highly active underlier in the options market. (Its average daily volume of 2.8 million contracts ranks second in the S&P 500, according to TradeStation data.) That could help traders take positions with calls and puts – especially with earnings due after the closing bell next Wednesday, July 22.
TradeStation has, for decades, advanced the trading industry, providing access to stocks, options and futures. If you're born to trade, we could be for you. Learn more here about TradingView’s Broker of the Year!
Past performance, whether actual or indicated by historical tests of strategies, is no guarantee of future performance or success. There is a possibility that you may sustain a loss equal to or greater than your entire investment regardless of which asset class you trade (equities, options or futures); therefore, you should not invest or risk money that you cannot afford to lose. Online trading is not suitable for all investors. View the document titled Characteristics and Risks of Standardized Options at www.TradeStation.com . Before trading any asset class, customers must read the relevant risk disclosure statements on www.TradeStation.com . System access and trade placement and execution may be delayed or fail due to market volatility and volume, quote delays, system and software errors, Internet traffic, outages and other factors.
Securities and futures trading is offered to self-directed customers by TradeStation Securities, Inc., a broker-dealer registered with the Securities and Exchange Commission and a futures commission merchant licensed with the Commodity Futures Trading Commission). TradeStation Securities is a member of the Financial Industry Regulatory Authority, the National Futures Association, and a number of exchanges.
Options trading is not suitable for all investors. Your TradeStation Securities’ account application to trade options will be considered and approved or disapproved based on all relevant factors, including your trading experience. See www.TradeStation.com . Visit www.TradeStation.com for full details on the costs and fees associated with options.
Margin trading involves risks, and it is important that you fully understand those risks before trading on margin. The Margin Disclosure Statement outlines many of those risks, including that you can lose more funds than you deposit in your margin account; your brokerage firm can force the sale of securities in your account; your brokerage firm can sell your securities without contacting you; and you are not entitled to an extension of time on a margin call. Review the Margin Disclosure Statement at www.TradeStation.com .
TradeStation Securities, Inc. and TradeStation Technologies, Inc. are each wholly owned subsidiaries of TradeStation Group, Inc., both operating, and providing products and services, under the TradeStation brand and trademark. When applying for, or purchasing, accounts, subscriptions, products and services, it is important that you know which company you will be dealing with. Visit www.TradeStation.com for further important information explaining what this means.  Long
Long
BTC: Channel Resistance Holds — Another Leg Down Ahead?Bitcoin continues to respect the bearish channel highlighted in my previous analysis on the 4H timeframe.
What's even more interesting is the internal descending trendline running through the middle of the channel, which has repeatedly acted as both support and resistance, helping define the market's short-term direction.
Price has once again been rejected from the upper boundary of the channel, suggesting the bears remain in control for now.
🐻 Bearish Factors
📉 Bearish Channel Intact
🚧 Rejection from Confluence Resistance Zone
The latest rejection from the channel top increases the probability of another move toward lower support.
🎯 Bearish Scenario
➡️ If sellers maintain control, the first area to watch is the internal trendline support near 61K.
🎯 Target 1: 61K (Mid-Channel Trendline Support)
🎯 Target 2: 57K–58K (Lower Boundary of the Bearish Channel)
A breakdown below the trendline would significantly increase the probability of another test of channel support.
🟢 Bullish Case
Despite the rejection, the bulls have achieved one important milestone.
✅ BTC has reclaimed the 4H EMA200, which now acts as dynamic support for the first time in this correction.
👀 The key question is whether buyers can defend this level and build enough momentum to challenge the descending channel once again.
A successful breakout above the channel would be the first meaningful sign that the current downtrend is losing strength.
❌ Bearish Invalidation
🟢 A decisive breakout above the descending channel, supported by strong volume, would invalidate this bearish thesis and shift the short-term bias back in favor of the bulls.
💡 For now, BTC remains trapped between two key technical forces: the 4H EMA200, which is attempting to support price from below, and the descending channel, which continues to cap every rally. Whichever side breaks first is likely to dictate Bitcoin's next major move. 👀 ONDO LONG — 4H ALMA Setup (WR 90%)█ SETUP
BYBIT:ONDOUSDT.P · 4H · long only.
(Context: Ondo Finance — tokenized Treasuries / RWA rails; trades with alt-beta and institutional DeFi flows.)
ALMA Averaging Strategy: ALMA 3 / σ2, SD band 2, min diff 6 bars to add / 1 bar to exit, 25% per bar, up to 4 adds, hard stop −10% from average entry.
Strategy Tester (ONDO 4H):
Win rate 90% · profit factor 9.1 · max drawdown 1%
Avg winning trade +7.1% · avg losing trade −3.7%
Typical hold ~23×4H bars on winners — RWA perp mean-reversion grid on the tighter template
═
█ WHY NOW
Monday pre-US CPI — twin 4H ALMA strategy longs on the same 08:00 UTC bar:
· 14 Jul 08:00 UTC ~ $0.3076 (two correlated templates · same fill)
Mark ~ $0.3156 (+2.3% MTM). 4H ALMA flipped LONG off the late-week base (~$0.30–0.31) — bar-close on the manipulation-zone shelf.
Hard stop zone −10% from fill ~ $0.2768 . Exits follow Pine ALMA flip + min diff or the hard stop.
═
█ MACRO
Sector: ONDO = RWA / tokenized cash & Treasuries — beta to stablecoin regulation, bank-rail adoption, and alt rotation when BTC holds.
Tape (14 Jul): Softer US inflation print lifted risk assets into the US open; Senate CLARITY Act clock (~24 days / 60 votes) and 78 banking groups lobbying on stablecoin yield (§404) kept the rails-vs-banks fight live. Geo oil / Hormuz tension still capped pure risk-on follow-through — BTC ETF outflows persisted despite the CPI bounce.
Execution is 4H ALMA at ~$0.3076 in the base — not a token-launch or unlock headline trade.
═
█ OUTLOOK
Positive factors
- 90% WR · PF 9.1 · avg win +7.1% vs avg loss −3.7% · ~23×4H bars — strong payoff skew on the primary template (50-trade sample)
- Fresh twin entries inside the 24h window · open MTM already positive
- ALMA — weekly stretch below: 1W Signal SHORT · 1W Cur S:7 vs SAvg:4.1 · OVERHEAT-S — time stretched below the slow band after the spring (mean-reversion fuel into the 4H flip)
- ALMA — execution TF aligned: 4H Signal LONG · 4H Cur L:3 vs LAvg:2.9 — template direction matches the entry bar (early long phase)
- SMC — demand into fill: 1D FVG Enter Bull ~$0.3106 (13 Jul) · 4H OB Enter Normal Bull ~$0.3153 (14 Jul noon) — bid-side tags at the add cluster
- EMA — below-session stretch on 4H: 4H Below · 4H Cur S:12 vs Avg S:9.5 · +1.7% dev — price still under the 4H mean after the bounce start; room vs overhead reclaim
- EMA — fast reclaim: 1H Above · 1H Cur L:5 vs Avg L:8.0 · −0.8% dev — short-term momentum off the $0.30 shelf
Negative factors
- ALMA — LTF overheat above band: 1H / 4H OVERHEAT-L (L above LAvg) — bounce already stretched on execution clocks; poor quality for discretionary adds beyond the script
- ALMA — slow grids still short: 1D / 3D SHORT phase · 1D Cur S:3 vs SAvg:3.5 — daily band not fully flipped; 4H long needs faster-TF follow-through
- SMC — two-way 4H housekeeping: same bar FVG Raid Bear ~$0.3153 alongside bull OB — chop, not clean one-way expansion yet
- TL AI — support break: 13 Jul daily Support Break (2 bars) · B59% Br41% — base case bounce, not confirmed trend reversal
- EMA — slow bear stack: 1D Below · 1D Cur S:26 vs Avg S:16.5 (+4.5% dev) — daily mean still overhead; relief can stall under prior resistance ~$0.32–0.33
- Twin correlated templates at one price — same beta, not diversification
- RWA headline risk: CLARITY / stablecoin-yield headlines can gap 4H perps
- Past backtest ≠ live fills; 50-trade sample is thin vs large-cap equity templates
Takeaway: the 4H ALMA strategy and 90% WR skew support the long off the $0.30 manipulation shelf, but 1H/4H overheat-L plus 1D short-phase ALMA cap upside — net read is a strategy-backed bounce grind, not a clean expansion leg; nominal risk stays on the −10% hard stop / Pine exit path.
Base case: 4H ALMA holds · drift toward $0.32–0.33 resistance if alt-beta stays firm post-CPI · room for one more qualifying add if the template allows.
Bear case: fail 4H ALMA · 1D SHORT ALMA reasserts · −10% from ~$0.3076 toward ~$0.2768 · geo/oil headline whipsaw through the perp.
Chart: BYBIT:ONDOUSDT.P 4H — ALMA Averaging Strategy.
Educational idea. Live position — past backtest ≠ future results. NFA. Short 
Another Rejection at 65KHello, traders!🌴
Yesterday I mentioned:
"Although Bitcoin has been repeatedly testing the 65K area over the past 24 hours, we still haven't seen a convincing close above it. That means it's too early to consider this resistance broken."
As expected, 65K proved to be a tough🪓🪓🪓 level for the bulls and rejected price once again.
As of July 16, Bitcoin has fallen back below this resistance. However, as long as price remains above the 4H EMA 200, currently around 63,800, I view this pullback as nothing more than a pause before another attempt to break above 65K🚀
🧨If the correction gains momentum and starts breaking below both the 4H EMA 200 and EMA 100, the key support levels remain unchanged:
• 62,500 — Key support level where price has been consolidating since early June
• 60,800 — Local horizontal support
• 60,000 — Strong horizontal support
Peace🌅 Long 
Sterling Clears 1.35 as Soft PPI Cracks the DollarGBP/USD rallied around 1% over the past seven hours, clearing both 1.34 and 1.35 within the same session to trade above 1.3550 by Tuesday afternoon. The move puts Sterling up more than 1.5% from this week's lows and marks the highest level since May 12. The pace and breadth of the advance stand out against a backdrop in which the U.S. Dollar largely shrugged off softer CPI data yesterday.
The rally reflects a combination of forces working in Sterling's favor. On the domestic side, fading U.K. political uncertainty has lifted the pound, while on the U.S. side, a softer than expected PPI print has weighed on the Dollar. That second leg is the more notable development: the Dollar had held up reasonably well through June even as both CPI and PPI came in soft, so today's reaction looks like the clearest crack yet in an otherwise resilient Dollar. Whether the move has legs will depend on whether it is underpinned by a genuine shift in the Dollar or simply a burst of political optimism that fades once positioning settles.
In the above chart, GBP/USD has broken decisively higher through 1.35, exposing a fresh range with the next resistance sitting above 1.36. Price has also pulled clear of its major moving averages, which had been clustered around 1.340 and now sit below as potential support. Momentum is firmly to the upside, but the scale of the move warrants some caution: today's range is running at roughly double the pair's average true range (ATR), and with RSI approaching 70 a near-term pullback would not be surprising even if the broader uptrend holds. A single strong session does not confirm a trend, and some consolidation may be needed before the durability of the breakout can be judged.  Long
Long
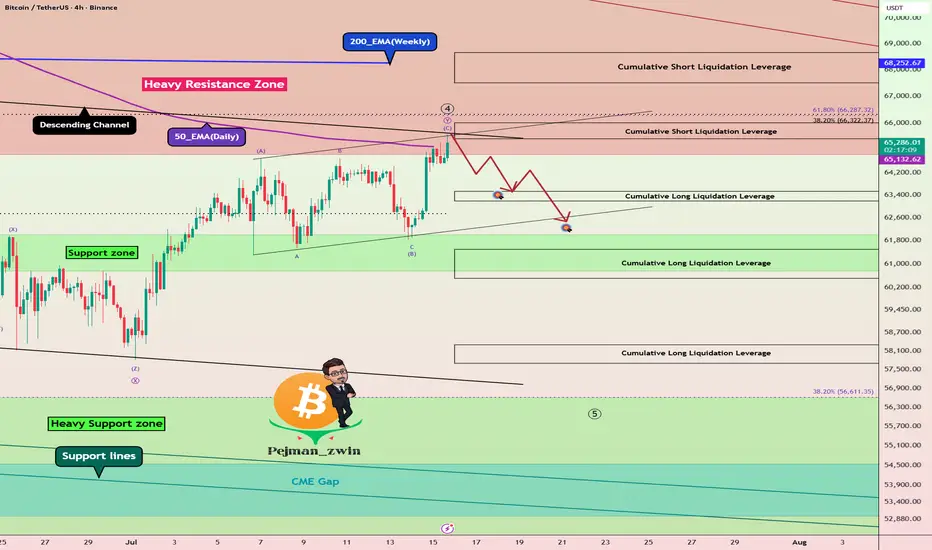
Bitcoin Rebounds After CPI—Can Bulls Reclaim the 200_EMA(Weekly)Yesterday, following the release of the U.S. CPI data , Bitcoin ( BINANCE:BTCUSDT ) rallied alongside Gold ( OANDA:XAUUSD ) and other financial assets. As a result, Bitcoin climbed back toward the heavy resistance zone ($76,600-$64,850), the 50_EMA (Daily), the upper line of the Descending Channel, and the Cumulative Short Liquidation Leverage($66,000-$65,420).
From an Elliott Wave perspective, Bitcoin still appears to be completing sub-wave C of sub-wave Y within the main wave 4. The overall structure of the main wave 4 currently seems to be developing as a Double Three Correction (W-X-Y).
A few moments ago, the U.S. PPI report was released. However, a large portion of its impact had already been priced in after yesterday’s CPI release. In fact, the PPI data mainly confirmed the disinflation scenario rather than providing new information to the market. Therefore, it is reasonable to expect that Bitcoin’s reaction to today's PPI report may not be as strong as yesterday’s reaction to the CPI data.
I expect Bitcoin to resume its bearish move in the coming hours and decline at least toward the Cumulative Long Liquidation Leverage($63,530-$63,180). If Bitcoin breaks the key trading level of $62,800 with strong bearish momentum, we could expect a much deeper correction.
First Target: Cumulative Long Liquidation Leverage($63,530-$63,180)
Second Target: $62,423
Stop Loss(SL): $66,620
Cumulative Short Liquidation Leverage: $68,650-$67,500
Cumulative Long Liquidation Leverage: $61,500-$60,500
Cumulative Long Liquidation Leverage: $58,300-$57,700
Note: One of the most important moving averages to monitor is the 200_EMA(Weekly). Bitcoin is still trading below this moving average, and as long as it fails to close a weekly candle above it, the probability of another bearish move remains high.
Note: A key level Bitcoin must break for further decline is $62,800.
Note: Since global markets are currently sensitive to the Middle East tensions, it's important to monitor geopolitical developments and be even more disciplined with risk management.
What’s your view on Bitcoin? Can it reclaim the 200_EMA(Weekly) and continue its bullish trend, or should we prepare for another correction?
💡 Please respect each other's opinions and express agreement or disagreement politely.
📌Bitcoin Analysis (BTCUSDT), 4-hour time frame.
🛑 Always set a Stop Loss(SL) for every position you open.
✅ This is just my idea; I’d love to see your thoughts too!
🔥If you find it helpful, please BOOST this post and share it with your friends. Short 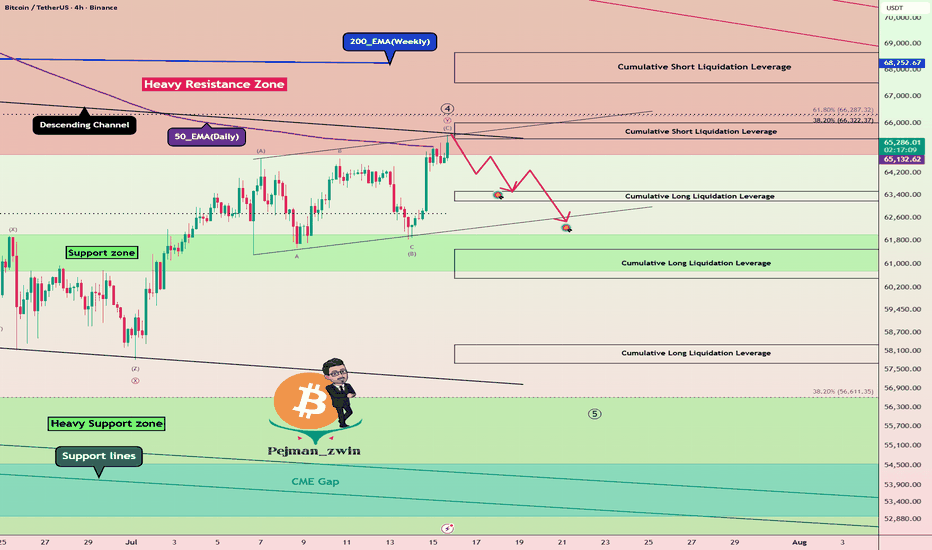
 Long
Long
Above 65K, the Path to 67,600 Is Wide OpenHello, traders!
Let's confirm that all targets from the scenario shared on July 13 have now been reached:
✅ 62,800–63,100 — Cluster of the 1H EMA 100 & EMA 200 and the 4H EMA 100
✅ 63,700 — 4H EMA 200
✅ 64,890 — Strong horizontal resistance formed during February–March 2026
💎With all targets achieved, it's time to define the next upside objective and update the key support and resistance levels.
Although Bitcoin has been repeatedly testing the 65k area over the past 24 hours, we still haven't seen a convincing close above it. That means it's too early to consider this resistance broken.
The main resistance zone remains:
🦬🚀64,890–65,000 — Major horizontal resistance formed during February–March 2026 and confirmed multiple times in June.
If Bitcoin manages to break above this zone and hold it as support, I don't see any significant resistance until the next major target at:
🦬🚀67,600 — Another major horizontal resistance formed during February–March 2026 and confirmed again in June.
🐻🪓Current support levels:
• 62,500 — Key support level where price has been consolidating since early June
• 60,800 — Local horizontal support
• 60,000 — Strong horizontal support
Peace, everyone🌄
⚠️ Disclaimer:
All information shared on this channel is for educational and informational purposes only and is not investment advice. The author is not responsible for your trading decisions. Always manage your risks and make decisions independently. Long