GOLD - The Hunt for Liquidity Ahead of a Decline ICMARKETS:XAUUSD continues to form a countertrend correction, driven by the decline in oil prices. The fundamental backdrop remains weak...
The dollar is stagnating after a strong rally triggered by the Fed’s hawkish stance and rising interest rates. However, the Dollar Index remains strong, which continues to put pressure on gold. At the same time, the decline in oil prices has given the metal some room to recover. The market remains highly dependent on geopolitical developments.
There is not much major news ahead next week, with the key focus on PMI data and Friday’s Durable Goods Orders. Technically, gold remains under pressure from the bearish trend
Resistance levels: 4,402, 4,434, 4,511
Support levels: 4,340, 4,250, 4,200
Gold is forming a countertrend correction. The dollar remains strong, while the fundamental backdrop is unfavorable for gold due to the Fed’s hawkish stance and rising interest rates.
Technically, the key focus is on two triggers: 4,402–4,434. A short squeeze could trigger a decline toward 4,340–4,250
Best regards,
R. Linda!  Short
Short
Gold Technical Analysis: Sellers Defend 4,400 Resistance ZoneHello traders! Here’s my technical outlook based on the current XAUUSD (4H) chart structure. XAUUSD previously traded inside a range before breaking higher and later forming a descending structure after turning around from the highs. Price then tested the 4,400 Seller Zone multiple times, where sellers rejected the upside. Currently, XAUUSD is trading below the 4,400 Seller Zone while holding above the 4,280 Buyer Zone and Support Line. The recent rejection from resistance suggests a possible continuation lower toward support. As long as XAUUSD remains below the 4,400 Seller Zone and respects the descending channel, the bearish scenario remains valid. A continuation lower could push price toward the 4,280 Buyer Zone (TP1). However, a breakout and close above 4,400 would weaken the bearish outlook and increase the possibility of further upside. Please share this idea with your friends and click "Boost" 🚀 Short 
BITCOIN - A strong market. Retest of resistance BINANCE:BTCUSDT.P is maintaining its local bullish trend, while the five-week consolidation following the strong rally — during which the coin broke its medium-term bearish trend — points to underlying market strength
After breaking the trend and staging a strong rally, Bitcoin has been consolidating for five weeks. Negative news failed to trigger a decline, while the long squeeze became a technical catalyst for further upside.
The coin continues to confirm its bullish market structure. The breakout of the wedge resistance, which marks the consolidation boundary, is triggering another retest of key resistance. The main focus is on 82,300–82,800. A close above this zone could accelerate the move toward 86K
Resistance levels: 82,300, 82,850, 86,000
Support levels: 80,500, 80,000
A retest of the 82,800 resistance could trigger a correction, but if the market manages to hold the local pullback within the current range, this would provide another confirmation of the market’s readiness for a rally. A close above 83,000 could become a technical catalyst for further upside toward 86K–100K
Best regards,
R. Linda!  Long
Long
XAUUSD — Wave 5 Lower Toward 4,280
From Kelly’s view, gold is still trading inside a broader bearish structure. Price is currently around 4,352, while the recent rebound remains below the previous lower-high area near 4,380–4,395.
The key idea is simple: the current move may be completing a corrective Wave (4) around resistance, while the main structure still favors another bearish leg toward 4,320, 4,305, and potentially the 4,280 Wave (5) target zone.
⟡ Market structure
Gold continues to show a sequence of lower highs after failing around the 4,390 area.
The immediate resistance zone sits around 4,340–4,350, where the chart marks the projected Wave (4) sell zone. Price is currently testing this area, so the next reaction becomes important.
If sellers defend this zone and price breaks back below 4,320, bearish momentum could strengthen.
The 4,305 level is the next structural support. A confirmed breakdown below this level may expose the 4,278–4,288 area, where the projected Wave (5) completion and Fibonacci extension overlap.
➤ Key levels
◌ Current price area: 4,350–4,355
◌ Main sell zone: 4,340–4,350
◌ Strong resistance: 4,380–4,395
◌ First support: 4,318–4,325
◌ Strong support: 4,305
◌ First target: 4,320
◌ Second target: 4,305
◌ Main target: 4,278–4,288
◌ Invalidation: Above 4,395
⌁ Elliott Wave view
Wave (1): The first bearish impulse started from the recent local high and pushed price lower.
Wave (2): Gold produced a corrective rebound before sellers returned.
Wave (3): The next bearish leg extended toward the 4,320 area.
Wave (4): Price is now attempting another corrective recovery toward the 4,340–4,350 resistance zone.
Wave (5): If sellers reject this area, the final bearish leg could extend below 4,305 toward the 4,278–4,288 completion zone.
▸ Trading scenario
Preferred bearish scenario
Entry: 4,340–4,350 after bearish confirmation
Stop Loss: Above 4,395
Take Profit 1: 4,320
Take Profit 2: 4,305
Take Profit 3: 4,278–4,288
The cleaner plan is to wait for rejection around the projected Wave (4) resistance area. A break below 4,320, followed by loss of 4,305, would strengthen the continuation toward the Wave (5) target.
Alternative scenario:
If gold breaks above 4,350 and holds with strong bullish momentum, price could retest 4,380–4,395 before the broader bearish structure is reassessed.
◌ Invalidation
The bearish scenario would weaken if price gains sustained acceptance above 4,380, while a confirmed break above 4,395 would invalidate the preferred Wave (5) continuation setup.
⌁ Kelly’s view
Kelly’s main view remains bearish while gold stays below 4,380–4,395.
The current rebound looks more like a corrective Wave (4) than a confirmed trend reversal. If sellers defend 4,340–4,350, the next downside sequence may target 4,320, then 4,305, before the larger 4,278–4,288 Wave (5) zone comes into focus.
Do you think sellers will defend the Wave (4) zone, or will gold retest 4,390 first? Short 
BTCUSDT Long: Bulls Hold 82,100 as Price Targets 87,000Hello traders! Here’s my technical outlook based on the current BTCUSDT (4H) chart structure. BTCUSDT previously traded inside an ascending channel and range before breaking higher and continuing within a broader ascending channel. Price then tested the upper area near the Supply Zone.
Currently, BTCUSDT is trading below the 87,000 Supply Zone while holding above the 82,100 Demand Zone and the ascending channel support. The recent bounce from support suggests buyers are preparing for another move higher.
As long as BTCUSDT remains above 82,100 and respects the ascending channel, the bullish scenario remains valid. A continuation higher could target 87,000 (TP1). However, a break below 82,100 would weaken the bullish outlook. Manage your risk! Long 
 Long
Long
Long 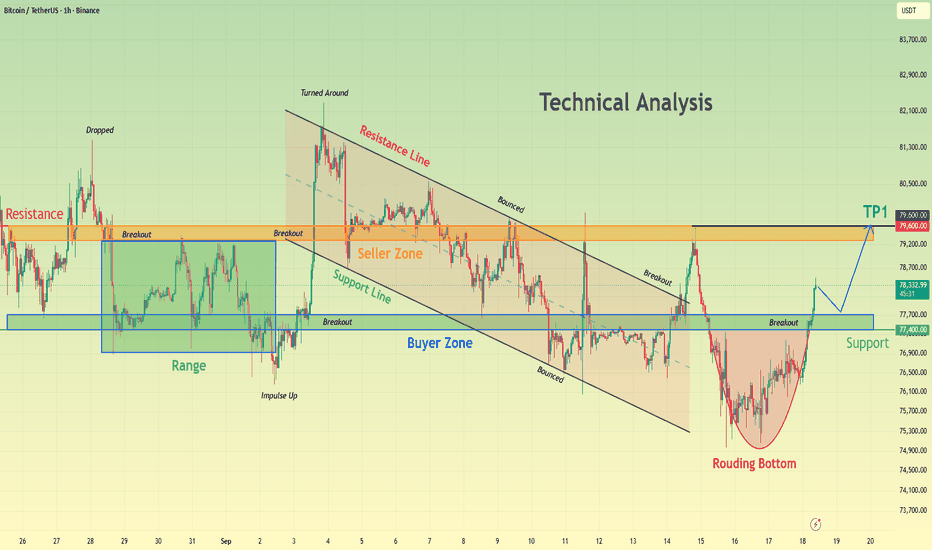
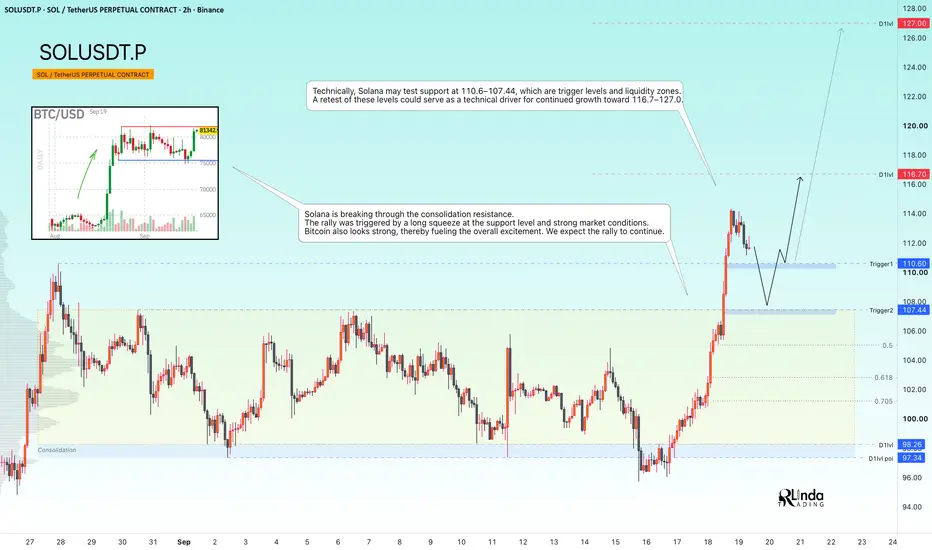
SOLUSDT - A hunt for liquidity ahead of the rally's continuationBINANCE:SOLUSDT confirms its bullish market structure. The long squeeze of support that we expected in the previous analysis played out perfectly. The bulls quickly took control of the situation and strengthened their positions...
Previously, we discussed how the market turned out to be stronger than expected: Bitcoin showed virtually no reaction to higher interest rates, the Fed’s hawkish stance, or the fact that the CLARITY Act was not passed. Consolidation continued, which further confirmed the strength of the market.
As for Solana, the altcoin is breaking through the consolidation resistance, suggesting that the coin is ready to continue its move higher. The rally was triggered by a long squeeze of support and the overall strength of the market
Resistance levels: 116.7, 127.0
Support levels: 110.6, 107. 44
Technically, Solana could retest the 110.6–107.44 support zone, which represents both key triggers and liquidity areas. A retest of these levels could become a technical catalyst for further upside toward 116.7–127.0
Best regards,
R. Linda!  Long
Long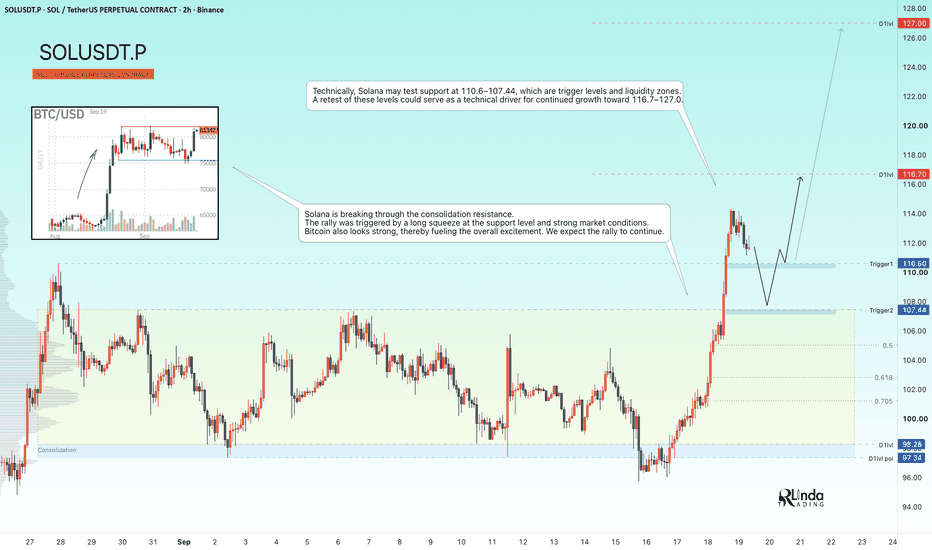
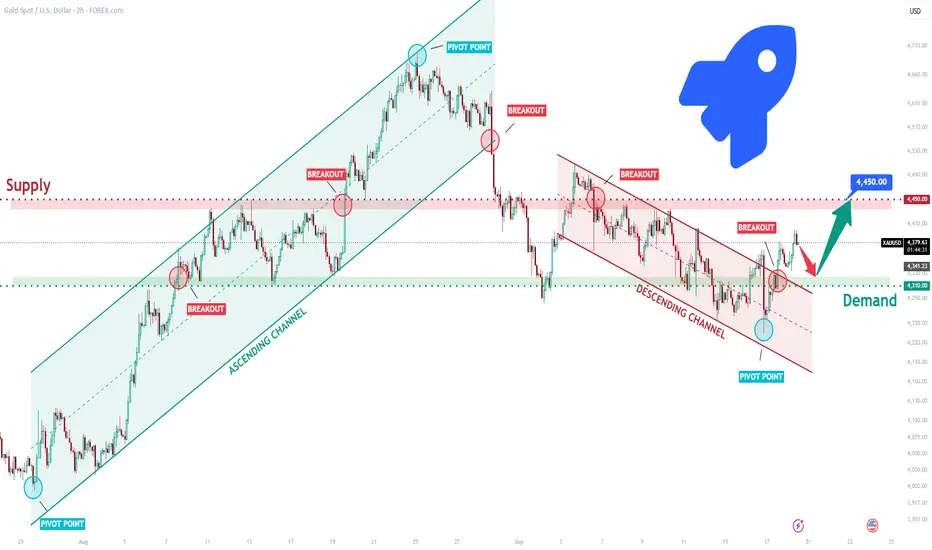
XAUUSD Long: Channel Breakout Could Drive Price Higher To 4,450$Hello traders! Here’s my technical outlook based on the current XAUUSD (2H) chart structure. XAUUSD previously traded inside an ascending channel before breaking higher and later forming a descending channel. Price then tested the Supply Zone near 4,450, where sellers rejected the upside before pulling back toward demand.
Currently, XAUUSD is trading below the 4,450 Supply Zone while holding above the 4,310 Demand Zone. The recent bounce from support suggests buyers are preparing for another move higher.
As long as XAUUSD remains above 4,310 and respects the current support structure, the bullish scenario remains valid. A continuation higher could target 4,450 (TP1). However, a break below 4,310 would weaken the bullish outlook. Manage your risk! Long 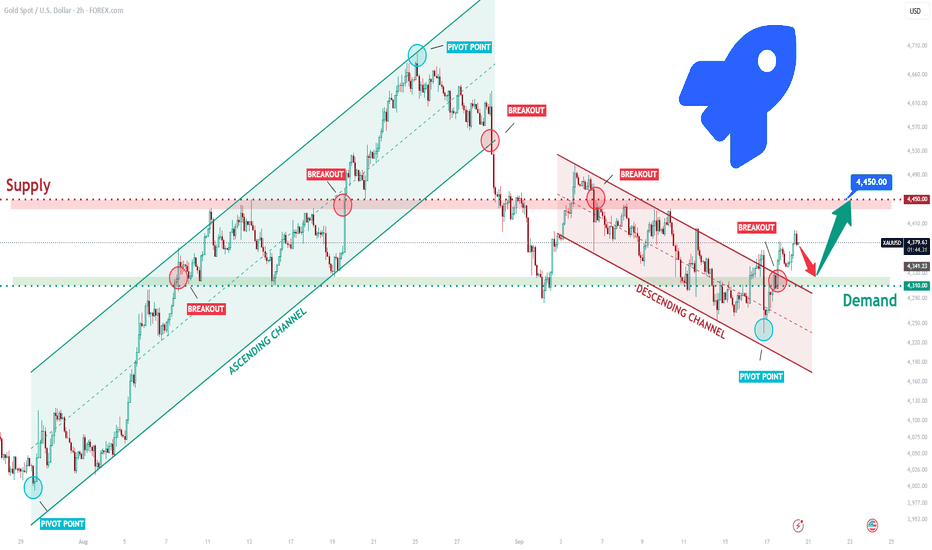
BTCUSDT: Rejection at 77,400 Resistance Favors a Move To SupportHello everyone, here is my breakdown of the current BTCUSDT setup.
Market Analysis
BTCUSDT previously traded inside a range before breaking higher and shifting bullish. Price then entered a downward channel, where a recent fake breakout above the upper boundary was rejected and price moved back below the Resistance Zone.
Currently, BTCUSDT is trading below the 77,400 Resistance Zone while holding above the 74,400 Support Zone and respecting the downward channel. The recent rejection suggests sellers may attempt another move lower.
My Scenario & Strategy
As long as BTCUSDT remains below the 77,400 Resistance Zone and respects the downward channel, the bearish scenario remains valid. A continuation lower could push price toward the 74,400 Support Zone (TP1).
However, a breakout and close above 77,400 would weaken the bearish outlook and increase the possibility of further upside.
That’s the setup I’m tracking. Thank you for your attention, and always manage your risk. Short 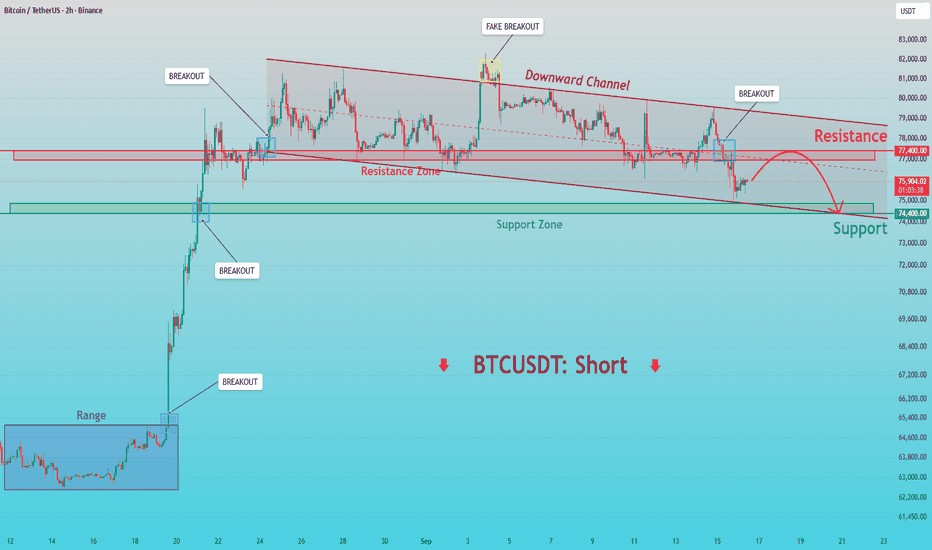
BTCUSD Daily: Base Built, Now Testing the 83K Wallwww.tradingview.com
This is the Bitcoin / USD daily chart (Bitstamp, 19 Sep 2026). Price is currently around 81,469. After a roughly 55% fall from the Oct 2025 peak, Bitcoin swept the sell-side liquidity, built a base, and broke out. It has pulled back into a fair value gap (FVG) and bounced, and it is now pressing against the first major resistance. All levels below are my approximate readings from the chart, so small deviations are possible.
1. Big picture (Sep 2025 to now)
Oct 2025: Bitcoin peaked near 126,000, the all-time high on this chart. The buy-side liquidity line sits at this level, about 126,500.
Nov 2025: A sharp drop was followed by a lower high near 116,000 (POI 3), then a slide to a low near 80,500 in late Nov. The high-to-lower-high pattern marks the start of the downtrend.
Dec 2025 to Jan 2026: A bounce reached about 97,000 and was rejected. The analyst labels this area a "big whales liquidity inject", meaning large players sold into the rally.
Feb 2026: A heavy crash took price to about 58,500, wiping out most of the gains made since 2024.
Feb to Apr: Price ranged in the 62,000 to 70,000 area, then rallied through spring.
May 2026: The rally topped near 83,000 and was rejected. This is the second "liquidity inject" label, and it is the level now called POI 1.
Jun 2026: Price dropped again to about 57,000, slightly below the Feb low. That swept the sell-side liquidity resting under the earlier lows and marked the bottom of this cycle so far.
Jul to mid-Aug: Price moved sideways in a tight range (about 60,000 to 66,000) inside the sell-side liquidity zone. This looks like accumulation.
Late Aug: A strong impulsive candle took price from about 65,000 to the mid-70,000s in one move. This left the FVG, and the rally continued to a high near 83,000 in early Sep.
Mid-Sep: Price pulled back into the FVG, bottoming near 75,500, then bounced sharply to the current 81,469.
2. Key levels
Upside (POIs, points of interest):
POI 1, around 83,000: the May high and the Sep high, a double top so far. This is the immediate resistance and the key level right now.
POI 2, around 98,000: the Jan 2026 rejection zone.
Strong POI, around 107,500: an older support from Sep to Oct 2025 that broke in Nov and has become resistance. The analyst marks it as strong because it is a major supply zone.
POI 3, around 116,000: the Nov 2025 lower high.
Buy Side Liquidity, around 126,000 and above: the Oct 2025 all-time high.
Downside:
FVG zone (pink box), roughly 73,000 to 76,000: the imbalance from the Aug breakout, and the first strong support. It already produced a bounce in Sep.
Around 80,500 (the Nov 2025 low) is a minor level just below price. Old support often turns into resistance, so it is worth watching.
Sell Side Liquidity zone, roughly 58,000 to 63,000: the base of the whole structure, with the Feb and Jun lows.
3. Structure read
Trendline: The HTF Resistance Trendline runs from the Oct 2025 peak down through the lower highs. By my reading, price moved above it around spring and has stayed above since. The Jun low landed roughly where the extended line sits, so it looks like a retest that held.
Short term: Bullish. Price made a higher low in Sep (about 75,500, above the Jul lows in the low-60,000s) and is again pushing toward the highs. The FVG was respected.
Medium term: Not yet confirmed. The May and Sep highs both sit at about 83,000, so this is a potential double top until a daily close above it. Price is also still far below the 97,000 to 126,000 supply area, and the Jun low was slightly lower than the Feb low, so the bottom is a sweep rather than a clean higher low.
Bias: Cautiously bullish above 75,000, with the real confirmation being a daily close above 83,000.
4. Liquidity logic on the chart
The analyst's core idea is that price moves between liquidity pools. Sell-side liquidity below (58,000 to 63,000) was swept and price reacted upward, which suggests smart money accumulated there. Now price is reaching for buy-side liquidity above, first equal highs at 83,000, then the older supply zones, and eventually the 126,000 high. The "whales liquidity inject" labels mark places where large sellers previously absorbed demand, so 83,000 may see a similar reaction again.
5. Scenarios
Bullish scenario (the analyst's path):
Price closes above 83,000 on the daily and holds it as support.
The first target is 98,000 (POI 2), about 20% above the current price. The chart expects a small pullback around 93,000 after that.
Then 107,500 (Strong POI), followed by another shallow pullback near 105,000.
The final projected target is the buy-side liquidity at 126,000+. This is the chart's most ambitious leg and would take a lot of time and momentum.
Pullback scenario:
Price is rejected at 83,000 (double top) and falls back.
First support is the FVG (73,000 to 76,000). A hold there sets up another attempt higher.
A daily close below about 73,000 breaks the FVG and weakens the bullish idea. The next area is the range around 65,000, then the 58,000 to 63,000 sell-side zone. A break of the June low near 57,000 would invalidate the whole base-building structure.
6. What to watch
Daily close above or below 83,000.
Whether the 73,000 to 76,000 FVG keeps holding on dips.
Reaction near 80,500, the old Nov low.
Volume on the breakout, since a break without volume is more likely to fail.
7. Summary
Bitcoin has done what a base-and-breakout structure usually does: swept the lows, ranged, broke out with an impulsive leg, and retested the FVG. Momentum is currently bullish, with price at 81,469 only about 2% below POI 1. But 83,000 has already rejected price twice, and the larger downtrend has not been fully reversed until price reclaims the higher supply zones. A close above 83,000 would be the first real confirmation, and the FVG is the key support. Crypto is very volatile, and the 126,000 target is a long-term projection, not a base case. Long 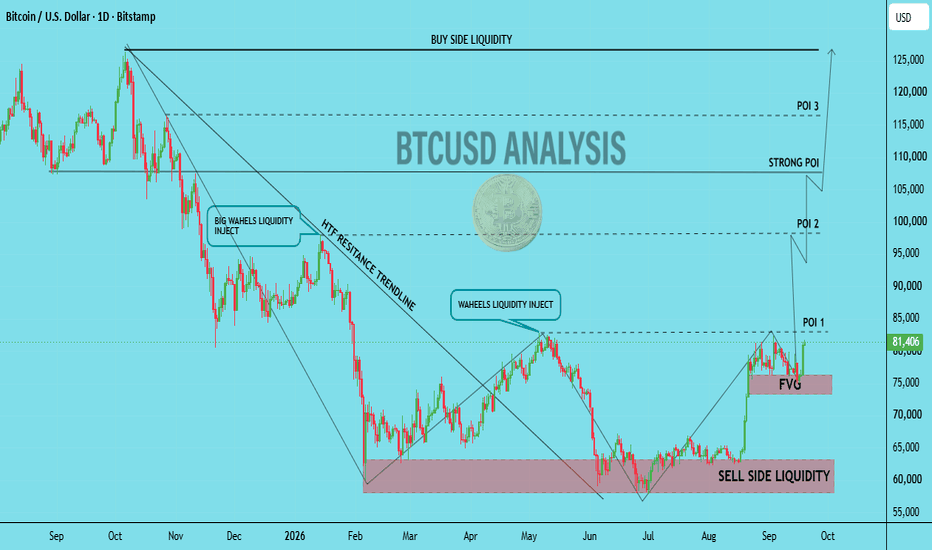
BTCUSDT: Breakout Wave, Bulls Eye HigherBTCUSDT is trading around 80,920 USDT after breaking out of a descending channel for the second time in recent price action. Notably, the price is holding firm above the EMA34 (approx. 79,440) and EMA89 (approx. 78,430), and the post-breakout upward momentum remains intact.
From a technical perspective, if BTC maintains the 79,500–80,000 zone and establishes a "higher low," I lean towards a scenario where the price retests 82,300 before extending to the primary target zone around 84,600 USDT. The fact that the current breakout structure closely resembles the previous rally is also a signal worth monitoring.
Macro factors are supportive. Asian stock markets are rising, driven by the technology sector, while oil prices have dipped slightly to around $103 per barrel, helping to stabilize risk sentiment.
The bullish scenario would weaken if BTC loses the 79,440 level, and particularly if it drops below 78,400. Long 
Long 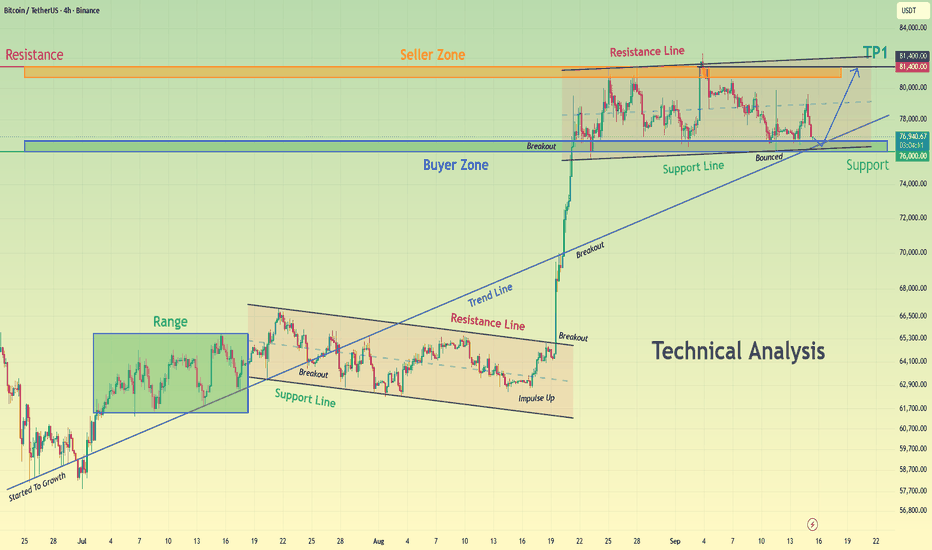
Short 
BTCUSDT: Buyers Attempt Another Move Toward 82,000 ResistanceHello everyone, here is my breakdown of the current BTCUSDT setup.
Market Analysis
BTCUSDT previously traded inside a downward channel before breaking higher with a strong impulse and shifting bullish. Price then formed a triangle structure with multiple breakouts before testing the Resistance Zone.
Currently, BTCUSDT is trading below the 82,000 Resistance Zone while holding above the 79,600 Support Zone and the Triangle Support Line. The recent rebound from support suggests buyers may attempt another move toward resistance.
My Scenario & Strategy
As long as BTCUSDT remains above the 79,600 Support Zone and respects the Triangle Support Line, the bullish scenario remains valid. A successful rebound 79,600 could push price higher, with 82,000 acting as the key resistance level (TP1).
However, a breakdown and close below 79,600 would weaken the bullish outlook and increase the risk of further downside.
That’s the setup I’m tracking. Thank you for your attention, and always manage your risk. Long 
Long 
 Long
Long
 Short
Short
 Short
Short

 Short
Short