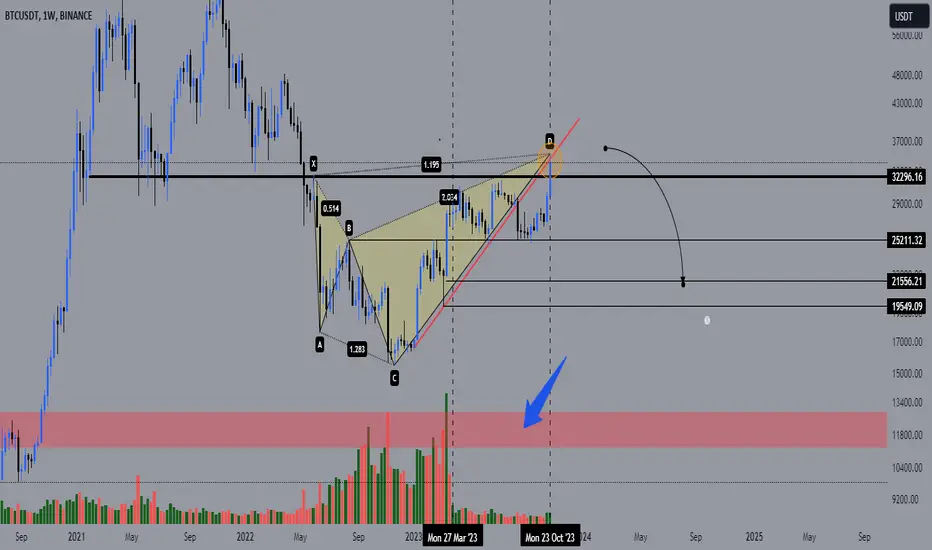
BTC Macro UpdatesBTC make perfect Bearish Shark at 35900$ as i have already share chart regarding this.
As you can see BTC spot has no volume since March as mentioned in chart.
It is just manipulation and grapping liquidity
According to onchain analysis Upside liquidity has been grab almost 1.5B$ has been liquidate.Everyone is bullish now which means big move is coming.This senerio is remindering about recent crash when BTC touch 50k$ from 30k$ in May 2022.
Becaregul with your trade on larger tf.
Trendline has a
Shark
KCR | ATM Watch: Demand Under Pressure. Konecranes handles heavy loads. My capital checks whether support can carry the position.
On this 4H Helsinki chart, quoted in EUR, the latest displayed close is €28.66, following a pullback from the recent October highs. Price is testing the highlighted demand area near the rising channel’s lower boundary.
The broader recovery structure is under examination. Buyers need to defend the foundation before the upside earns funding.
The immediate negotiation — €28.60–€28.87
Several displayed referen
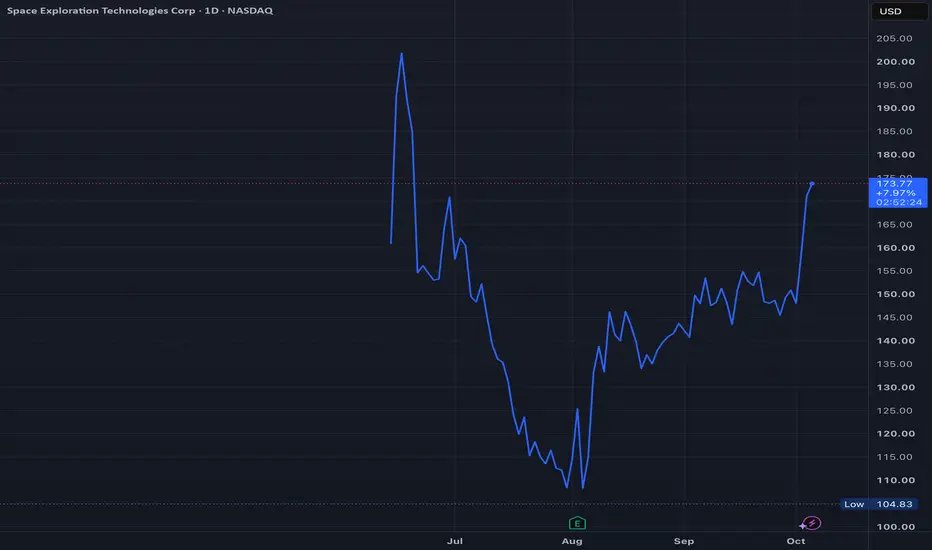
SPCX: TARGET IDENTIFIEDSPACEX LONG TERM, MULTI-YEAR TARGET IDENTIFIED:
In my honest opinion, I believe that SPCX may be fairly valued in the ~$40/share range. I think at the current valuation near ~$150 it has been, a bit too generously, given a multiple which does not match the ROI. I would re-consider what a fair valuation for SPCX is at ~$40.
OIL [Continuation]Facts:
A Russian oil refinery was hit overnight via an attack involving 1,000 drones.
The President of the United States of America has decreased sanctions on Russia.
Summation:
The President of the United States of America's fallback plan to lower prices/oil prices relied/relies upon Russia to a certain extent. This reliance-induced issue-series thus compounded overnight.
Personal Analysis:
In one word: Long.
In more words: Realistically, I don't include price lines up to $140 with a lo
BRENT!Brent hasn't peaked yet (far from it). Looking to push past 112 into the 112 - 113.2 slot. Levels remain unchanged through the end of the month. Updated price lines may be included in the next update, however, these lines do remain holding strong.
Harshal Priyavadan Patel (Independent Auditor/Analyst)
ORCL: Fibonacci entry zone Monday.ORCL: Fibonacci entry zone Monday, scaled plan to the monthly floor
Harshal Priyavadan Patel (Independent Auditor/Analyst) | Sunday, October 18th | 8:34 AM
ORCL | Paper long
FIBONACCI ZONES
Entry zone: 125.83 (±2.50), Monday, October 19. If price opens outside 123.33–128.33, the starter is skipped and the limit orders stay working.
Starter: 20% of planned size at the open.
Ladder: 25% at 125.83, 25% at 119.00, 20% at 112.50. Orders good until Dec 31.
Loss-prevention checkpoint, 112.117: a v
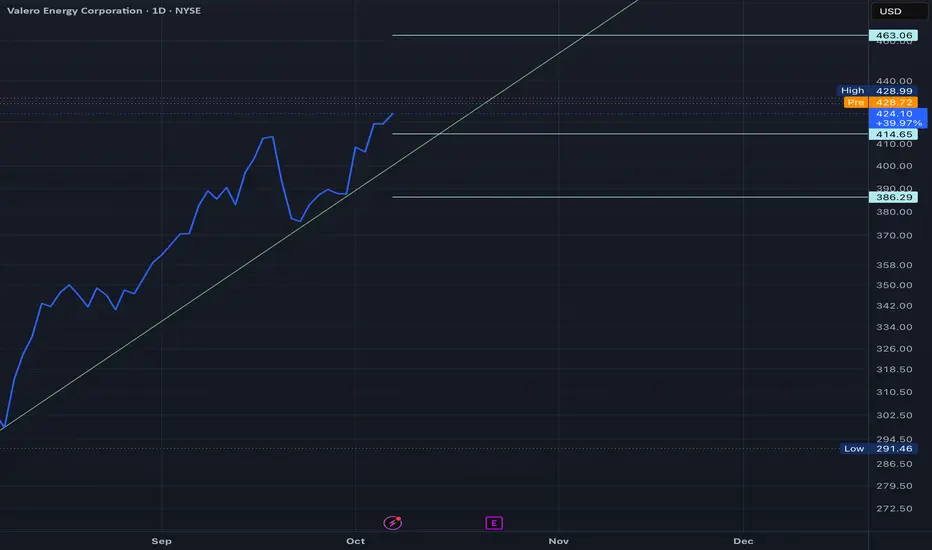
VLO# Valero Energy (VLO) — Bull Thesis
## 1. Core Thesis
The bullish case for Valero Energy is fundamentally a **refined-products scarcity and refining-margin thesis**, rather than a simple bet on higher crude oil prices.
The key relationship is:
**Refined-product value − crude/feedstock cost = refining margin**
If gasoline, diesel, jet fuel, and other refined products remain expensive relative to crude inputs, Valero can experience substantial earnings and cash-flow leverage through wider cra
SPCXIn my honest opinion, the price is too high. For what it is, for what they're offering, for what they're capable of providing in return on investment, ~$2.4 trillion is too much of an ask. LMT at $117 billion gets the same job done for a fraction of the cost. American citizens deserve better.
"You wanna trade against the dollar? Then you're gonna be trading against the Federal Reserve. Rule #1 is don't fight The Fed."
Thus, continuing to elaborate on my personal opinion for my Paper Trade by T
NFLXThis is a tough one. I'm fairly certain the time for "Risk on!" is here with Netflix. I've outlined the levels as I see them. The Center Point is seeing inflows and the center point mathematically is somewhere between $84 and $89, roughly speaking. Thus, the opportunity cost has lined up with the value retrievable, firmly bringing this into the "worth the risk with safeguards turned on" category.
XLEThis looks promising. My interpretation of the data suggests that a bullish move for XLE is to be expected. Center Point inflows concur. These are the prices, as I see them, all the way up to the $72 range and all the way down to the $56 range. Obviously, in my opinion, red means sell and green means buy. As always, the standard TradingView disclaimer applies to all of my posts as they have for the last 8 years since I first opened a TradingView account.
+PALESTINE++PALESTINE+ has yet to sign anything regarding oil rights in their territory. I suspect that Palestinian oil is being laundered and sold as sourced from elsewhere, including regions such as the Strait of Hormuz. The President of the United States of America suggested that the US Navy has been complicit in delivering these oil supplies and we must now ask that they be investigated for resource starvation, theft, genocide, and worse.
DXY — Bearish Shark Harmonic PatternDXY is approaching the Potential Reversal Zone of a Bearish Shark harmonic pattern on the 1-hour chart.
Price has been moving higher along the rising trendline and is now approaching the 99.995 area. This is where I’m watching for a possible rejection and a move lower.
The trendline is important because it has been supporting the recent move higher. A break below the trendline would give additional confirmation that the uptrend is losing strength.
Trade Setup
Entry: 99.995
Stop Loss: 100.20
AUDCAD — Bearish Shark Harmonic PatternAUDCAD is approaching a very important area on the chart where a Bearish Shark harmonic pattern is completing.
The Potential Reversal Zone (PRZ) around 1.0250 is the main area to watch. Price has made a strong move higher into this zone, so a rejection here could start a larger move to the downside.
Another important part of the setup is the trend channel. Price has been moving higher inside the rising channel, with the upper channel line now lining up closely with the Potential Reversal Zone.
SQZ - UK Oil/Gas Long on LSEBullish Shark Harmonic
Uptrending price action
Broke and now testing historic level with bullish flag type structure
Weekly RSI and MACD bullish divergence is maturing
Enter only if price pulls back to entry shown on Long position drawing
Could slowly DCA in.
Frist target is 3:1 RR
Exit on stop loss level
Gold (XAUUSD) 1H — Market Structure & FVG AnalysisThe 1H chart shows a strong bullish structure, with multiple Breaks of Structure (BOS) and several Fair Value Gap (FVG) areas developed during the upward move.
🔹 Key Resistance: 4,437.770
🔹 Current Area: Around 4,405
🔹 Nearby Support: 4,389.816
🔹 Major FVG / Structure Zones: Around 4,300 and 4,250
🔹 Lower Reference Area: Around 4,199
From a technical-analysis perspective, price is trading close to a significant resistance area. A rejection could create a retracement toward previously establish