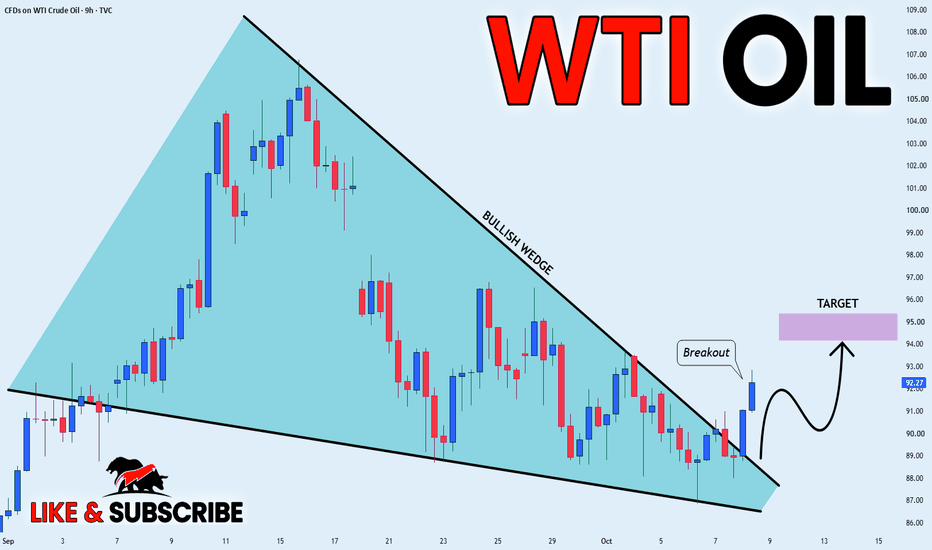
CRUDE OIL WEDGE BREAKOUT|LONG|
✅CRUDE OIL made a spectacular breakout of out of the bullish wedge formation and the breakout is confirmed so after a potential retest of the demand zone below we will be expecting a further bullish move up.Time Frame 4H.
LONG🚀
✅Like and subscribe to never miss a new idea!✅
Supply and Demand
Nifty levels - Oct 09, 2026Nifty support and resistance levels are valuable tools for making informed trading decisions, specifically when combined with the analysis of 5-minute timeframe candlesticks and VWAP. By closely monitoring these levels and observing the price movements within this timeframe, traders can enhance the accuracy of their entry and exit points. It is important to bear in mind that support and resistance levels are not fixed, and they can change over time as market conditions evolve.
The dashed lines
Mrvl 3 months chart After the stock successfully broke above the $127.48 resistance level (the red horizontal line) and confirmed the breakout with a three-month candle close, it has reaffirmed its long-term bullish trend.
I recommend buying and holding.
There is no such thing as an “A_i bubble.”
Good luck 4all
GBP-AUD Will Go UP! Buy!
Hello,Traders!
GBPAUD is holding above the horizontal demand area, while a possible mitigation into the discount zone could absorb sell-side liquidity before bullish continuation toward the marked target.Time Frame 9H.
Buy!
Comment and subscribe to help us grow!
Check out other forecasts below too!
BankNifty levels - Oct 09, 2026Utilizing the support and resistance levels of BankNifty, along with the 5-minute timeframe candlesticks and VWAP, can enhance the precision of trade entries and exits on or near these levels. It is crucial to recognize that these levels are not static, and they undergo alterations as market dynamics evolve.
The dashed lines on the chart indicate the reaction levels, serving as additional points of significance. Furthermore, take note of the response at the levels of the High, Low, and Close va
GOLD | 4,148 Holds the Key as Fed Hike Bets Ease
Gold is consolidating around the important 4,148–4,185 decision zone, while the fundamental backdrop has become slightly more supportive.
Expectations for an October Fed rate hike have fallen sharply following softer U.S. employment data. Lower near-term tightening expectations are helping Gold, while concerns surrounding rising U.S. government debt also provide longer-term support.
However, the strong U.S. dollar and elevated Treasury yields continue to limit the strength of the recovery.
T
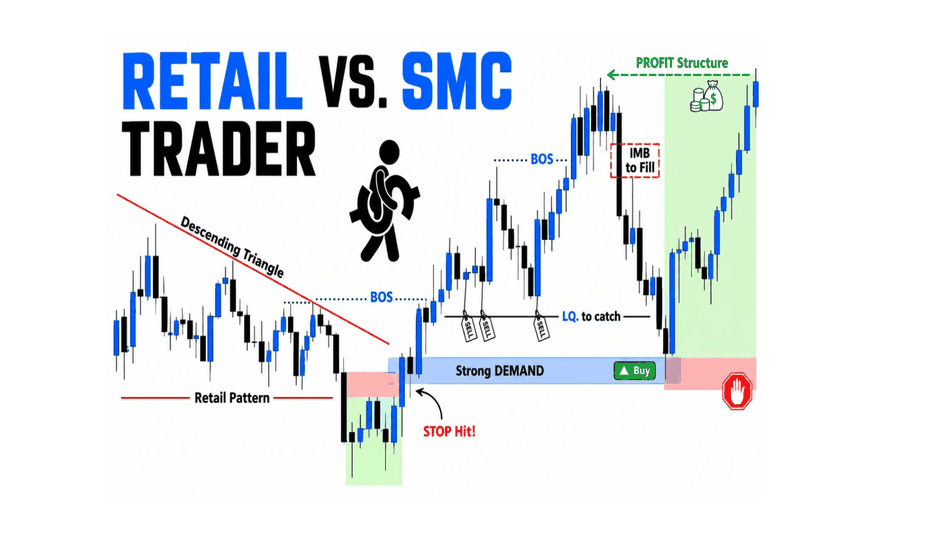
Retail Trader vs. SMC Trader: Understanding the DifferenceRETAIL TRADER VS SMC TRADER
The biggest difference between a Retail Trader and an SMC Trader is not simply the strategy—it is the way they read price action, liquidity, and market structure.
RETAIL TRADER
A typical retail trader may rely heavily on traditional chart patterns, trendlines, support and resistance, and obvious breakout levels.
When price approaches a well-known resistance or support area, many retail traders enter immediately after seeing a breakout or rejection. They often place
Support Is Holding At The +FVG! Bulls Are Defending!Wednesday, Oct 7, 2026.
This video is the Mid-Week Update to the US Crude Oil Weekly Forecast posted Sunday.
US Oil mid-week analysis point to a cautious, mixed-to-slightly bearish or consolidating setup over the next 72 hours, though downside momentum is showing signs of exhaustion.
The +FVG is proven to be resilient. The bearish close on the day notwithstanding.
Enjoy!
May profits be upon you.
Leave any questions or comments in the comment section.
I appreciate any feedback from my viewer
Will the Weekly +FVG Hold Support With In A Volatile Week?In this Weekly Market Forecast, we will analyze the CRUDE OIL for the week of Oct 5-9th.
US Crude Oil (WTI) enters the coming week with a bearish short-term bias following three bearish weekly closes. Price has entered a bullish FVG that can potentially hold fast, sending prices higher.
Crude is expected to see high volatility this week amid the release of several key economic and energy-market indicators, including September PMI services data, the September ISM Non-Manufacturing Employment I
MESZ Oct 8: Reclaim 7822 or Retest 7803?MESZ already tested yesterday’s downside level around 7,803 overnight and is currently trading near 7,817.
The key upside confirmation level is 7,822.
A confirmed reclaim above 7,822 could support continuation toward 7,837, followed by 7,845.
On the downside, 7,816 is the immediate support level. Failure to hold that area could put 7,803 back into play.
Key levels
- 7,822 — bullish confirmation
- 7,837 — first upside target
- 7,845 — second upside target
- 7,816 — short-term support
- 7,803 — do
EURUSD Short: Lose Upside Momentum — 1.1140 Becomes the Key TestHello traders! Here’s my technical outlook based on the current EURUSD (3H) chart structure. EURUSD previously traded along the Demand and Supply Lines before breaking lower into a descending channel. Price then tested the Supply Zone near 1.1280 with a fake breakout and was rejected.
Currently, EURUSD is trading below the 1.1280 Supply Zone while holding above the 1.1140 Demand Zone. The recent rejection and descending channel structure suggest a possible continuation lower toward demand.
As
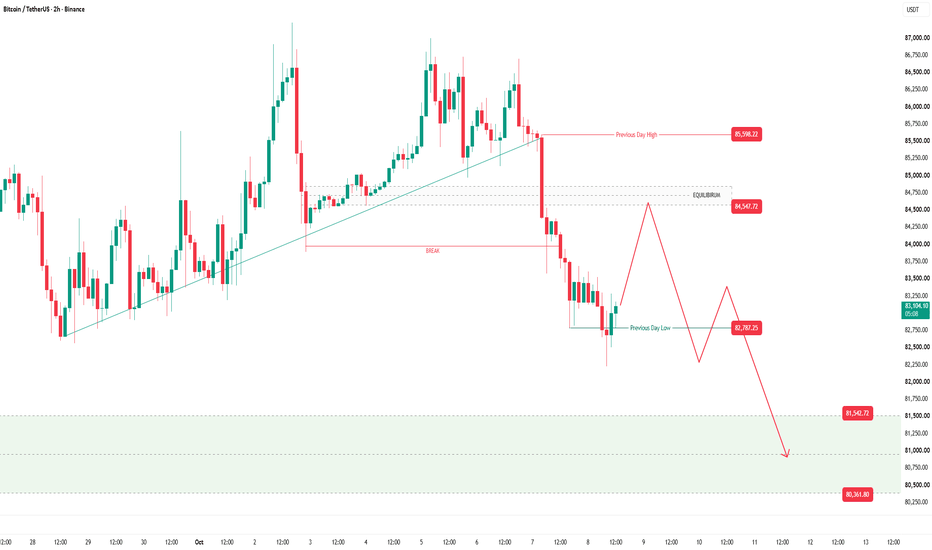
BTCUSDT H2 - Potential Bearish ContinuationBTC has broken below its ascending trendline and support around 84,000. The chart shows bearish pressure, while price is beginning to rebound after briefly dropping below the previous day's low at 82,787.25.
Technical Analysis
The projected scenario allows for a pullback toward the equilibrium area around 84,550-84,850 before another decline. Rejection from this area could establish a lower high.
Key levels:
- Pullback resistance: Around 84,550-84,850
- Previous day high: 85,598.22
- Previous
USOIL H4 - Potential Bullish ReversalThe chart shows price beginning to break out of a falling wedge after holding near the 84.98-86.86 demand zone. A recovery may be developing, but confirmation requires an H4 candle close above the breakout line and price holding that area during a retest.
Projected upside targets:
- Target 1: 100.39-101.97
- Target 2: 111.26-112.34
- Target 3: 117.71-119.42
Fundamentals
EIA data released on October 7 showed that US commercial crude inventories declined by approximately 3.19 million barrels in t
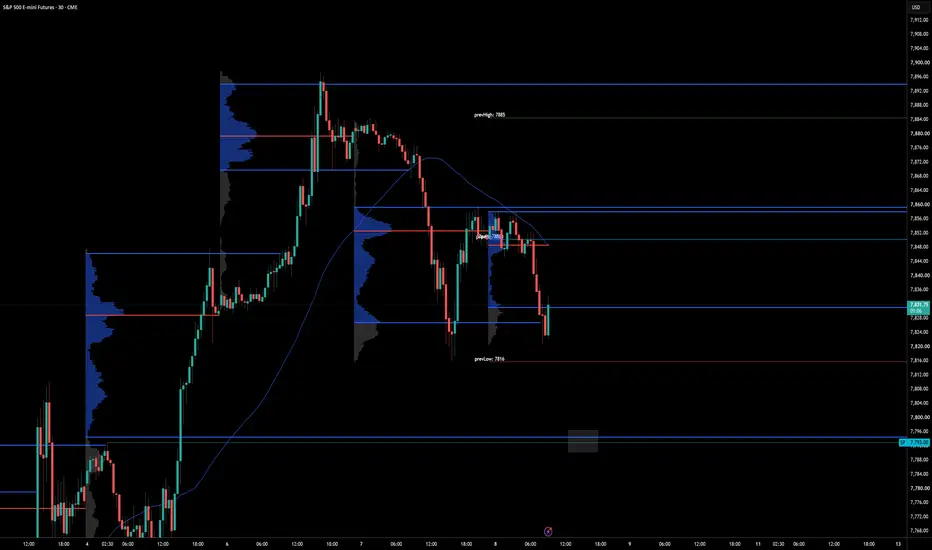
ES | Untested VAL & Single Print – Potential LongToday, we're revisiting a level we highlighted a couple of days ago, which remains untested and continues to offer an interesting area of confluence for a potential scalp long.
The zone comes in around 7794, where we have an untested Value Area Low (VAL), with a single print just below at 7793. This area also previously acted as supply, adding another layer of confluence as we look for a potential flip from supply into demand.
With these technical factors aligning, this remains an area of inte
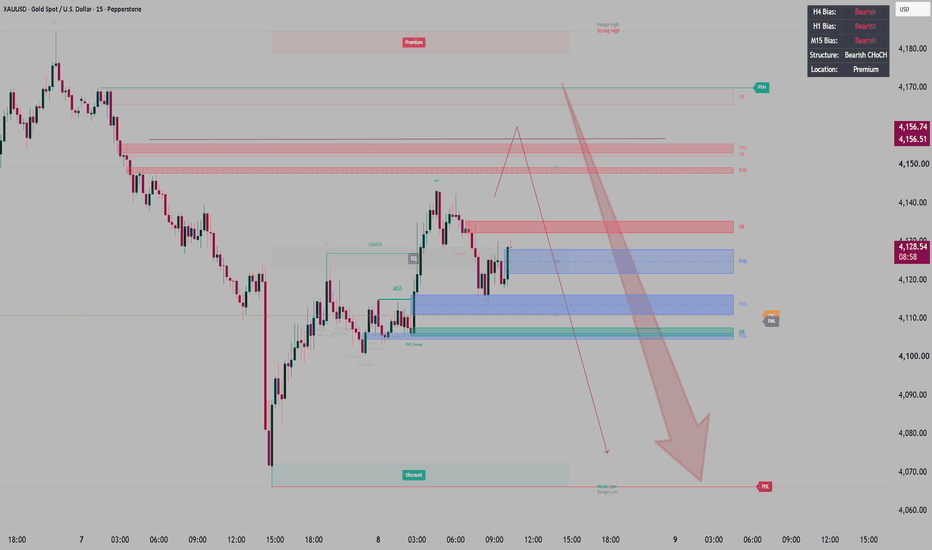
XAUUSD - Bearish BiasXAUUSD - Bearish Bias
Gold remains bearish across the higher timeframes, while the current intraday move looks more like a retracement into premium rather than a confirmed reversal. Price is approaching a strong area of interest around 4150–4165, where multiple bearish imbalances and supply zones are aligned.
The preferred scenario is to let price trade higher into that area, potentially sweep nearby liquidity, and then wait for bearish confirmation on the lower timeframe. A clear rejection, b
XAU/USD 08 October 2026 Intraday AnalysisH4 Analysis:
-> Swing: Bullish.
-> Internal: Bearish.
Bias and analysis to remain the same as analysis dated 30 June 2026.
Price did not print bullish CHoCH to indicate bullish pullback phase initiation. Price instead printed a new low followed by a bullish CHoCH
Price is currently trading within and established internal range, however, I will continue to monitor price with respect to depth of pullback.
Intraday expectation:
Price to trade up to either premium of internal 50% EQ, or
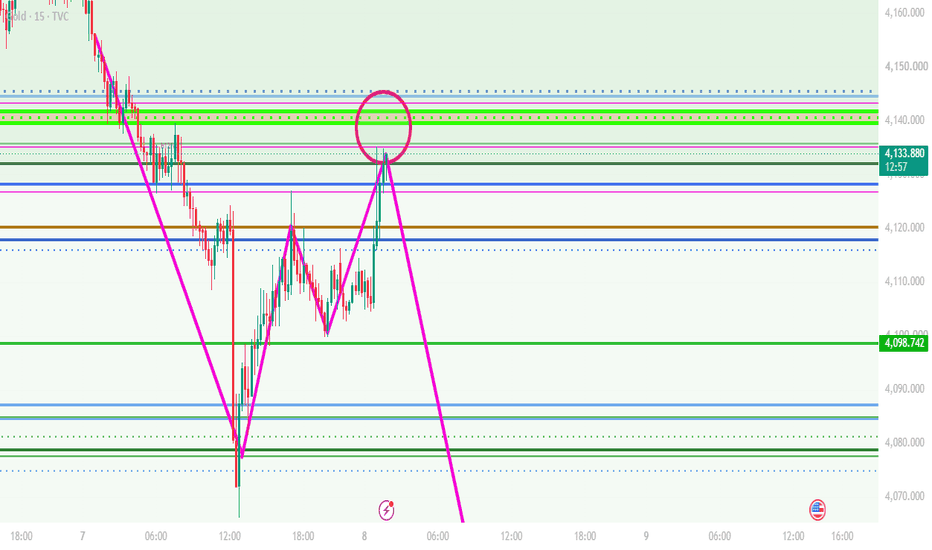
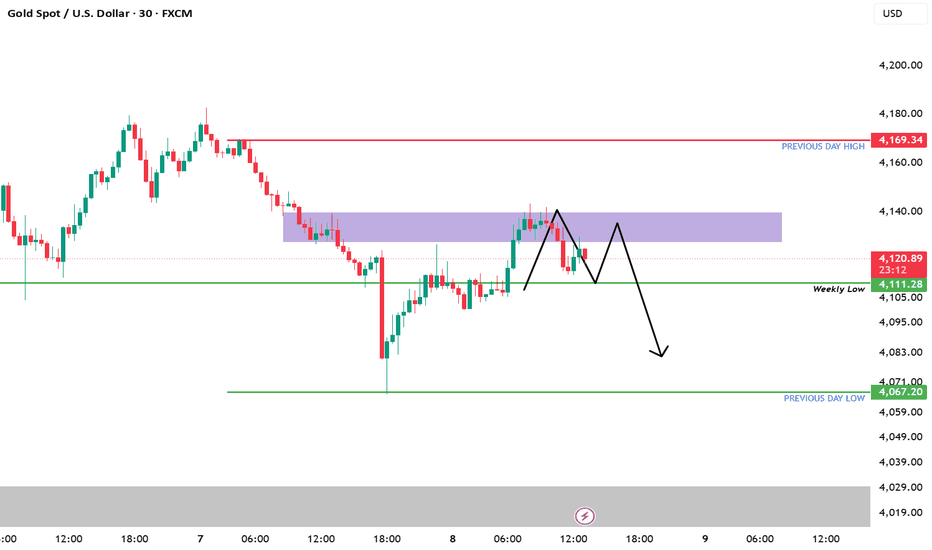
XAUUSD: THE TRAP IS SET. ARE YOU READY? Listen up, traders. If you’re hitting buy right now because you see green candles, you’re about to become exit liquidity.
Look at the 30M chart. We had a massive liquidation wick down to the 4080s, a sharp V-shape recovery, and now we’ve hit a brick wall.
Here is exactly how the smart money is playing this:
🔴 THE BEARISH CASE (PRIMARY SETUP):
Look at that purple box—this is a heavy supply zone/resistance block sitting just below the 4169 Previous Day High. Price pushed up into this zone, got