Long
Long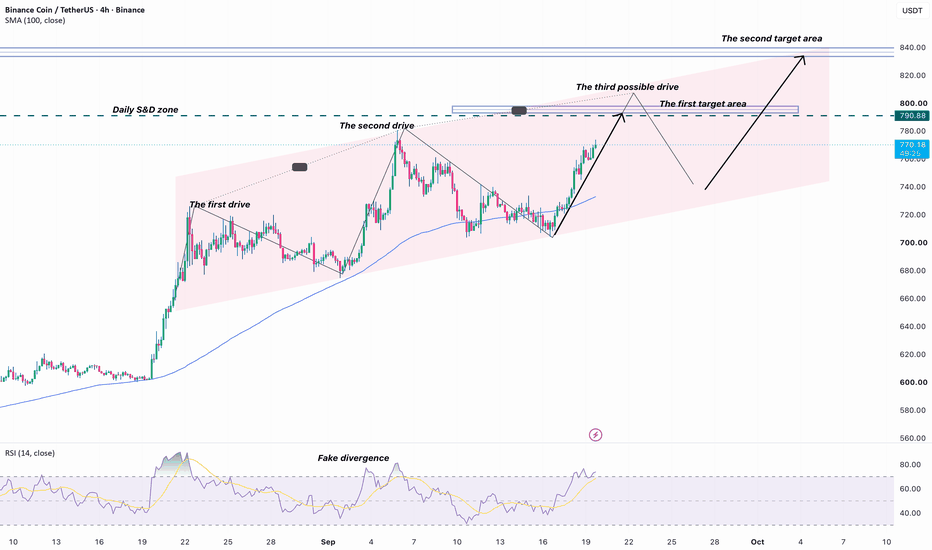
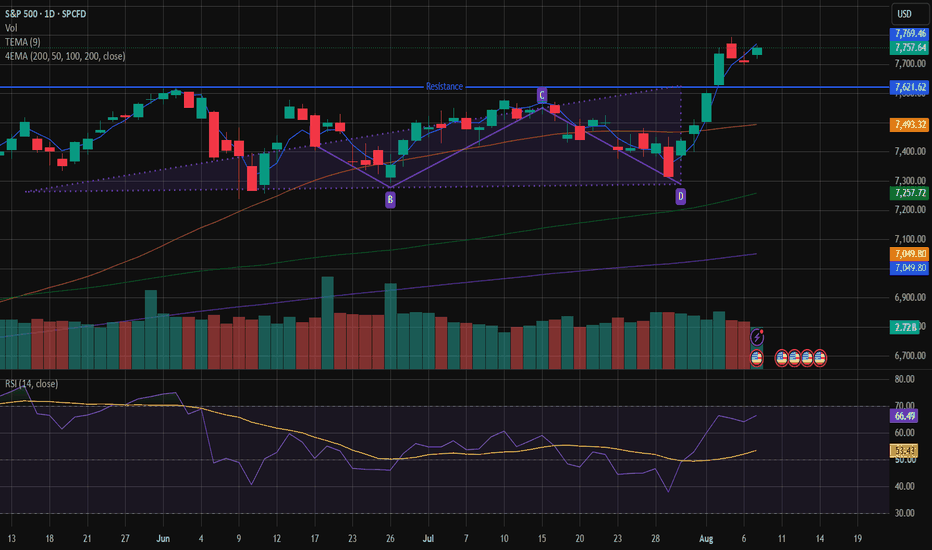
S&P 500: Jobs fell, market rose, triangle held!This video is an update on the S&P 500 trade setup that I put out on 7 August 2026, the day of the release of the July jobs report. The economy lost a shocking -23,000 jobs, the first negative jobs print in this cycle and contrary to expectations of +80,000 jobs, and the S&P 500 went on to close the session near record highs at 7,757. In this video, I discuss precisely how bad news turned good news for the stock market and how the decline in the Fed rate hike probability from 57% to 43.9% led to a 1.3% gain in the Nasdaq and an even stronger run for the semiconductor ETF to +7% on the week. Also discussed is how the ascending triangle breakout at 7,620 held even as the markets saw one of the worst data prints of the year. We discuss the updated trailing stop, the targets that are now achievable, and one statistic from the job report 921,000 temporary layoffs;that you need to watch out for in September.  Long
Long
 Long
Long
Long 
 Long
Long
BTC Analysis: Broken Support Signals More Downside Toward $54.5kHi!
BTCUSDT is currently trading around $62,500, but the bigger picture still looks bearish. Price has already broken below the key support area and the major support line, indicating that sellers remain in control.
On the RSI, the recent move looks more like a fake bullish divergence rather than a true reversal signal. Despite the bounce, the market hasn't shown enough strength to change the trend.
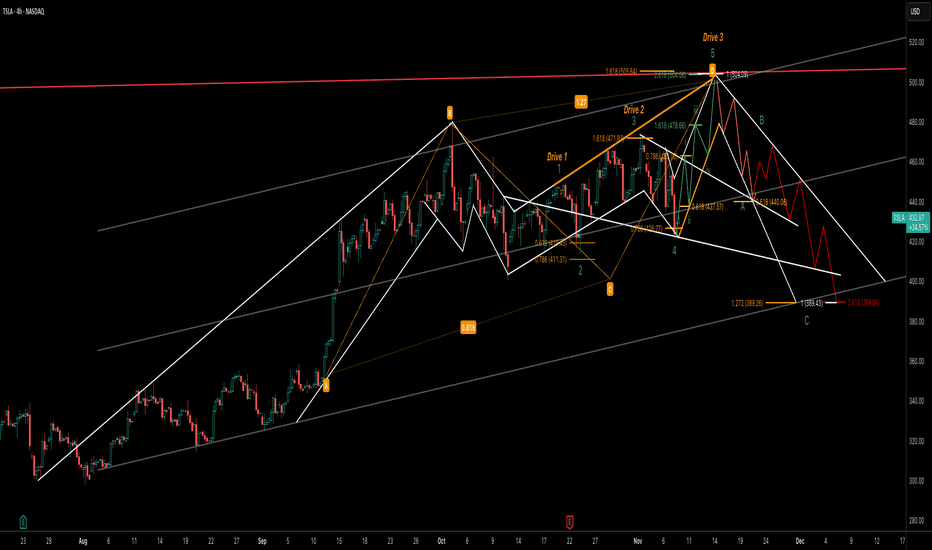
From a structure perspective, BTC could be forming a Three Drives pattern. If this setup plays out, price may first react around the QML (Quasimodo Level) near the $63,500-$64,000 zone before continuing lower.
As long as the bearish structure remains intact, I'm expecting another leg down, with a potential target around the $56,500 support area.
I’m excited to announce that I’m now a Brand Ambassador for AvaTrade!  Short
Short
Inside Bitcoin Magazine’s Retweet — Jack Dorsey Pays with BTCA widely shared post on social media highlighted Block CEO Jack Dorsey’s decision to pay with Bitcoin at a counter. This tweet, amplified by Bitcoin Magazine, has sparked significant discussion online and reflects the ongoing interest in cryptocurrency’s real-world applications. The original tweet can be viewed here.
The Key Development
The tweet from Bitcoin Magazine, which garnered 542 likes and 80 retweets, emphasizes a notable moment in cryptocurrency adoption. Dorsey’s action represents not just a personal financial choice but also serves as a symbol of Bitcoin’s increasing acceptance in everyday transactions. This incident resonates within a broader context, where discussions around Bitcoin’s utility are becoming more prevalent, especially amid mixed signals in the broader crypto market.
Key Takeaways
Jack Dorsey utilized Bitcoin for a payment, Bitcoin Magazine amplified the tweet, the tweet received significant engagement from the community.
The Numbers
Currently, the cryptocurrency market is experiencing mixed signals, with variable momentum across different assets. As noted, no specific price movements or trading volumes are reported at this moment. However, the social media buzz surrounding Dorsey’s payment could influence community sentiment and engagement levels in the short term.
Jack Dorsey, a prominent figure in the Bitcoin community, has been a vocal advocate for cryptocurrency adoption. His company, Block, has integrated various cryptocurrency functionalities, pushing for wider acceptance. This recent transaction aligns with Dorsey’s ongoing efforts to promote Bitcoin and reflects the growing trend of cryptocurrencies being used in everyday scenarios.
Key Levels to Watch
Traders and community members are closely watching social media engagement around Bitcoin and its real-world applications. The excitement generated by Dorsey’s payment could lead to increased discussions and potential adoption among businesses. Additionally, this trend of high-profile endorsements might encourage more users to explore Bitcoin payments, especially if they witness practical implementations in their daily lives. Pi Network Sets June 18 Deadline for Protocol 25 Node UpgradePi Network has entered another important phase of its mainnet development. The Pi Core Team announced that all mainnet node operators must complete the upgrade to Protocol 25 by June 18, 2026, or risk losing connection to the network. The update is part of Pi Network’s long-running roadmap that is gradually moving nodes from Protocol 19 through Protocol 26.
In a post on X, the team reminded node operators to plan ahead for the migration. The announcement quickly sparked discussion across the Pi community, with operators preparing for another network-wide transition.
Protocol 25 Marks the Next Step in Pi’s Upgrade Path
The latest upgrade follows the successful rollout of Protocol 24 and continues Pi Network’s sequential migration process. According to the roadmap, nodes must upgrade in order and cannot skip versions. The current path moves from version 24.1 to 25.2, with Protocol 26 expected to follow at a later date.
Unlike some previous migrations, the Protocol 25 upgrade is designed to be relatively quick. Pi Network said most nodes should experience less than five minutes of downtime during the process. However, the team advised operators not to upgrade all nodes simultaneously. Instead, they should redirect traffic to other nodes or use Pi’s mainnet API infrastructure while the migration is underway.
Node Operators Begin Preparing for June 18
The deadline has already caught the attention of the community. Pi advocate PiNetwork DEX said he plans to notify node operators to complete upgrades in batches before June 18 to help ensure a smooth transition across the network.
Questions also surfaced about node participation and network growth. Some community members asked whether the total node count has approached 400,000 and where updated testnet statistics can be viewed. While the Core Team has not commented on those figures, the discussion highlights growing interest in the health and scale of the Pi Network ecosystem.
Upgrade Process Differs by Node Type
For users running Pi Desktop on Windows or macOS, the process is largely automatic. The protocol update will trigger when the node software starts. Linux users operating through the newer Pi Linux Node CLI may not need to take action if auto-updates are enabled. Those without automatic updates must manually run the upgrade command.
Meanwhile, operators using legacy self-managed Docker containers will need to update their Docker image and restart services using the latest Protocol 25 release. Pi Network stressed that operators should monitor synchronization status after upgrading to confirm the migration has completed successfully.
What This Means for Developers and Investors
For developers, Protocol 25 is another sign that Pi Network continues to strengthen its infrastructure ahead of future upgrades. Consistent node participation is critical for network stability, scalability and future ecosystem growth. For investors and community members, the upgrade itself is not a direct price catalyst. But it demonstrates that the project is continuing to execute its technical roadmap despite ongoing market volatility.
That progress comes at a time when Pi Network remains under pressure from large token unlocks and weak market sentiment. Many holders are closely watching whether ecosystem development can eventually offset the additional supply entering circulation. As June 18 approaches, the focus now shifts to node operators. Their ability to complete the Protocol 25 migration on time will help determine how smoothly Pi Network advances toward the next stage of its mainnet evolution.  Long
Long
Ethereum Hits Record Transaction Surge In Q1 2026Ethereum just delivered one of its strongest quarters ever. The network processed over 200 million transactions in Q1 2026. This milestone marks a historic leap in activity. It reflects a sharp rise in real-world usage across the ecosystem.
The Ethereum transactions surge stands out because it happened despite a slow price trend. Many expected price growth to follow usage. That did not happen this time. Instead, network fundamentals strengthened quietly in the background.
Developers, traders, and users continue to build and transact on Ethereum daily. This steady activity reveals deeper adoption trends. It shows that the ecosystem grows beyond speculation. The numbers now confirm a shift toward utility-driven growth.
Ethereum Network Usage Reaches New Highs
The Ethereum network usage crossed 200 million transactions in just one quarter. This jump represents around 43 percent growth compared to the previous quarter. Such acceleration signals strong demand across multiple sectors.
Users now rely on Ethereum for payments, DeFi, NFTs, and infrastructure. The Ethereum transactions surge reflects this diversity. It highlights how different applications drive continuous engagement.
More importantly, this growth did not come from one single trend. Instead, multiple sectors contributed simultaneously. That creates a stronger and more sustainable growth pattern.
Layer 2 Scaling Drives Massive Efficiency Gains
Layer 2 scaling played a major role in this expansion. Solutions like rollups reduce transaction costs and improve speed. They allow users to interact with Ethereum without paying high gas fees.
The rise of Layer 2 scaling unlocked new user segments. Smaller transactions became viable again. Developers built applications that require frequent interactions. This naturally increased overall transaction count.
As Layer 2 scaling continues to evolve, Ethereum benefits from increased throughput. The Ethereum transactions surge reflects this improved efficiency. It shows how scaling solutions transform user behavior.
Many users now interact with Ethereum through Layer 2 networks. These networks settle transactions on the main chain. That keeps security intact while boosting capacity.
Stablecoin Activity Fuels Daily Transactions
Stablecoin activity remains another key driver behind this growth. Users rely on stablecoins for payments, trading, and remittances. These assets maintain consistent value, making them ideal for frequent transactions. The Ethereum network hosts a large portion of global stablecoin supply. This dominance strengthens Ethereum network usage. It ensures continuous transaction flow across the ecosystem.
Traders move funds between exchanges using stablecoins. Businesses use them for cross-border payments. DeFi platforms depend on them for liquidity. All these actions contribute to the Ethereum transactions surge. Stablecoin activity also increases network stickiness. Users return frequently to transact. That creates consistent demand rather than one-time spikes.
What This Means For Ethereum’s Future
The current trend points toward sustainable growth. Ethereum continues to attract developers and users across sectors. The combination of Layer 2 scaling and stablecoin activity strengthens its foundation. The Ethereum transactions surge signals a shift from hype-driven cycles to utility-driven adoption. That shift matters for long-term stability. It reduces reliance on speculative demand.
If Ethereum maintains this trajectory, it could dominate as the base layer for decentralized applications. Increased Ethereum network usage supports this vision. It shows real engagement rather than temporary spikes. At the same time, scaling improvements will remain crucial. Developers must continue optimizing performance. Users expect faster and cheaper transactions.
The Bigger Picture Behind The Numbers
This record quarter tells a larger story. ETH evolves into a high-utility blockchain. It supports financial systems, digital ownership, and decentralized infrastructure. The Ethereum transactions surge reflects this transformation clearly. It shows how real-world applications drive adoption. It also highlights the success of scaling strategies. As more users enter the ecosystem, network effects strengthen further. Each new participant adds value to the system. That creates a compounding growth cycle. Short 
Ethereum Sees Sharp Drop In USDT And USDC UsageStablecoin activity on the Ethereum network has dropped to its lowest level in 2026. This shift has caught the attention of analysts and traders across the crypto space. Data from Santiment highlights a steady decline in transaction volume and wallet interactions involving USDT and USDC. This trend signals a potential cooling phase in the broader market.
Investors often rely on stablecoins as a gateway into crypto assets. When stablecoin activity slows, it usually reflects reduced buying intent. This decline does not happen in isolation. It connects closely with market sentiment, liquidity flows, and trading behavior across exchanges.
The drop in stablecoin activity comes at a time when market participants expected renewed momentum. Instead, the Ethereum network shows signs of reduced engagement. This change raises concerns about short term demand and overall crypto buying power.
Why Stablecoin Activity Matters In Crypto Markets
Stablecoins play a critical role in the crypto ecosystem. They act as a bridge between fiat currency and digital assets. Traders use them to enter and exit positions quickly without relying on traditional banking systems. This makes stablecoin activity a strong indicator of market health.
When stablecoin activity rises, it often signals incoming capital. Traders prepare to deploy funds into assets like Bitcoin or Ethereum. On the other hand, falling activity suggests hesitation. Investors may hold back due to uncertainty or lack of confidence.
The current decline in stablecoin activity reflects a cautious market environment. Traders appear less aggressive in deploying capital. This trend impacts liquidity across exchanges and reduces volatility in the short term.
USDT And USDC Trends Reflect Changing Investor Behavior
USDT and USDC trends provide valuable insights into market dynamics. These stablecoins dominate trading pairs across major exchanges. Changes in their usage directly affect liquidity and price movements.
Recent data shows fewer transfers and lower circulation velocity for both assets. This suggests traders hold stablecoins instead of actively using them. Such behavior often appears during uncertain market phases.
Crypto buying power depends heavily on stablecoin availability and movement. When investors pause activity, it limits the market’s ability to rally. This creates a cycle where low activity leads to reduced price action.
What This Means For The Short Term Market Outlook
The current decline in stablecoin activity does not necessarily signal a long term downturn. Instead, it highlights a temporary pause in market momentum. Such phases allow markets to reset before the next move.
Investors should watch Ethereum network usage closely. A recovery in activity could signal renewed interest and capital inflows. Similarly, rising USDT USDC trends would indicate stronger buying intent. Market cycles often include periods of low activity. These phases test investor patience and confidence. Understanding these patterns helps traders make informed decisions.
Final Thoughts On The Current Market Phase
The drop in stablecoin activity highlights a cautious market environment. Investors appear to wait for clearer signals before committing capital. This behavior has reduced crypto buying power and slowed Ethereum network usage.
While the short term outlook remains uncertain, such phases often create opportunities. Traders who track stablecoin trends can gain an edge. Monitoring these indicators helps identify potential market reversals. A recovery in stablecoin activity could quickly change sentiment. Until then, the market may continue to move with limited momentum.  Short
Short
Peter Thiel Sells Entire Stake in Eth Treasury Firm ETHZillaBillionaire investor Peter Thiel and affiliated Founders Fund entities have fully exited their position in Ethereum treasury firm ETHZilla, according to a 13G filing with the US Securities and Exchange Commission.
The filing shows zero ownership in the company as of Dec. 31, 2025, down from a 7.5% stake disclosed in August 2025. The move marks a full reversal of what was once seen as a major institutional endorsement of corporate Ethereum treasury strategies.
Thiel’s investment was initially revealed when ETHZilla rebranded from biotech company 180 Life Sciences and shifted to a digital asset treasury model. The disclosure pushed the stock up more than 90% in a single trading session at the time.
Following news of the full exit, ETHZilla shares fell nearly 7% in premarket trading to around $3.20. The stock now trades roughly 97% below its peak of over $107 reached last August.
ETHZilla Cuts Ether Holdings and Changes Strategy
ETHZilla launched its Ethereum treasury strategy on Aug. 18, 2025, after raising $565 million from more than 60 investors, including Electric Capital, Polychain Capital, and GSR.
The company aimed to become an Ethereum-focused accumulation vehicle that would hold ETH and generate yield through staking. At its peak, the company held more than 100,000 Ether.
However, the firm began reducing its holdings as market conditions weakened and debt obligations increased. In October, ETHZilla sold about $40 million worth of Ether to fund a $250 million stock repurchase program.
In December, the company sold an additional 24,291 ETH valued at $74.5 million to redeem senior secured convertible notes.
The company currently holds 69,802 ETH, valued at roughly $139 million to $140 million at current market prices. The position ranks ETHZilla as the sixth-largest corporate holder of Ethereum.
The firm said its future value will be driven by revenue and cash flow from real-world asset tokenization rather than direct crypto accumulation.
Pivot Toward Tokenization and New Revenue Streams
ETHZilla has shifted its focus toward tokenization initiatives. On Feb. 5, the company acquired a portfolio of 95 manufactured and modular home loans for about $4.7 million, which it plans to tokenize on an Ethereum Layer 2 network with an expected annualized yield of 10.36%.
The firm also purchased two CFM56-7B24 aircraft engines for tokenization through the Liquidity.io platform, an SEC-regulated alternative trading system. It recently launched a tokenized aviation product offering equity exposure to leased jet engines.
Short 
Harvard Among Top 20 Holders of iShares Bitcoin TrustHarvard University has made a striking move in its investment strategy. The university’s endowment now holds a bigger position in Bitcoin ETFs than in any individual stock. Specifically, Harvard tripled its stake in the iShares Bitcoin Trust ( NASDAQ:IBIT ), making it the largest publicly disclosed U.S. equity holding for the endowment.Harvard University’s Bitcoin ETFs Outweigh Traditional Stocks
According to recent SEC filings, Harvard now holds approximately $442.8 million in Bitcoin ETFs. By comparison, the university’s position in Alphabet Inc. stock is around $114 million. Harvard also holds $235.1 million in SPDR Gold Trust ( AMEX:GLD ). These figures show that Bitcoin is now taking a key role in one of the world’s most prestigious endowment portfolios.
The endowment owns 6.8 million shares of NASDAQ:IBIT , which places Harvard among the top 20 largest investors in the fund. This move signals that institutional investors are increasingly willing to treat Bitcoin as a core component of diversified portfolios.
Broader Institutional Bitcoin Adoption
Harvard is not alone in this trend. Other university endowments, such as Brown and Emory, have also started adding Bitcoin-related investments to their holdings. These actions suggest that even traditionally conservative investors are becoming more comfortable with digital assets.
By expanding its Bitcoin ETF stake, Harvard is demonstrating confidence in the long-term potential of cryptocurrency. It also reflects a shift in thinking, where digital assets are viewed as part of a balanced investment strategy alongside traditional equities and commodities like gold.
Implications for Investors
This disclosure may influence other institutional and individual investors. If Harvard and similar endowments continue to increase crypto exposure, more conservative investors might feel encouraged to explore Bitcoin and related ETFs. Additionally, the move highlights how ETFs can provide a regulated, transparent way to invest in digital assets without directly holding cryptocurrencies.
Finally, Harvard’s strategy underscores the growing role of cryptocurrency in mainstream finance. Bitcoin ETFs are now not just speculative instruments but significant tools for portfolio diversification. As more institutions adopt crypto, the trend may continue to reshape investment strategies worldwide. Short 
 Short
Short
BTCUSD: Neckline at $74,434 Under Pressure3 Drive s target aligns with confirmed Head & Shoulders risk
BITSTAMP:BTCUSD
BITSTAMP:BTCUSD has completed the right shoulder of the Head & Shoulders structure, and price is actively pressuring the neckline at $74,434.
At the same time, the 3 Drives reversal pattern remains fully valid, with its default harmonic target at $49,577.
This is no longer a premature structure.
We now have two independent reversal patterns pointing to the same downside target zone.
Technical state:
Head & Shoulders → confirmed structure, neckline: $74,434
3 Drives → confirmed, target: $49,577
Safe Trades,
André Cardoso Short 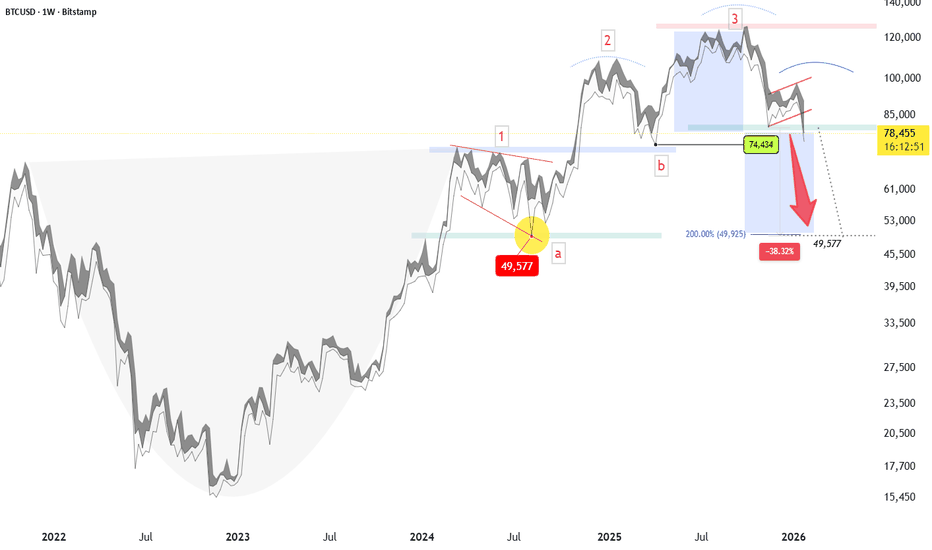
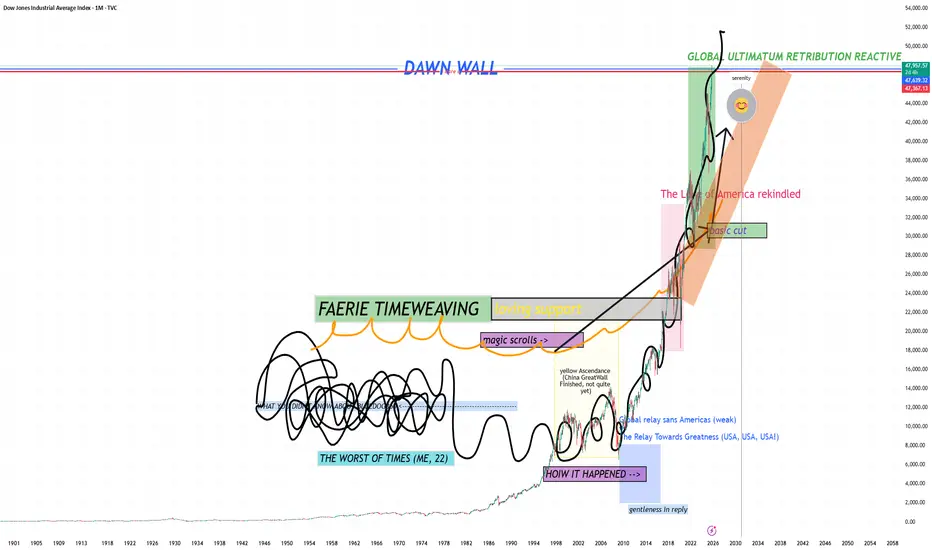
Before DOW 50K Happens (DJI long call for holders)Remember the future. Beware of the past. This time it's different. That's all.
I recommend studying Richard Wyckoff Stock Trading Technique, but not Tape Reading because that information is past its prime, in my opinion ;)
There's nothing left but upward ascent for humanity in my view. This is to do with spiritual reasons that many of us traders are privy to in our inner circles.
This chart is directed guidance towards the g20 group and the G7 group of Countries we call Home on Earth protectors.
We use capitalization as necessary to achieve the desired effect, affect, or required attribute enrichment in order to AVOID City 17, and not have to go back to the old ways of fearing totalitarian rule.
I posit that Donald Trump, The President of the United States of America, will eventually reply to my Christmas letter from 1993 and finish Home Alone 3, but I degress.
Some of us write letters. This is one such letter to the public; I used to write letters to Bill Gates on an IBM PS2, if you know your stuff.
This is my final chart, at least for a while. I always say something like that when I post a grand prediction like this one.
I bid you all well, and hope you find fruitfulness in your future life endeavors.
BLUEDOG OUT Long 
 Long
Long