Short
Short
 Long
Long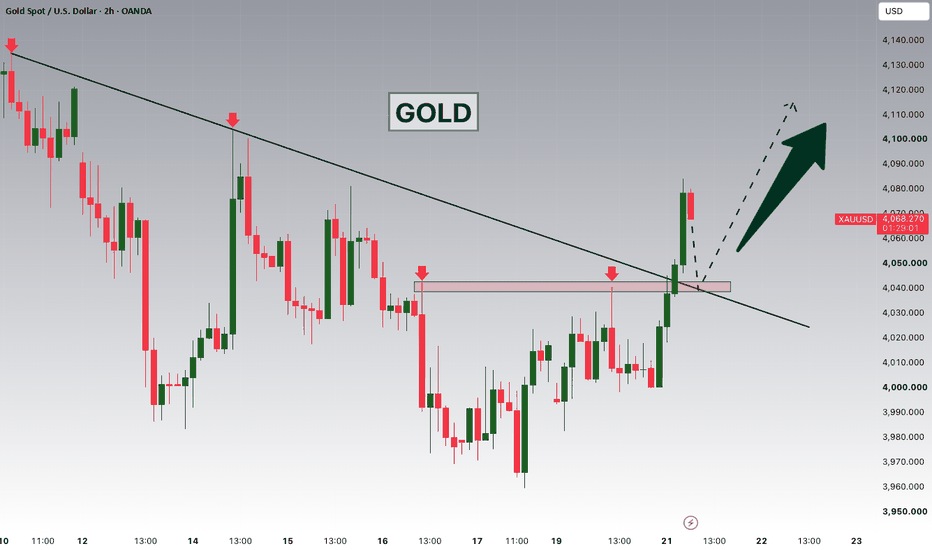
 Long
Long
 Long
Long
 Long
Long
Is understanding trends the core of trading?Gold Price Analysis: Gold prices have been under pressure at the 4200 level and have been fluctuating downwards. Recently, prices have repeatedly tested the 4000 mark, a key support level, with intense competition around this level. In the short term, prices are in a weak, volatile state without a clear directional direction, but the overall downtrend remains clear. Each rebound has been met with resistance at the downtrend line, and the highs of these rebounds are slowly declining. On the 4-hour chart, we can clearly see that gold is experiencing a volatile decline, with the lows already testing the key support area of 3960. If the current downward momentum continues, the possibility of new lows cannot be ruled out, given the continued weakness on the weekly chart.
Gold Technical Analysis: On the 4-hour chart, gold prices are in a downward channel, with the Bollinger Bands continuing to widen downwards and multiple moving averages providing resistance. However, the KDJ indicator has turned upwards from the oversold zone, suggesting a short-term technical rebound, but the upside potential is limited. The weekly chart has closed lower for two consecutive weeks, with short-term moving averages diverging downwards, indicating a clear downtrend. However, the KDJ indicator has entered oversold territory, suggesting that the downward momentum will gradually slow down. Overall, gold prices are currently in a reasonable consolidation phase after the previous surge, forming a descending triangle pattern around $4,000, with increasing divergence between bulls and bears. Yesterday, gold tested the downtrend line at $4040 but subsequently fell back. Those who have been following this trend know the importance of the $4040 level and advised considering short positions targeting $4010-$4000. The downward trend in gold continues, and for the bulls to see a rebound, they must break out of this downward trend, starting with the resistance level of the 4-hour downtrend channel at $4040. Judging from the current trend, the 4000 mark has shown some resilience and has been successfully held. If the closing price falls below the 4000 mark for two consecutive days, the downside risk will increase. In summary, the recommended trading strategy for gold is to primarily sell on rallies and secondarily buy on dips. The key resistance level to watch in the short term is 4040-4050, while the key support level is 3980-3960. Please stay tuned for further updates. Please follow the trading signals closely. Short 
LLOYDSMELloyds Metals & Energy Ltd. (CMP ₹1,907.00, NSE: LLOYDSME)
The SmartWay Research Desk | 21 July 2026
A Nagpur‑based iron ore mining and sponge iron company, incorporated in 1979. Lloyds Metals & Energy operates across iron ore mining, sponge iron, power generation, and steel manufacturing, with strong presence in Maharashtra and expansion into downstream steel products.
Promoter Holding (Mar 2026): Gupta Family — 74.95% stake (no pledges)
FY22–FY26 Snapshot
Revenue Growth: FY26 revenue ₹6,842 Cr vs ₹5,912 Cr in FY25 (+15.7% YoY). → Good
Net Profit: FY26 PAT ₹1,212 Cr vs ₹1,042 Cr in FY25 (+16.3% YoY). → Good
Operating Margin: FY26 EBITDA ₹2,012 Cr, margin 29.4% vs 28.6% last year (+80 bps). → Good
Equity Capital: Stable, face value ₹1. → Good
Dividend Policy: Dividend ₹5.00/share declared for FY26. → Good
Asset Building: Investments in steel plant expansion and captive power projects. → Good
Sales: Strong demand from iron ore mining and sponge iron supply. → Good
Expense: Raw material and power costs remain volatile. → Neutral/Good
EPS: FY26 EPS ₹38.25 vs ₹32.90 last year (+16.2%). → Good
Institutional Interest & Ownership Trends (Mar 2026)
Promoter Holding: 74.95% (no pledges)
FII Holding: 6.12%
DII Holding: 10.34%
Retail & Others: 8.59%
Strategic Moves & Innovations
Expansion in iron ore mining capacity in Gadchiroli.
Focus on integrated steel plant development.
Partnerships with state utilities for captive power supply.
Diversification into downstream steel products and alloys.
Cash Flow & Balance Sheet Strength
Market cap ~₹45,800 Cr.
Debt‑to‑equity ratio ~0.38 (moderate leverage).
Book value per share ₹182.40; P/B ~10.5.
EPS (TTM) ₹38.25; P/E ~49.8.
Risk Factors
High P/E ratio ~49.8, indicating premium valuations.
Dependence on iron ore mining approvals and commodity cycles.
Exposure to steel price volatility.
Competition from JSW Steel, Tata Steel, and SAIL.
Investor Takeaway
Lloyds Metals & Energy has delivered robust FY26 performance, supported by iron ore mining expansion, sponge iron demand, and steel plant investments. With strong promoter backing, dividend payouts, and integrated growth strategy, Lloyds remains a premium mid‑cap steel & mining play. At CMP ₹1,907.00, valuations are expensive (P/E ~49.8, P/B ~10.5), reflecting growth expectations but also sectoral risks.  Long
Long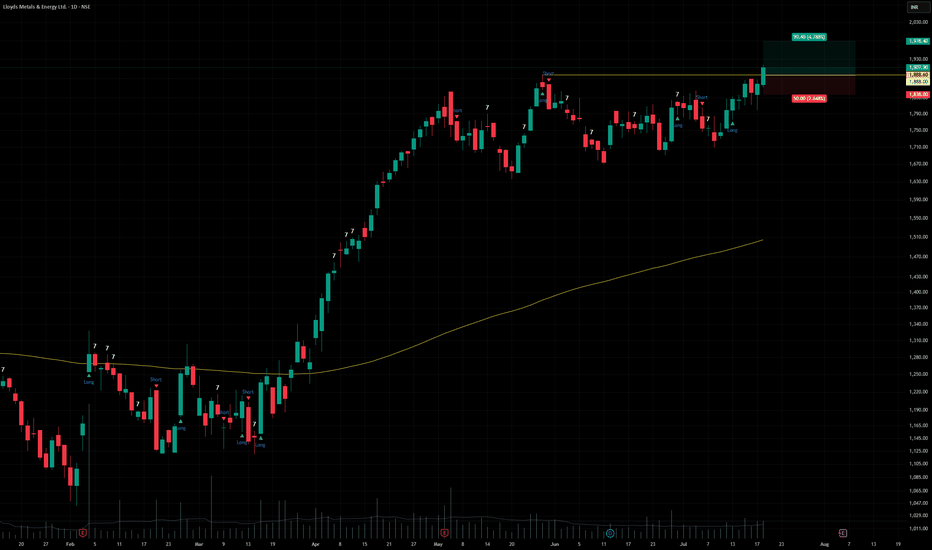
BREAKOUT PULLBACK TRENDANALYSIS SWINGTRADING CRYPTOCURRENCYBitcoin is currently approaching a key demand zone between 64,680 and 64,800. If price reacts positively from this area and buyers step in, I'll be looking for a continuation toward the following targets.
Trade Plan:
Long Entry: 64,680–64,800
Stop Loss: 64,179
TP1: 66,470
TP2: 67,290
TP3: 67,920
This setup is based on the expectation that the demand zone will hold. A break below the stop-loss level would invalidate the bullish scenario.
As always, wait for confirmation and manage your risk.
This is my personal market analysis and not financial advice. Long 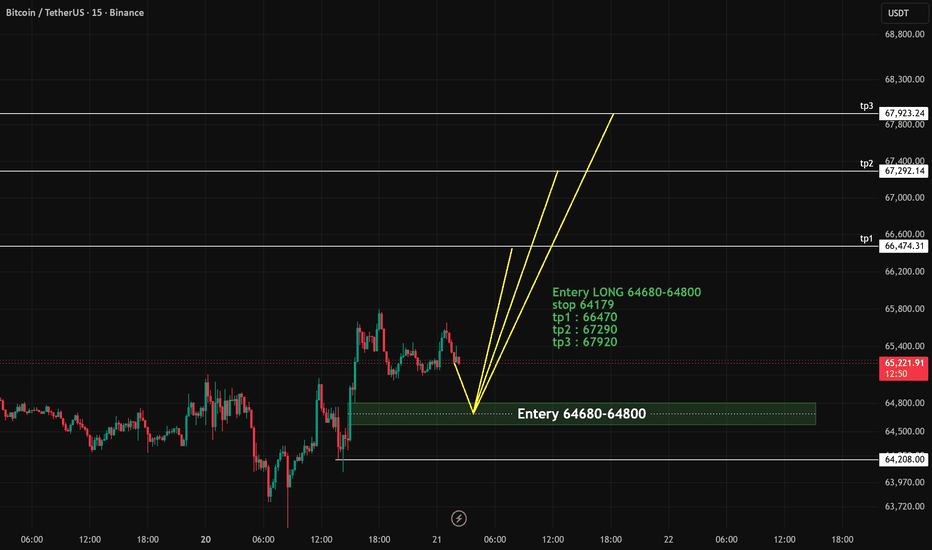
Bitcoin Bulls Eye Breakout Above $65,555Bitcoin continues to carve out a series of higher highs and higher lows on the H4 timeframe while compressing beneath resistance at $65,555. The level has already rejected one false breakout, with another test arriving in early Asian trade today. Importantly, the pullback from resistance has so far been shallow, suggesting buyers remain willing to step in on dips and increasing the likelihood of another attempt at a more sustained breakout.
The oscillators continue to favour upside. RSI (14) sits above 50 at 60.6, while MACD has staged a bullish crossover and continues to trend higher in positive territory, reinforcing the improving momentum picture.
Rather than chasing a breakout preemptively, I'd prefer to wait for confirmation. Should the price break above $65,555 and hold, followed by a successful backtest and bounce from the level as support, long positions could be considered given the improved risk-reward dynamics. Initial upside targets would be the June 18 swing high of $64600 before attention turns to $67,260, the June 16 peak.
Failure to hold above $65,555 after a breakout would weaken the bullish setup, while a break back beneath the rising trendline and recent higher lows would invalidate the immediate upside bias.
One potential catalyst worth watching is this week's heavyweight technology earnings calendar. SK Hynix reports on Wednesday morning in Asia, followed by Alphabet and Tesla in the U.S. before Intel on Thursday. Given the sizeable drawdown already seen across many AI-related names, particularly memory and semiconductor stocks, the prospect of positive earnings surprises may be enough to trigger a squeeze higher in risk assets. Bitcoin has, at times, traded alongside broader risk appetite, suggesting it could benefit if that were to occur.
That said, the relationship is far from perfect. Some momentum-focused traders who once gravitated towards crypto have likely shifted into AI equities, meaning strong performance in technology stocks could just as easily divert flows away from Bitcoin. Long 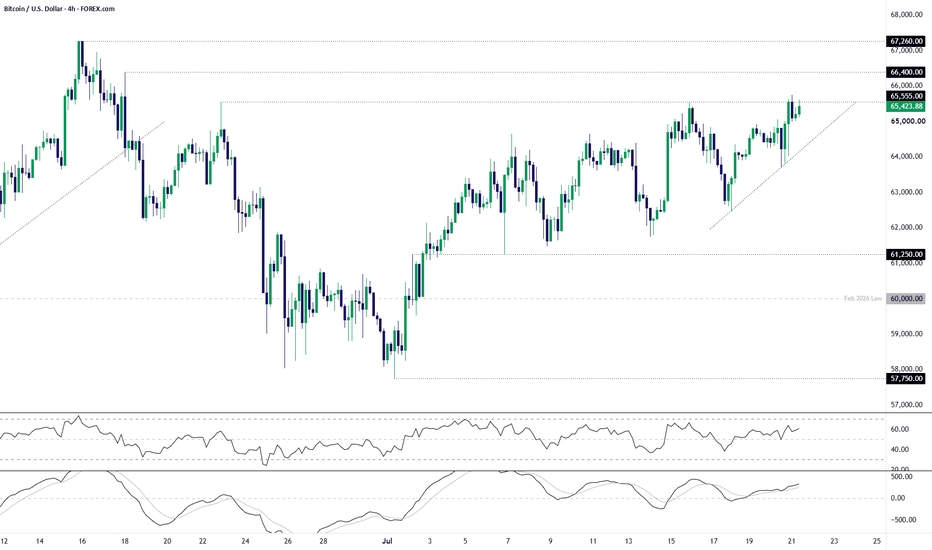
Long 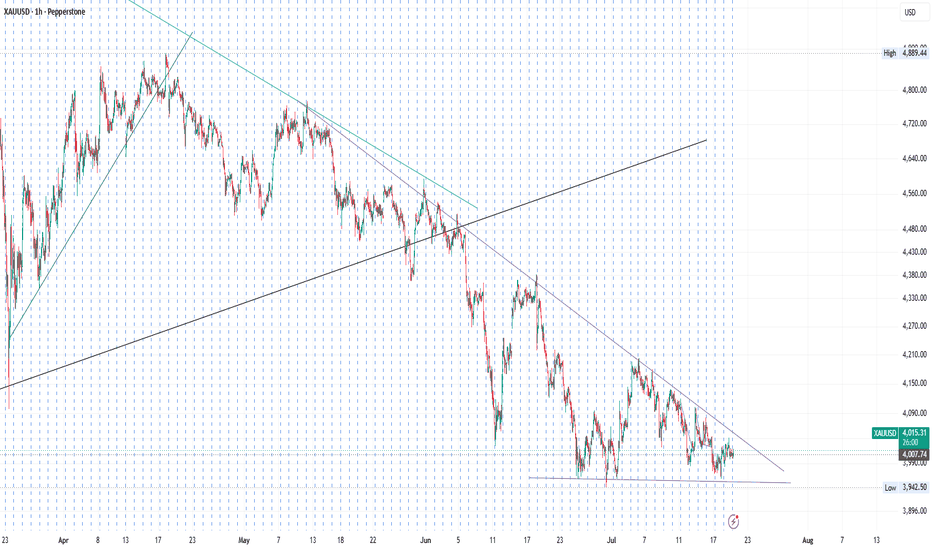
ETH Analyses-11, [July 21, 2026]Welcome to my page! I share daily technical analyses of Ethereum and other charts here.
BINANCE:ETHUSDT
💡 Market Analysis:
The price is currently compressing within a wedge pattern and testing the upper trendline resistance. We anticipate a rejection toward the key support at 1,670.00 before a strong breakout with an 80% candle body triggers a new bullish trend.
Key Support & Resistance:
Key Resistance: 2,000.00 - 2,250.00
Key Support Area: 1,670.00 - 1,850.00
🎯 Trade Entry & Exit Plan:
Entry : Breakout/Pullback of trendline or key zones with >80% candle body and two waves outside the range.
Stop Loss : Behind the last wave or the last breakout candle with a large body.
Take Profit : Minimum R:R 2, with further targets at major horizontal levels (2,000.00 and 2,250.00).
⚠️ Risk Management:
Maximum 1% risk per trade.
❤️ Please share your thoughts and comments on this analysis!  Long
Long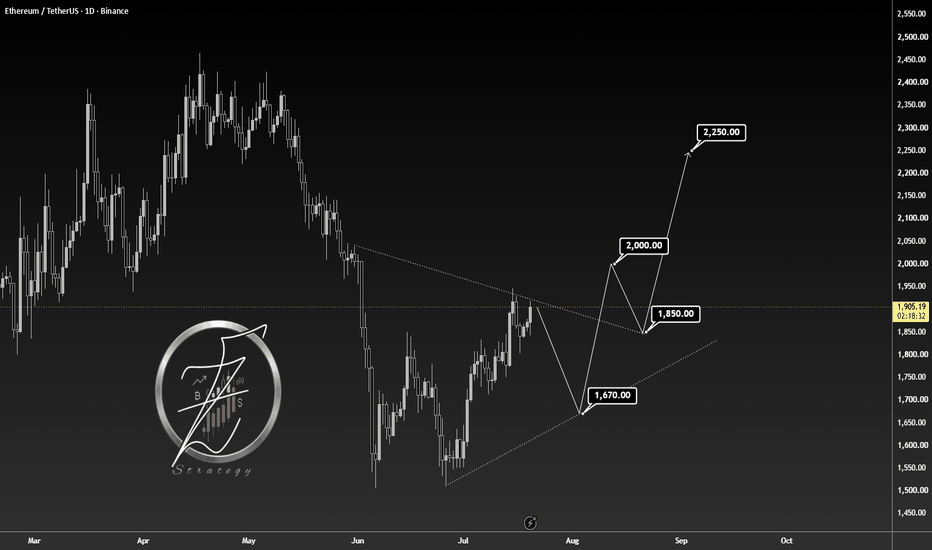
 Long
Long
Tesla, Inc.(TSLA): Price Is Approaching Low Support LineTesla stock (TSLA) is trading around $371-$372, experiencing minor volatility ahead of the company's highly anticipated Q2 2026 earnings report scheduled for after the market closes on Wednesday, July 22. Investors are heavily focused on profit margins, projected capital expenditures, and broader artificial intelligence (A1) scaling.
Technical Outlook:
Stock is positioned on a downtrend momentum, trending on a bearish channel, with Lower lows and highs. Price is gradually heading down to the trend support, in respect of the structure. We anticipating a buy pullback, between $353-$363.
Key Points:
A confirmed reverse above this levels, activates a buy position, eyeing $400, as next potential bullish.
Thanks for reading.  Long
Long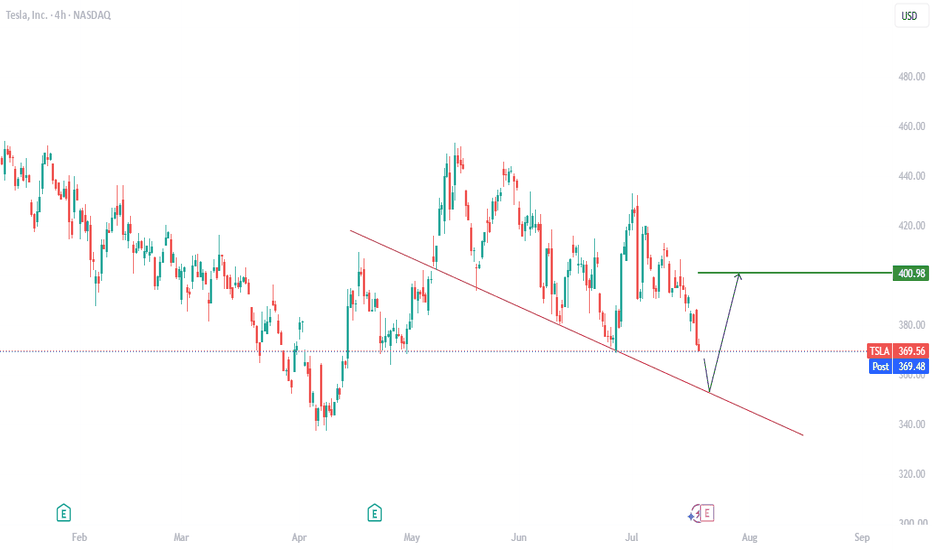
XAUUSD-Bears tighten their grip, is the road to 3000+ now open?The escalating conflict between the US and Iran has led to a sharp rise in oil prices, triggering market concerns about inflation and creating the most dangerous window for the FOMC. This has deepened market expectations for a Fed rate hike, thereby suppressing gold prices.
From the current market structure, gold has been repeatedly resisted by the downtrend line during its rebounds. The downtrend line continues to act as strong resistance, with rebound highs gradually declining along the trend line and several clear resistance shadows appearing, further compressing the upside potential of gold. This also means that bears still hold the upper hand, and the current supply zone is the 4030-4050 area.
Based on the 2-hour chart, the price has repeatedly tested lower levels and rebounded during its downward oscillation along the descending trendline. The extended line formed by these structural lows serves as the current support level for the bulls, with the current demand zone located at 3960-3940.
It is worth noting that if the 3960-3940 demand zone is effectively broken, further downside potential will open up. The liquidity in this area could translate into accelerated downward pressure, potentially forming a new downtrend testing the 3900 level, or even continuing down to the 3860-3840 area.
Trading Logic:
Before the descending trendline is broken, the market remains under bearish control. Gold is more likely to decline. Therefore, until the market structure changes, selling on rallies remains the primary trading strategy.
Trading Strategy:
Primary strategy: Entry - Focus on the 4020-4040 range, with a bearish bias(Invalidation: 4050).
Alternative strategy: Entry - Focus on the 39865-3945 range, with a bullish bias (Invalidation: 3935).
The above is not investment advice, but for learning and discussion purposes only! Short 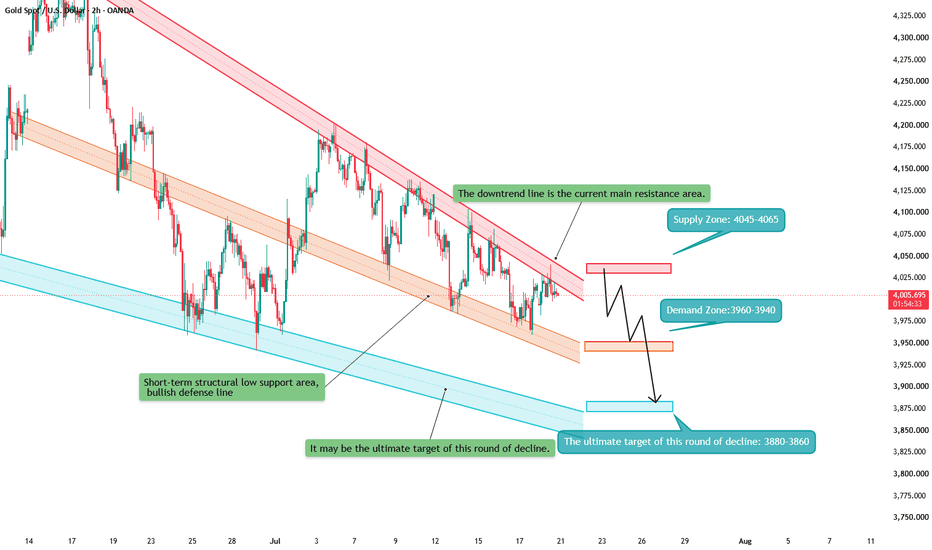
 Long
Long
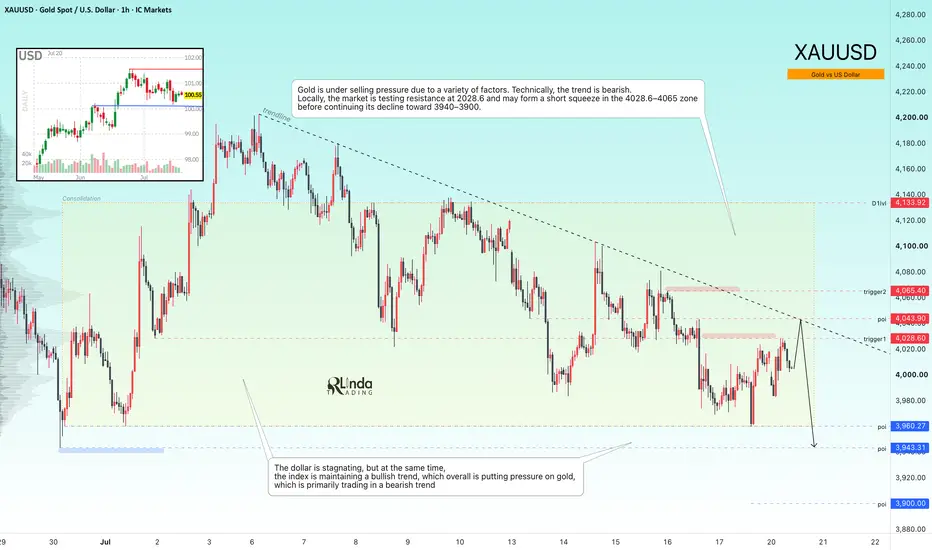
GOLD - A short squeeze before the decline continues toward 3900ICMARKETS:XAUUSD is hovering around the $4,000 mark on Monday, caught between bullish and bearish pressure as markets digest the ongoing escalation of tensions between the U.S. and Iran, while this week's U.S. economic calendar remains relatively light
The U.S. dollar remains in consolidation, although the Dollar Index (DXY) continues to maintain its broader bullish trend. Gold remains under pressure, and the daily technical outlook continues to favor the bears, limiting the potential for a sustained recovery. At this stage, there are few signs that this scenario will change in the near term.
Bearish drivers: Escalation of the U.S.–Iran conflict, supporting both the U.S. dollar and oil prices, Hawkish Federal Reserve rhetoric, Bearish technical market structure
Bullish drivers: Geopolitical de-escalation, Weaker-than-expected U.S. macroeconomic data, Profit-taking after recent declines
Resistance levels: 4028, 4043, 4065
Support levels: 3960, 3943, 3900
Gold remains under selling pressure due to a combination of technical and fundamental factors. The broader trend is still bearish. Technically, the market is confirming resistance around 4028.6, and a short squeeze into the 4028.6–4065 liquidity zone remains possible before the broader downtrend resumes toward 3940–3900
Best regards,
R. Linda Short 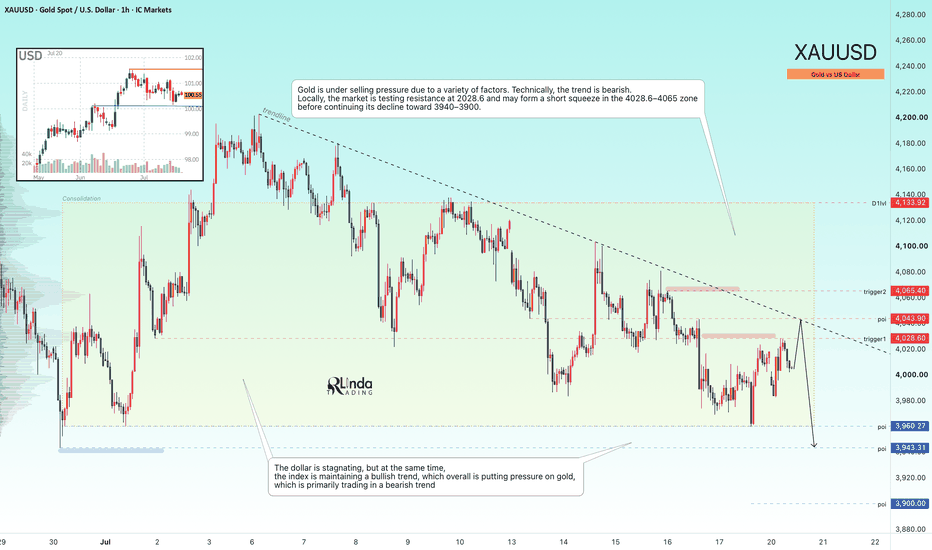
The strategy of selling on rallies continues to be validated!During the Asian and European sessions, I clearly indicated that the key resistance level to watch was the 4030-4040 area. Due to short-term news-driven stimuli, gold quickly surged to around 4040 before encountering resistance and falling back. We simultaneously placed short orders around 4037, and the price subsequently declined as expected, falling to a low of around 4006, allowing our short orders to be successfully closed.
By adhering to the strategy of selling on rallies throughout the day, we have once again successfully profited. We have accurately grasped the market rhythm for several consecutive trading days, and our trading strategy continues to be validated by the market.
From the chart, the Asian and European sessions remained range-bound, with limited competition between bulls and bears, resulting in relatively low market volatility. The price is currently still trading within the 4050–3982 range.
It should be noted that today's few minor rebounds are more of a technical correction after short sellers took profits, coupled with some short-term safe-haven funds flowing in to drive up prices. They are not a trend reversal signal. The bullish momentum in the market is still insufficient, and the long-term bearish structure has not changed substantially. Therefore, the overall trading strategy should remain to sell on rallies when prices are under pressure. Key short-term focus areas:
📍 First resistance: 4030–4040 area (near the intraday rebound high);
📍 Strong resistance: 4070–4080 area. If the price rebounds to this level and shows signs of pressure, it remains a key area to watch for shorting opportunities;
📍 Support: 3950–3943 area, a crucial support level where the price previously tested and stabilized after hitting a low.
Before the trend changes, any rebound should be viewed as a technical correction rather than a trend reversal. The key to stable profits is to patiently wait for high-probability opportunities, trade with the trend, and strictly follow the trading plan. Short 
Long 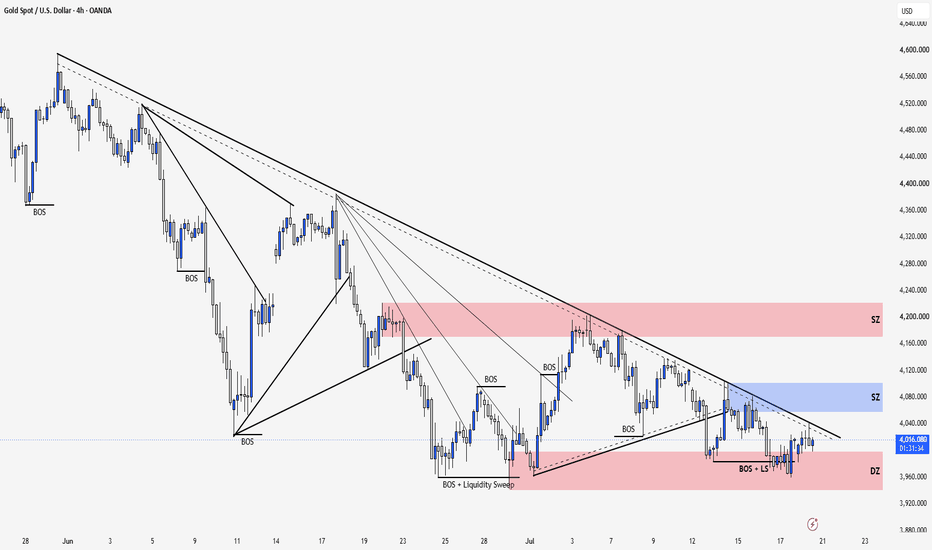

 Long
Long