ADANIPORTS — SWING TRADING IDEA | Q2 FY27 RESULTSANALYSIS
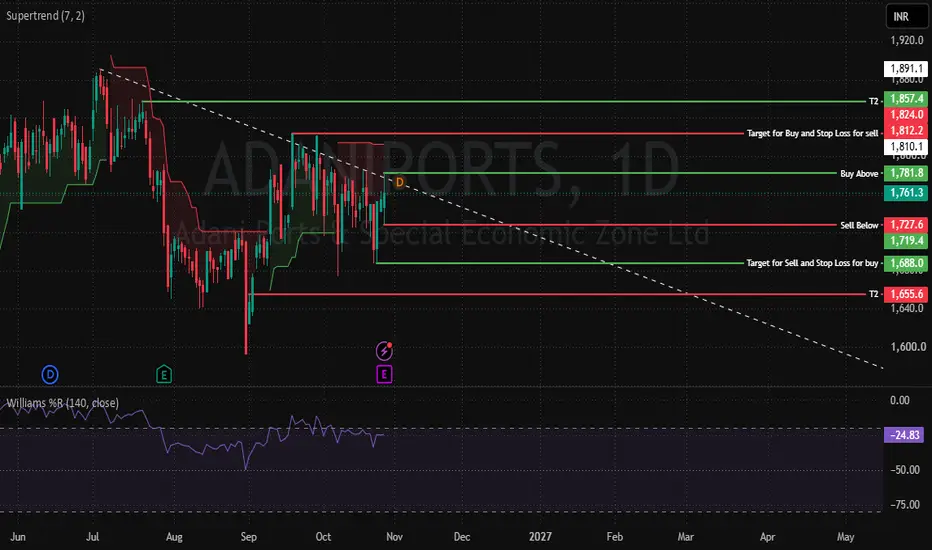
ADANI PORTS AND SPECIAL ECONOMIC ZONE LTD. (ADANIPORTS) is approaching a key directional decision zone, with a bullish trigger above ₹1,781.80 and a bearish trigger below ₹1,727.60.
The supplied CMP is ₹1,755.30, placing the stock between the two key trigger levels.
A decisive breakout above ₹1,781.80 could signal bullish continuation toward ₹1,812.20 and the higher resistance zone of ₹1,824.00–₹1,857.40.
A sustained breakdown below ₹1,727.60 could shift short-term momentum to the down
Alice Blue publications
CHOLAFIN — SWING TRADING IDEA | Q2 FY27 RESULTSANALYSIS
CHOLAMANDALAM INVESTMENT AND FINANCE COMPANY LTD. (CHOLAFIN) is showing potential bullish continuation following a strong price move.
The stock's reported CMP is ₹1,547.00, up 5.31%, indicating strong positive price momentum in the supplied snapshot.
The proposed strategy is to wait for a retracement into the ₹1,508.00–₹1,522.00 demand zone rather than chase the sharp upward move.
A sustained hold above the demand zone could provide an opportunity for bullish continuation toward ₹1,621
VEDL — VEDANTA LTD. | SWING TRADING IDEAANALYSIS
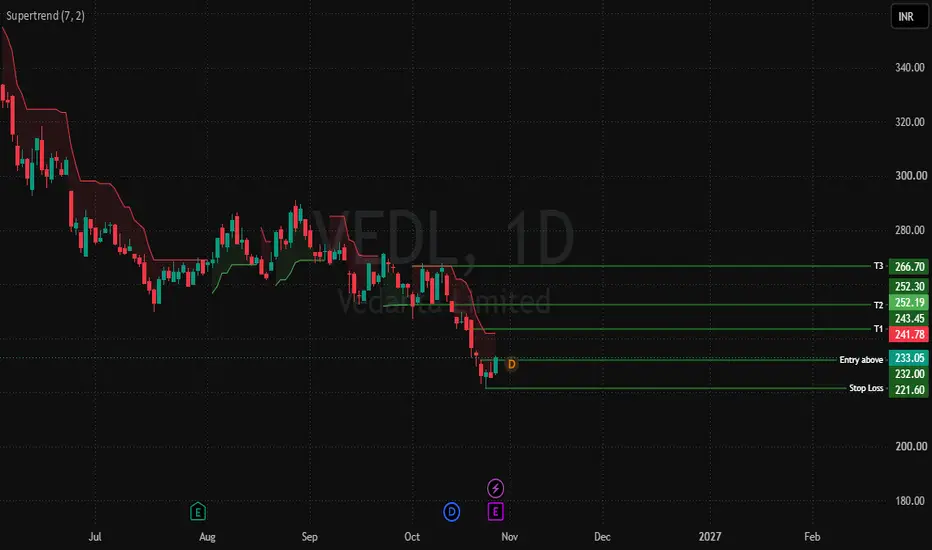
VEDANTA LTD. (VEDL) is approaching a potential bullish swing breakout above the recent high of ₹232.75.
The proposed setup requires a decisive daily candle close above ₹233.00, followed by a successful retest of the breakout zone.
The chart snapshot shows a recent high of ₹232.75 and a low of ₹226.40, defining the immediate price structure.
The displayed Supertrend is near ₹241.78, indicating a potential overhead resistance zone that price must overcome.
A sustained move above ₹233.00
SBIN — BULLISH SWING REVERSAL ABOVE MONTHLY VWAPANALYSIS
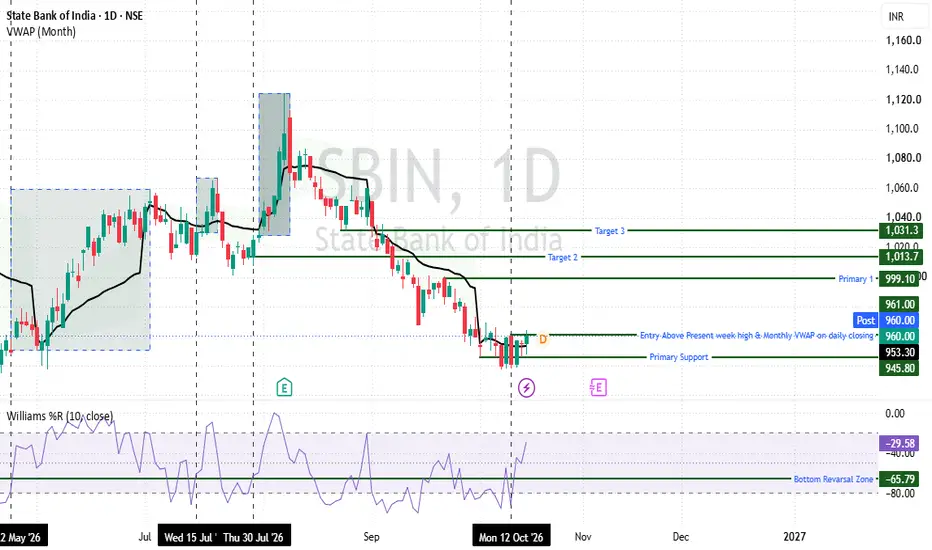
STATE BANK OF INDIA (SBIN) is showing signs of a potential bullish swing reversal following a prolonged correction.
The setup combines Williams %R (10) momentum recovery with a breakout above the Monthly VWAP and present week's high.
W%R (10) has moved above the critical -65 zone, indicating a recovery in momentum from weaker levels.
The current W%R reading is around -50.86, suggesting improving buying momentum.
Price is consolidating around the Monthly VWAP near ₹952.88.
A decisive da
BLUE STAR LIMITED (NSE) | OCTOBER RALLY SETUPANALYSIS
BLUE STAR is showing a potential October recovery rally following the June–September downtrend.
The stock found a major swing-low support zone around ₹1,430–₹1,450 during September and subsequently started recovering.
The current price is around ₹1,601, approaching the immediate breakout resistance zone at ₹1,610–₹1,620.
Price is trading above the 9-day Simple Moving Average (SMA 9) at ₹1,547.7, indicating improving short-term momentum.
The Supertrend (7, 2) is at ₹1,494.5, below the c
Price Action & Setup Summary : ENRINANALYSIS
Trend & Structure: The stock is showing a support bounce and a bullish reversal attempt on the daily timeframe.
Supertrend (7, 2): Supertrend is at 3,062.8, with price trading above the line, keeping the trend structure bullish and providing dynamic support.
Williams %R (14): -17.47, which is above -20 and indicates strong bullish momentum. The elevated W%R also shows that buyers are maintaining control, although the stock is approaching an overbought zone.
Key Trigger Structure: A sus
BDL — DAILY SWING TRADE IDEA ANALYSISANALYSIS
Trend: Bullish reversal attempt after a sharp correction.
LTP: ₹1,180.50
Today's Price Action: Stock is showing a recovery from the recent low with a strong bullish bounce and is currently attempting to reclaim the Supertrend zone.
Supertrend 7,2: ₹1,196.20 — the key trend-flip confirmation level visible on the chart.
Breakout Trigger: ₹1,194.20. Sustained trading above this level can confirm the bullish continuation setup.
Williams %R 21: -69.69 — recovering from the lower zone and in
BULLISH CASE — ICICI PRUDENTIAL AMC (ICICIAMC)Strong AUM Growth: Q1 FY27 mutual-fund quarterly average AUM reached ₹11.17 lakh crore, up 18.3% YoY. citeturn0news4
Profit Growth: Q1 FY27 PAT increased 23.1% YoY to ₹965 crore, while operating revenue rose 17.6%. citeturn0news4
Strong SIP Position: ICICI Prudential AMC had the highest reported SIP-flow market share in the June 2026 quarter at 15.33%. citeturn0search14turn0search16
Industry Tailwind: India's mutual-fund AUM reached a record ₹87.08 lakh crore in August 2026, while SIP
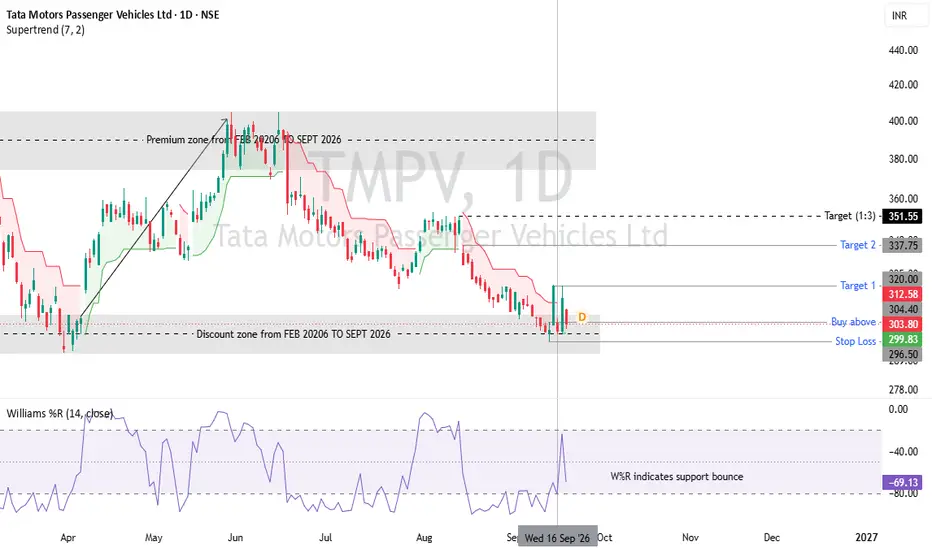
Tata Motors Passenger Vehicles Ltd (1D)Key Technical Levels
Current Price: ₹306.40
Buy Trigger Zone: Above ₹306.40 – ₹308.00
Stop Loss (SL): ₹304.40 (Tight intraday level) / ₹296.50 (Swing low structural support)
Target 1: ₹320.00
Target 2: ₹336.02
Target 3 (1:3 R:R): ₹351.55
Technical Understanding & Indicators
Support Bounce: The price has tested and successfully bounced off the demand zone near ₹296.50–₹300.00.
Williams %R (14): Currently at -58.14, curling upward from overbought/oversold extreme territory, confirming a moment
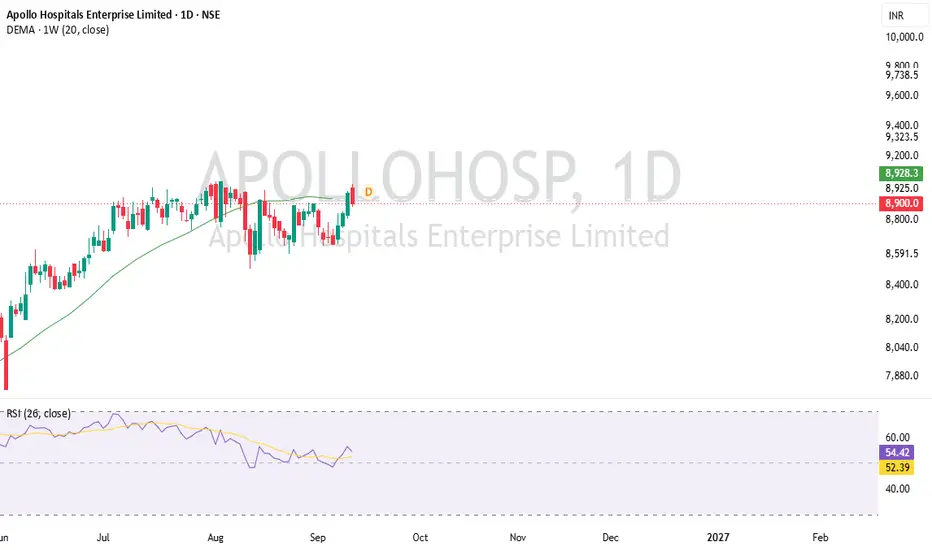
Apollo Hospitals Enterprise Ltd Trend ContinuationApollo Hospitals has completed a Multi-Week Breakout above its prior consolidation zone. Trading well above its 20-Week EMA (₹8,928.30) and all major daily moving averages, the stock is demonstrating strong structural momentum toward fresh highs.
Key Trade Parameters
Entry Range: Current Levels / Re-test zone at ₹8,925 – ₹8,957
Stop Loss: ₹8,591.50 (placed strictly below the recent swing consolidation base)
Target 1: ₹9,323.50 (Initial upside extension)
Target 2: ₹9,738.50 (1-year analyst price
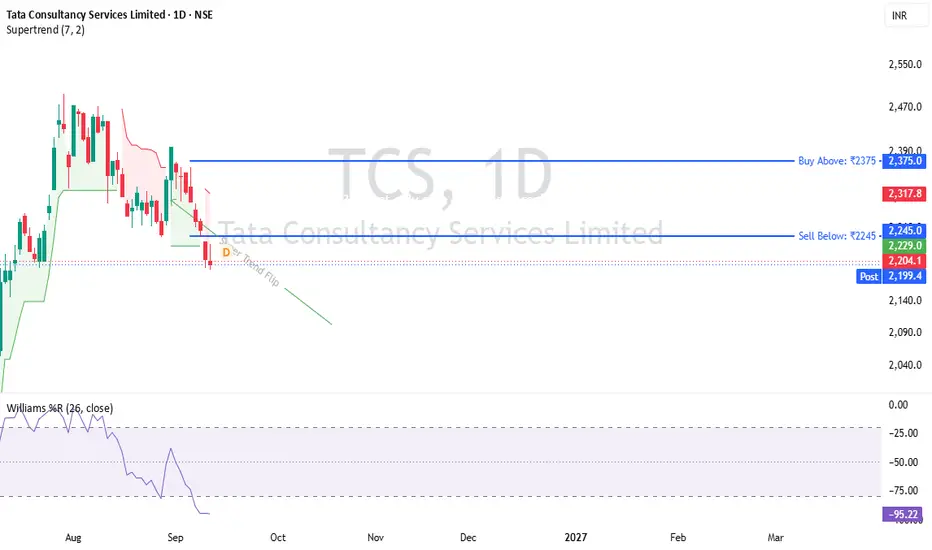
TCS (TCS.BSE) — Bias: Neutral / Range-boundRecent news & context: IT majors like TCS have been sensitive lately to US tech-spending signals and INR/USD moves — no single catalyst here, just consolidation after a sharp bounce.
Price action: Bounced hard off a ₹1976 low (Jul 1) to ₹2494 (Jul 30), then has been chopping in a ₹2250–2370 range for the past 3 weeks — no clear breakout either way yet.
Buy Above: ₹2375 → Target 1: ₹2420, Target 2: ₹2455
Sell Below: ₹2245 → Target 1: ₹2200, Target 2: ₹2150
Range to watch: ₹2245–2375 (act only o
TVS MOTOR Bias: Bullish (buy-on-dip continuation)Recent news & context: TVS Motor's Q2 FY26 results showed a 42% year-on-year jump in net profit to ₹795.5 crore, with revenue up 25.6% YoY, driven by strong premium motorcycle and electric-scooter demand. The stock has been one of the strongest performers in Nifty Auto over the past year, and the EV scooter segment has been a particular growth driver.
Price action: Rallied from ~₹3490 (early July) to a high of ₹4484.7 (Aug 26), then pulled back sharply to ₹4123.5 (Sep 1) — a healthy ~8% pullbac
Reliance Weekly Bias and what encourages a breakout.Looking at the actual weekly closes I already pulled:
Recent 8 weeks have been range-bound between ₹1250–1345, not breaking out either direction
The stock is well below its Jan 2026 high (~₹1611) — this is consolidation, not a breakout setup right now
This week's low (₹1271) tested near the bottom of that range and bounced to close at ₹1301
RELIANCE — Bias: Neutral/Range-bound (watch, not act)
Key resistance: ₹1345–1350 (weekly close above → bullish breakout)
Key support: ₹1250 (weekly close b
JSW Energy Trend Continuation Analysis & Trade PlanJSW Energy Limited (NSE: JSWENERGY) is currently undergoing a short-term pullback and consolidation near the ₹535–₹555 range following recent sector-wide profit-booking
Trade Bias
Overall Bias: Moderately Bullish
Rationale: On the weekly timeframe, the stock has stabilized above its key Supertrend dynamic support line (~₹506.01) and formed higher low structures around the multi-week support level (~₹531.50). Indicators like Williams %R (-62.66) show room for upside, moving away from extreme ov
IREDA SUPPORT BOUNCESupporting Fundamental Drivers
Strong Price Momentum & Reversal: IREDA demonstrated a sharp gain of over 4.5% during recent trading sessions, pushing past ₹120.60 intraday to confirm momentum recovery.
Financing Execution: News of recent debt tie-ups and financial closures (such as financing UP solar projects) continues to underpin renewable energy funding expansion.
Technical Setup & Strategy
Bias: Bullish Swing / Short-term Momentum Reverse
Execution Zone: Entry above ₹115.00 – ₹118.00
Stop L
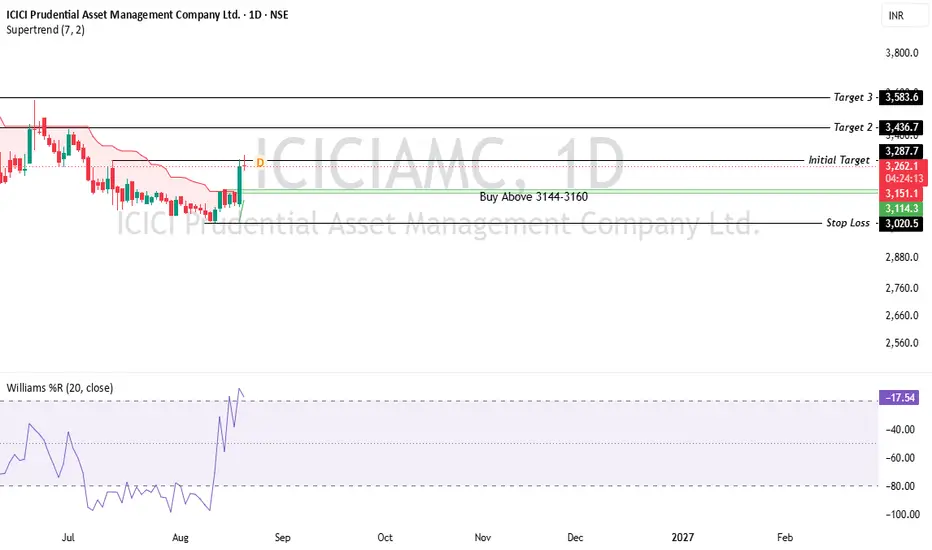
Gorilla Stock: Why ICICIAMC Could Rebound Stron-ReboundTrading Idea: ICICI Prudential Asset Management
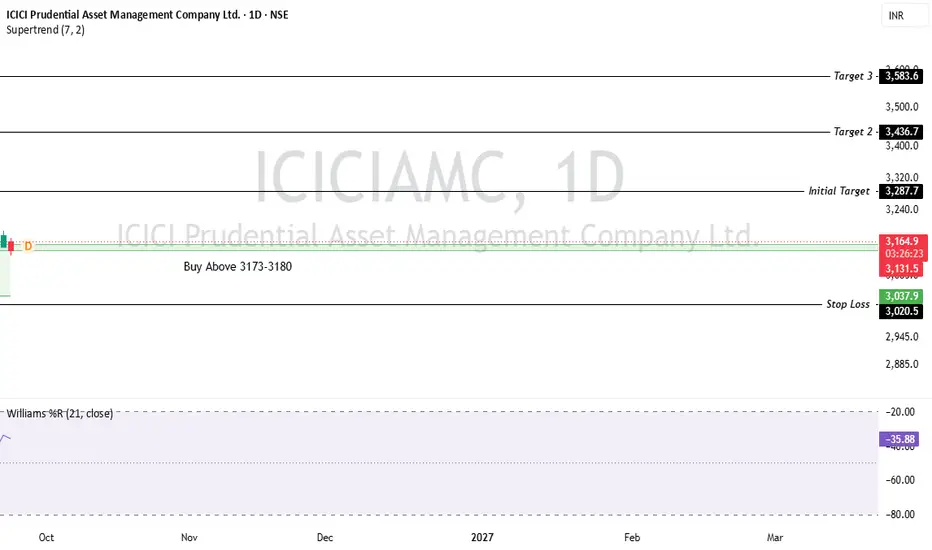
Current Market Price (CMP): 3136.95
Strategy / Bias: Swing Buy on Dip
Entry Zone: ₹3,100 – ₹3,140
Stop Loss (SL): ₹3,020.50 (Below major chart support)
Initial Target: 3287.7
Target 2: 3436.7
Target 3 (Swing): 3583.6
Technical & Fundamental Rationale
Chart Setup: The daily chart indicates support near the ₹3,020 zone. Rebounding off key levels following robust June 2026 quarterly results.
Indicator Confluence: The Supertrend indicator is tightly
TVS MOTOR (TVSMOTOR) — All-Time-High MomentumLast verified price: ATH of ₹4,473.5 hit 10 Aug 2026 (no fresher live tick available to me — check your feed for current LTP before entry) Sector: Auto (2W) | Nifty 200 weight: 0.60%
Catalyst: Fresh all-time high, +49.47% over the past year vs. Sensex -1.59% same period. 11 straight quarters of earnings beats — record net sales (₹16,295 Cr) and PBDIT (₹2,357 Cr) last quarter. Sector-wide confirmation: S&P BSE Auto and Nifty MNC also hit 52-week highs the same week.
Setup: Trading above all key
Tata Capital Ltd. – Bullish Trend ContinuationRecent News & Updates
Strong Q1 Financial Results: Tata Capital reported a 56% YoY jump in consolidated net profit to ₹1,547 crore for Q1, driven by robust AUM expansion and a 25% YoY growth in Net Interest Income (NII)
Expansion into Gold Loans: The company completed the ₹318 crore acquisition of Yogloans, marking its strategic entry into the gold loan segment. It plans to add 500+ branches and scale the portfolio to ₹4,000–₹5,000 crore over the next 2–3 years.
Global Debt Raising: Tata Capital
Technical Analysis of NIFTY 50 (Weekly Chart)Key Technical Observations
Price Action & Current Trend: Nifty is currently trading inside an ascending parallel channel (blue lines) that has been guiding the long-term uptrend. The index is trading around 24,637.70 (weekly candle in progress).
Moving Average (SMA 52): The 52-week Simple Moving Average (SMA 52) sits right at 24,747.63, acting as immediate resistance. Nifty is currently retesting this key baseline after pulling back from lower channel support.
Support & Resistance Channels:
Uppe
Jyoti CNC Automation Limited Weekly BreakoutStock Summary
Jyoti CNC Automation is a manufacturer of simultaneous 5-axis CNC machines and precision metal-cutting equipment in India. The company supplies high-tech CNC turning centers, vertical and horizontal machining centers, and multi-tasking machines across aerospace, defense, automotive, and general engineering sectors.
Current Price: 843.20 (+4.27% intraday)
Day High / Low: 849.00 / 812.05
Key Support (Stop Loss): 795.05
Structural Anchors: Q1 High: 845.20 | Q2 Low: 748.45
Stock Chart
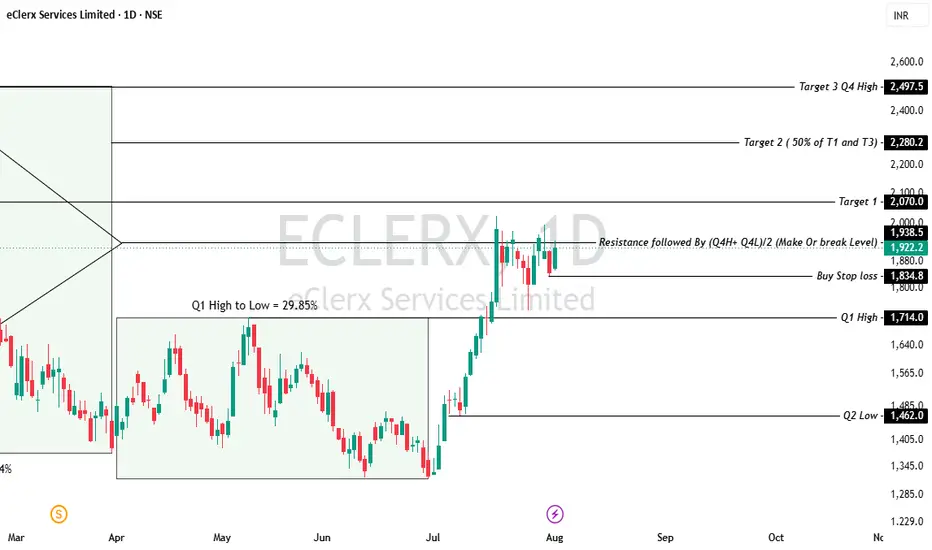
eClerx Services Limited Upcoming Price Action anlysis for Q2Stock Summary
eClerx Services is an IT/ITES company providing business process management, automation, and data analytics solutions to Fortune 2000 enterprises across financial services, digital retail, and technology.
Current Price: 1,925.30 (+4.32% intraday)
Day High / Low: 1,935.50 / 1,852.00
Key Support (Buy Stop): 1,834.80
52-Week / Structural Anchors: Q1 High: 1,714.00 | Q2 Low: 1,462.00
Stock Chart Analysis.
The stock has completed a prolonged bottoming consolidation pattern between 1,30
KFINTECH Chart Analysis: Breakout & Key LevelsQ1 FY27 Financial Performance (Quarter Ended June 2026)
Consolidated Revenue: Reported around ₹367 crore, up 1.26% sequentially from the previous quarter.
Net Profit: Consolidated net profit came in at ₹75.21 crore, registering a mild decline of 2.65% compared to ₹77.26 crore in the preceding quarter.Profitability
Margins: Operating EBITDA margin continues to remain healthy in the 40%+ bracket.
The stock has been showing strong short-term upward momentum on the daily charts, gaining over 9% t
CONCOR: Structural Breakout Fueled by Strong Q1 Perfomance📰 Key News & Catalysts Behind the Surge
1. Q1 FY27 Earnings & Margin Expansion:
CONCOR reported a 7.7% YoY growth in standalone net profit to ₹277.65 crore despite flat revenue, driven by strong operational efficiency and cost management.
The company raised its FY27 volume growth target to 18% with operating guidance of 24–25% margins.
2. Interim Dividend Declaration:
The Board approved a 32% interim dividend of ₹1.60 per share (Record date: August 4, 2026).
3. Strategic Partnerships & Institu
Tata Power Q1 FY27 Analysis: R/R Setup & Levels Ahead of Jul 27Breakdown of earnings expectations for the upcoming Q1 FY27 results announcement on July 27, 2026:
1. Quarter-on-Quarter (QoQ) Expectations vs Q4 FY26
Revenue Outlook (QoQ Seasonality): Historically, Q1 (April–June) experiences peak summer electricity demand across India, driving higher power generation, increased distribution volume across discoms, and elevated peak tariffs. Revenues are generally expected to pick up sequentially over Q4 FY26 (which stood at ~₹15,962–14,900 crore).
Operating Pr