Resistance Zone: 117.87 ~ 129.44
Hello?
Nice to meet you, fellow traders.
If you "follow" me, you can always get new information quickly.
Have a great day.
------------------------------------
Important zones are marked with circles and square boxes.
The 117.87 ~ 129.44 range is a high point zone and corresponds to a resistance zone.
However, if it finds support in this range and rises, there is a possibility of a stair-step upward trend.
Therefore, if it finds support around the 117.87–129.44 range and rises, it is exp
Broadening Wedge
Key Volatility Period: Around July 5th
Hello.
Nice to meet you, fellow traders.
If you "follow" me, you can always get new information quickly.
Have a great day today.
------------------------------------
You must proceed with trading according to your trading strategy by identifying volatility zones or support and resistance points on the chart.
To do this, we use various methods that suit our own criteria.
In that sense, you can use indicators such as the Price Channel or Bollinger Bands.
I use the Price Channel indicator b
Support and resistance range: 372.0 ~ 414.23
Hello?
Hello traders!
If you "Follow" us, you can always get new information quickly.
Have a nice day today.
-------------------------------------
The areas marked with circles are important support and resistance areas.
The current price is located in the range 372.0 to 414.23.
I think that anything below 216.60 is likely to enter the mid- to long-term investment zone.
The start of the uptrend is expected to begin when the price holds above 427.94.
-
The key is whether it can rise abo
Next Volatility Period: Around June 29 (June 28 ~ 30)
Hello?
Nice to meet you, fellow traders.
If you "follow" me, you can always get new information quickly.
Have a great day.
------------------------------------
It appears that the price is testing support near the StochRSI 50 indicator point.
If the price fails to find support and falls, you must check for support in the low zone between DOM (-60) and HA-Low.
At this point, if the price falls below the OBV Low indicator, there is a possibility of a sharp decline, so caution is required wh
Let's find a chart interpretation method that suits you!
Hello.
Nice to meet you, fellow traders.
If you "follow" me, you can always get new information quickly.
Have a great day.
------------------------------------
The method for interpreting the auxiliary indicators StochRSI and OBV is as follows.
I believe that looking at the StochRSI and OBV indicators together can help you understand the waves.
Basically, the StochRSI indicator displays waves based on the 50 point.
This allows you to understand regression to the mean and median, which ar
Support Zone: 0.32031 ~ 0.32406
Hello?
Nice to meet you, fellow traders.
If you "follow" me, you can always get new information quickly.
Have a great day.
-------------------------------------
A high point zone has formed across the range of 0.28503 to 0.34076.
Accordingly, the key question is whether the price can rise above 0.34076 and maintain it.
A strong support zone has formed around 0.18077.
-
A low point zone has formed across the range of 0.32031 to 0.32406.
To break out of the low point zone, the price must
TMCV's Hidden Pattern Finally RevealedFalling Wedge Setup
Stock is trading within a falling wedge pattern with resistance near 400-405 and support at 340-350.
Breakout above 405 can trigger fresh bullish momentum.
Any dip towards 340-350 may offer a buying opportunity.
Pattern is almost complete; wait for breakout confirmation or support retest.
Mid-Term Target: 450+
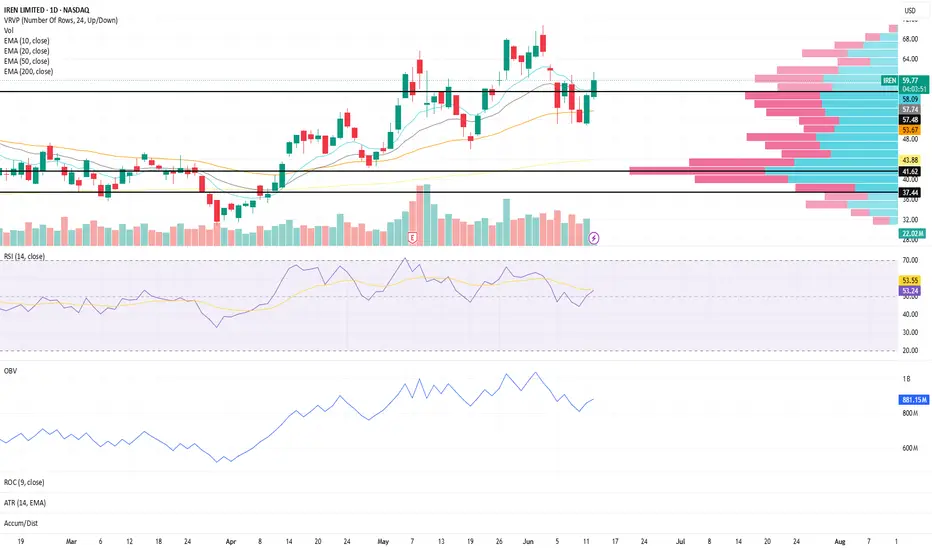
Momentum Above Value Area High | IREN Structure Update IREN continues to show constructive behavior on the daily timeframe as price trades above a key volume profile level.
Price is currently trading above the Value Area High (VAH), suggesting continued acceptance above the upper boundary of the primary value area
The Value Area Low (VAL) remains below current price and represents an area worth monitoring if momentum begins to weaken
The Point of Control (POC) sits below both levels and represents the price where the highest volume has historically
SPY Structure Update (Daily Chart)SPY remains in a constructive trend environment despite today's pullback, with the broader moving average structure continuing to hold.
The 10, 20, 50, and 200 EMAs remain positively aligned
Price continues to trade above all major moving averages, keeping the larger trend structure intact
While short-term momentum has weakened, the overall trend remains constructive until key support areas begin to fail
Momentum conditions have cooled:
RSI is currently near 49, reflecting a notable loss of
is HYPE (hyperliquid) overbought? -SHORT-🙋♀️🙋♂️😃🌍🐮 Hello all 🙋♀️🙋♂️😃🌍🐮
I would like to say I am overall still bearish 🐻🐻❄️🐨🐼 on the market for now as bitcoin fell below a key price of 77k and has continued to fall, I have had my eyes set on 59k BTC price for a couple of months now to finish out the perfect bear market (see previous ideas for more information)
HYPE reached a new ATH of 67 dollars during the crashing market today which is impressive and perpetual futures trades have seen billions of dollars worth of volume.
HDFC BANK Preparing for a Strong Upside Move | Bulls Regaining CHDFC BANK Analysis
HDFC Bank is currently holding a strong support zone near 745 – 750, which is acting as an important demand area for the stock.
The stock is also forming a Descending Broadening Pattern, indicating increasing volatility and the possibility of a strong directional move ahead.
As long as the support zone remains intact, the probability of an upside breakout and bullish momentum continues to remain strong.
Keep an eye on price action near resistance levels for confirmation
RBL BANK Showing Strong Momentum | Bulls Back in ActionRBL BANK | 1-Hour Timeframe Analysis
RBL Bank is currently showing strong momentum on the 1-hour timeframe and forming a bullish Higher High – Higher Low (HH-HL) structure, indicating positive price strength.
The stock is also developing a Broadening Wedge pattern, with a key resistance zone placed near 370 – 375 levels. Interestingly, the previous Higher High resistance is also positioned around the same zone, making it an important breakout area to watch.
On the downside, the stock has a
The key is whether it can break above 3.650
Hello?
Nice to meet you, fellow traders.
If you "follow" me, you can always get new information quickly.
Have a great day.
------------------------------------
If the price maintains above 2.144 and above the M-Signal indicator on the 1M chart, an uptrend is expected to begin.
-
If an uptrend begins,
1st: 3.650
2nd: 7.008
You need to check if it finds support in the vicinity above these levels.
Therefore, the key is whether the price can maintain a level above 2.144.
Since the StochRSI
Start of Uptrend: Upon breakout of 1.5 ~ 1.9669
Hello?
Nice to meet you, fellow traders.
If you "follow" me, you can always get new information quickly.
Have a great day.
------------------------------------
The uptrend for XRP is expected to begin as it breaks upwards through the 1.5 ~ 1.9669 range.
Therefore, we need to observe whether it rises to the 1.5988 level and shows signs of support.
If it fails to rise above 1.5988, we should consider it to be in the mid-to-long-term investment zone and devise appropriate countermeasures.
I
Support Zone: 1964.96 ~ 2111.42
Hello?
Nice to meet you, fellow traders.
If you "follow" me, you can always get new information quickly.
Have a great day today.
------------------------------------
Among the various indicators set on the chart, the ones we should pay attention to are as follows:
1. Trends that reveal the flow of the chart,
2. Support and resistance points that allow you to set trading points
-
The indicators used to indicate the trend are the M-Signal indicators on the 1M, 1W, and 1D charts.
Therefore,
Silver Crashes 18% – Is a Relief Rally Finally Coming?On Friday, in my Silver analysis, I wrote that after testing the major 90 resistance zone, the market could eventually pull back toward the 83 support area.
However, what followed exceeded even my expectations.
Silver didn’t simply correct.
It absolutely collapsed.
The price dropped more than 15k pips, which translated into percentage terms means roughly an 18% decline — an enormous move even for an asset as naturally volatile as Silver.
Just like Gold, the new week started with another wave
SPY Structure Update (Daily Chart)The 10, 20, and 50 EMAs remain in healthy alignment and continue showing constructive upward curvature. The 200 EMA remains below price and is also steadily trending upward, keeping the broader structure constructive across multiple layers.
RSI is currently holding around 68, showing continued participation while remaining in a strong momentum range.
OBV has maintained an upward trend since March 31st and is currently consolidating near recent highs — something I continue watching closely for
Change in Volatility Period: Around May 25 ~ Around June 7
Hello?
Nice to meet you, fellow traders.
If you "follow" me, you can always get new information quickly.
Have a great day today.
------------------------------------
(1D Chart)
It appears that the volatility period has changed as a downtrend line (4) has formed.
The next period of volatility is expected to run from around May 25 to around June 7.
The most important factor is whether the price can maintain its upward trend above the uptrend line (1).
Therefore, I believe the range from 67
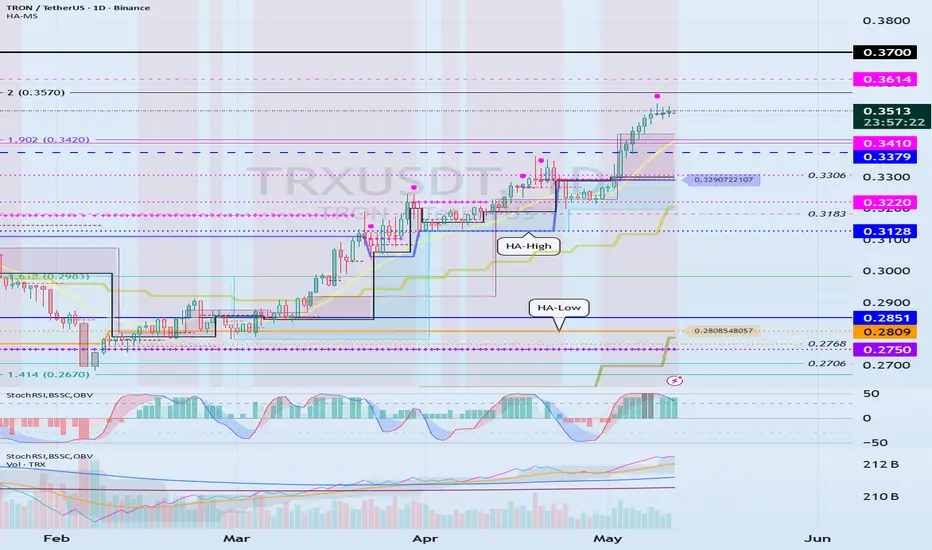
Confirming support in the 0.3410 ~ 0.3614 range
Hello?
Nice to meet you, fellow traders.
If you "follow" me, you can always get new information quickly.
Have a great day today.
------------------------------------
(1M Chart)
The target range is around the Fibonacci ratios 2.618 and 3.618.
To continue the uptrend, the price must maintain a level above 0.3410. -
It appears that significant efforts are being made to defend the price since the issuance of the TRX stablecoin.
Therefore, if possible, it is advisable to continue trading by i
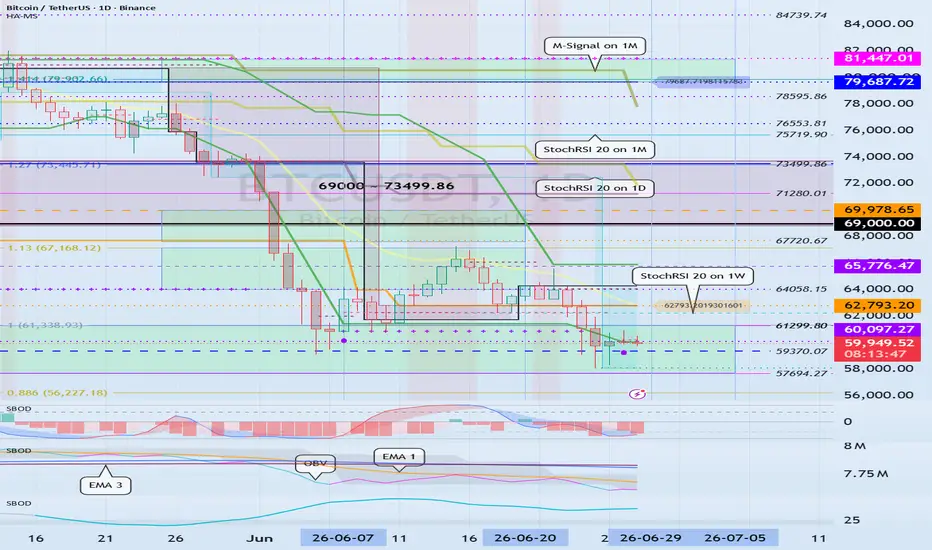
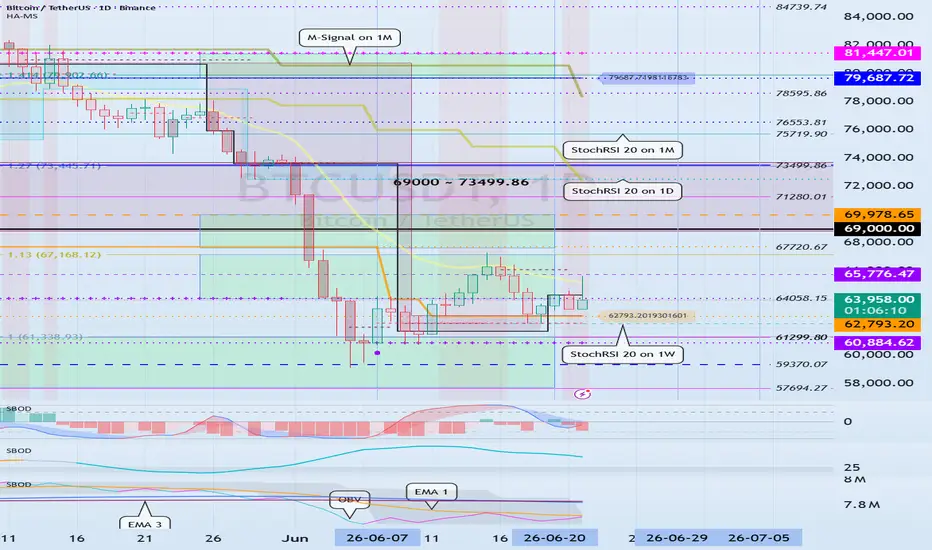
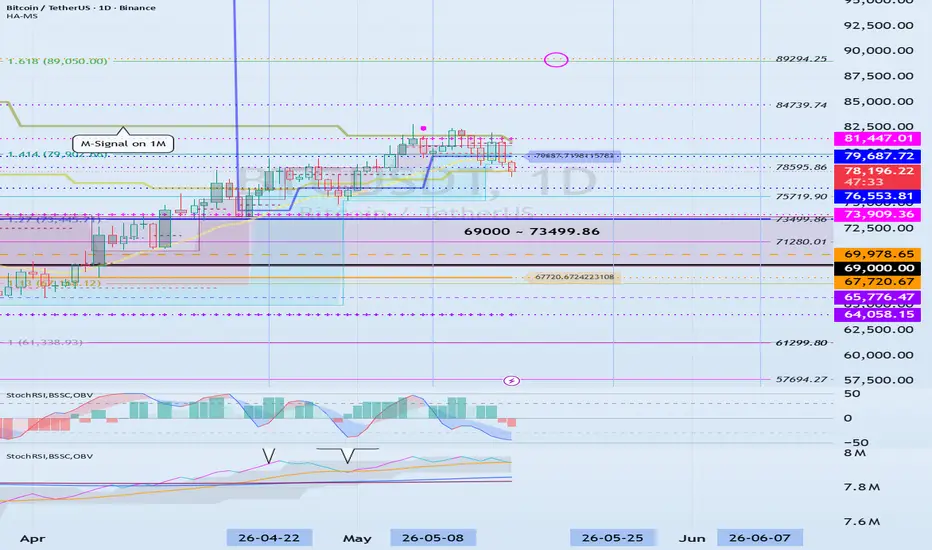
The key is whether it finds support around 81447.01
Hello?
Nice to meet you, fellow traders.
If you "follow" me, you can always get new information quickly.
Have a great day.
------------------------------------
The price is located near the M-Signal indicator on the 1M chart.
Accordingly, the key is whether it finds support at the 81447.01 point.
This is because if it finds support, it will be the last buying opportunity. - The conditions for continuing an uptrend by rising from a critical point or zone are:
1. When the StochRSI indicato
Support Zone: 620.0 ~ 656.54
Hello?
Nice to meet you, fellow traders.
If you "follow" me, you can always get new information quickly.
Have a great day today.
------------------------------------
(BNBUSDT 1M Chart)
I believe BNB is one of those coins that is burdensome to trade due to its significant rise.
The important zones are as follows:
- 691.77 ~ 793.86,
- 533.90,
- 348.70
Therefore, if the price is within the range of 348.70 to 793.86, it can be considered a buying opportunity.
However, since the price is curr
Crypto Market Fund Movements and BTC Outlook
Hello?
Nice to meet you, fellow traders.
If you "follow" me, you can always get new information quickly.
Have a great day.
------------------------------------
USDT is showing a sideways trend after renewing its all-time high (ATH).
USDC is also showing a sideways trend after renewing its all-time high (ATH).
When looking at USDT or USDC charts:
- If a gap up occurs, I consider it a sign that funds have flowed into the coin market.
- If a gap down occurs, I consider it a sign that funds
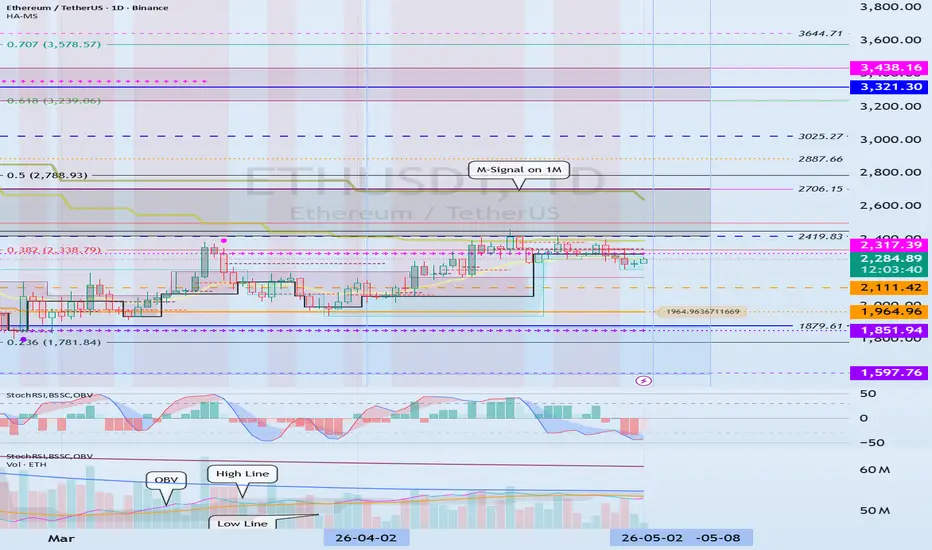
Volatility Period: Around May 2nd ~ Around May 8th
Hello?
Nice to meet you, fellow traders.
If you "follow" me, you can always get new information quickly.
Have a great day today.
------------------------------------
(ETHUSDT 1D Chart)
This volatility period is expected to continue until May 3rd.
However, since the next period of volatility is around May 8th, we should trade under the assumption that this current volatility will last from May 1st to 9th at most.
-
To sustain the uptrend in the mid-to-long term, the price must maintain a
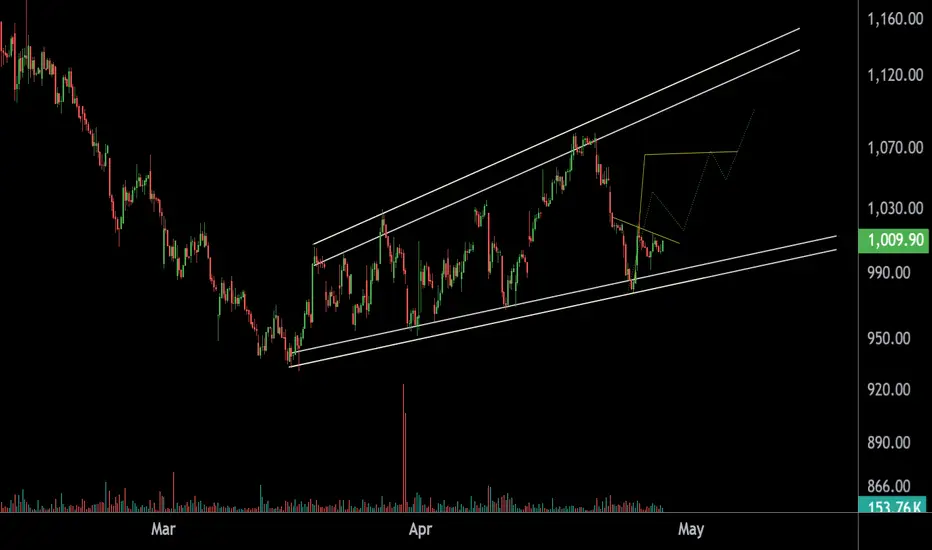
NAUKRI in Focus – Structure Intact, Momentum Ahead?The stock is currently forming an Ascending Broadening Wedge pattern.
Support Level:
The lower trendline is acting as a strong support zone. As long as this support sustains, the structure remains intact.
Upside View:
If the support holds, a potential upside move towards 1,070 – 1,100 can be expected.
A breakdown below support may invalidate this view.
Thank You !!