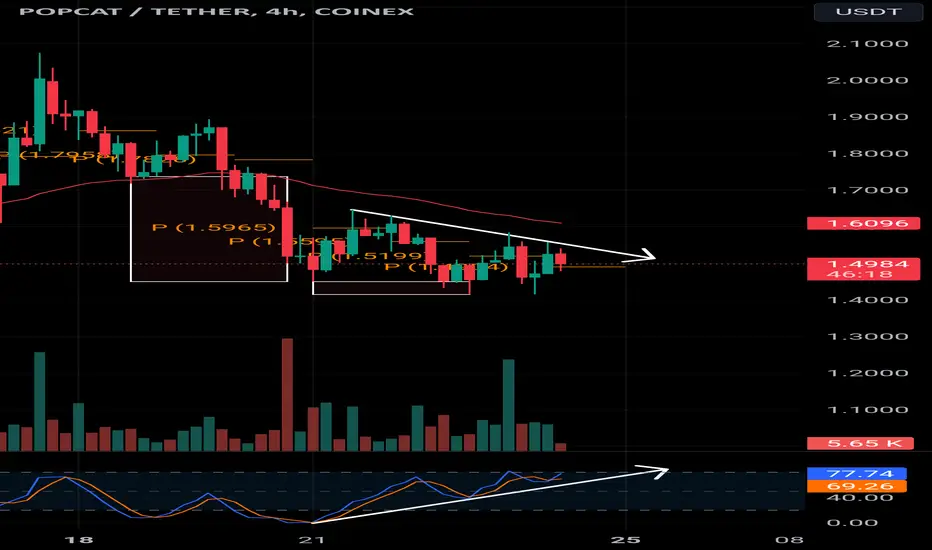
POPcat Bullish divergence When analyzing potential reversals, I typically look for a few key signals and indicators. First, I check for signs of losing momentum. Next, I observe if the price action is above the Daily Pivot while remaining below the 50 MA, as this suggests the reversal isn’t confirmed yet. Additionally, the overall market sentiment is currently extremely bullish, which further indicates that a reversal may be imminent.
Bullish Divergence
ETH to $25K - No Joke - BUY & HODLEthereum is at levels not seen since the Crypto Stone Age.
The Crypto Markets will start BOOMING!
ETH ( ETHUSD , ETHUSDT , ETHEUR ) is getting ready to go Bullish.
When? Early '23.
The Fibonacci Time Zones and Cycles tell me that the 3rd Fibonacci Summation is NOW.
So, I reckon Cryptos are getting ready for something BIG.
I do see a last drop before that though.
From Jan '18 until Dec '18 ETH had a whooping 94% crash.
We're only at 82% from Nov '21 top. So I am waiting with buying interest
Bitcoin BTC to $250K - BUY & HODLBitcoin went to the Moon with Dec '17 top.
Then it corrected 88.6% on the Fibonacci Retracement with Dec '18 bottom.
After that it went to Mars and hit the tops again in Nov '21.
It was a 2000% gain.
What can you tell from this?
Percentage-wise, Correction is lower than the gain.
So, the Dominant Trend for BTCUSD is UP!
OK, back to Earth.
Let's gather fuel and power-up the rocket.
Time to go Interstellar.
Before I go into the technical stuff, allow me to keep things simple for you.
I took t
GBPUSD Trade PlanChart shows a bullish divergence between price and RSI, alongside an inverse head and shoulders pattern, indicating a potential bullish reversal.
The trade setup suggests a buy stop above the neckline at 1.27268, with a stop loss at 1.25861 (below the lower low).
Profit targets are TP1 at 1.28680 (first resistance) and TP2 at 1.30080 (higher resistance).
Ensure confirmation with a strong breakout above the neckline.
Partial profits can be taken at TP1, moving the stop loss to breakeven f
CXW Inverse Head and Shoulder + Bullish Divergence!Hey Folks!
Not a fundamental analysis or financial advice, but trading idea on why it could do well in the coming months and beyond. I have discovered a technical repeat pattern in this one. I first found this stock after Trump made his statement regarding large deportations if elected. So naturally I look up prison stocks lol.
I made a nice trade on it last time it dipped and reversed, and I want to bring it to everyone's attention.
The overall pattern is shaping up nicely for a big move
Educational post BTC bullish divergence.You need to use RSI indicator. That's how I spotted the reversal.
Bullish divergence.
Bullish divergence happens when the price makes lower lows, but an indicator (like RSI or MACD) makes higher lows, suggesting weakening downward momentum and a potential upward reversal.
BOMBAY DYEING - Ready to Move to the Next OrbitThe stock after facing price rejection in the range of 224 to 241 was pushed down to the 50 DMA. It moved almost sideways in the last three months. Recently we saw some interest coming back into the stock with the relative strength and the money flow turning positive and the volume was also increasing. The stock remained very strong during the recent weakness we saw in the overall market. Now finally it has crossed above the price rejection zone with good volume support. The delivery volumes saw
EURUSD ChartEURUSD Chart
The pair is in Bearish Trend Forming series of LL's & LH's. On RSI there is Bullish divergence and also Bullish reversal Pattern of Double bottom. Will wait for BOS If the LH (1.09560) breakout then take buy trade SL on (1.08960).
Do your own research before taking the Trade.
MAZAGON DOCKS - ON A RECOVERY PATH ?The stock after a buying climax bar in the month of July was overwhelmed with the supply of the BC bar and was pushed down to below the 50 DMA levels. Then it started accumulating around the 50 DMA and now it's finally getting pushed above the short-term moving averages. And all the key parameters like the relative strength, absolute strength, the money flow, buying pressure are all nicely stacked up favouring further up move. So, this could move up again. Another 1000 points testing 5400 levels
BTC reversal soon??Divergences between price and RSI can often show that a trend is coming to an end and a new one is beginning. In this case we can see that RSI on the 4H timeframe hit the oversold zone, and has been steadily climbing out of it ever since. However, we can see that price has continued making lower lows and lower highs... The price and the oscillator are out of phase and in this case as RSI grows larger but price continues to drop it's a bullish divergence signal and this suggests a trend shift fro
Put Your Speculators On!This head and shoulders pattern could be just pure speculation at this point. In fact, let me reword that.. this IS speculation based on the fact that I missed the lows and psychologically, I'm really hoping this comes back to shore so I can get back on the boat with everyone else.
I do however do my technical analysis in advance and set alerts at levels like you should do and if it plays out then great if not there's always the opposite idea too. We move onto the next one.
For now though what
EGLD Outlook after the Dip. What to expect NOW ?BINANCE:EGLDUSDT
EGLDUSDT is forming a falling wedge on Daily timeframe , Up we go if we do breakout.
According to Elliott's theory, the double combo waves have ended and it means that the price can increase.
Also a bullish Divergence (RD+) on MACD which shows Positive Signs for EGLD.
✨Traders, if you liked this idea or have your opinion on it, write in the comments, We will be glad.
_ _ _ _ __ _ _ _ _ _ _ _ _ _ _ _ _ _ _ _ _ _ _ _ _ _ _ _ _ _ _ _
✅Thank you, and for more ideas, hit ❤️
$TSLA Support Found at Yearly Anchored VWAPIt appears Tesla NASDAQ:TSLA might have found significant temporary support at the yearly anchored VWAP. I expect a move up to test upper deviation at 226.50, which would be first profit target. I own some Oct 4 240 C which I plan on scaling out of beginning around that level.
Nano [XNO] bullish divergenceNano is showing bullish divergence on a higher timeframe. My expectation is that downtrend which started since ATH will be reversed soon. Similar bullish divergance pattern appeared with previous bullrun when and BINANCE:XNOBTC pair gained about 500%. Price action since ATH seems corrective (three wave move), which indicates a new impulsive wave could exceed ATH.
X
NOTHING !!KUCOIN:GTAIUSDT
The price is in a megaphone, and now the price is on the bottom of Megaphone, and this means that the price can grow to the top of the megaphone. Also bullish divergence increases the chance of this signal.
✨Traders, if you liked this idea or have your opinion on it, write in the comments, We will be glad.
_ _ _ _ __ _ _ _ _ _ _ _ _ _ _ _ _ _ _ _ _ _ _ _ _ _ _ _ _ _ _ _
✅Thank you, and for more ideas, hit ❤️Like❤️ and 🌟Follow🌟!
⚠️Things can change...
The markets are always