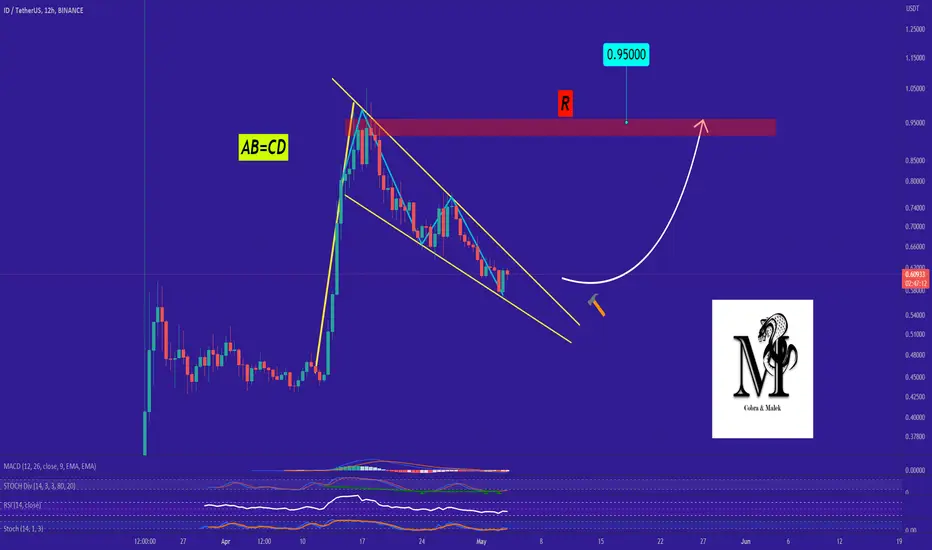
Bullish Pennant
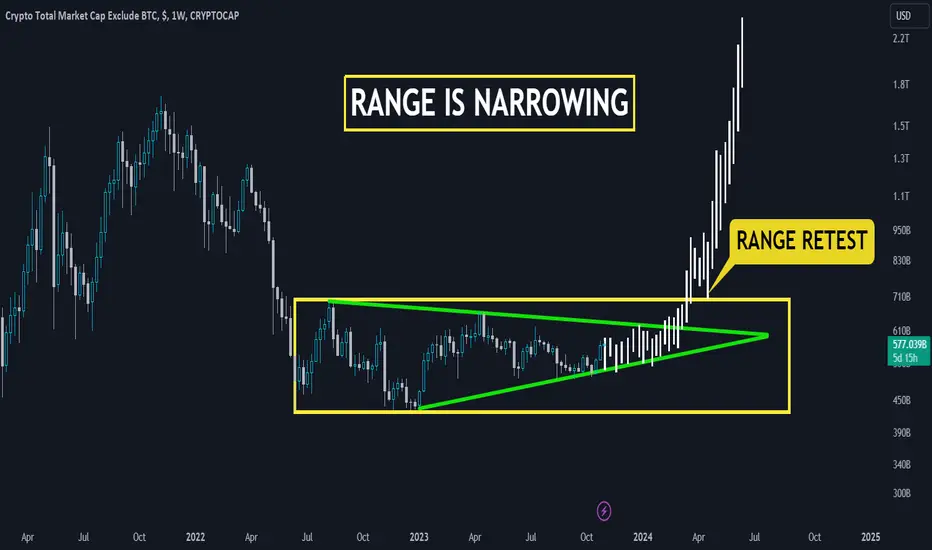
TOTAL2 is About to Explode!The crypto market is abuzz with a significant phenomenon - the shrinking of the total market capitalization, excluding Bitcoin (BTC). Contrary to what one might expect, this contraction often precedes a major pump in the world of cryptocurrencies, signifying the potential for exciting price movements. 🌌💥
Unpacking the Market Cap Contraction
Market cap contraction is a fascinating occurrence, one that hints at the complex dynamics of the cryptocurrency market. When we talk about the total marke
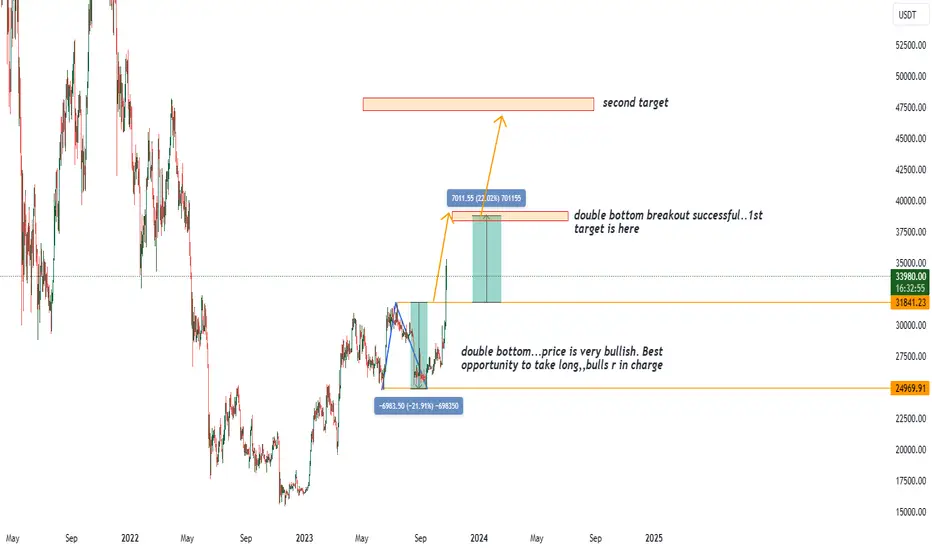
Bitcoin double bottom pattern bullish price pushed up with good volumes and bulls are very strong bears lost ground at 31k..
with all the positive news coming its going to jump till 40k at least if bullishness continues.
i recommend to open long positions in a systematic manner so that u can catch any small falls..
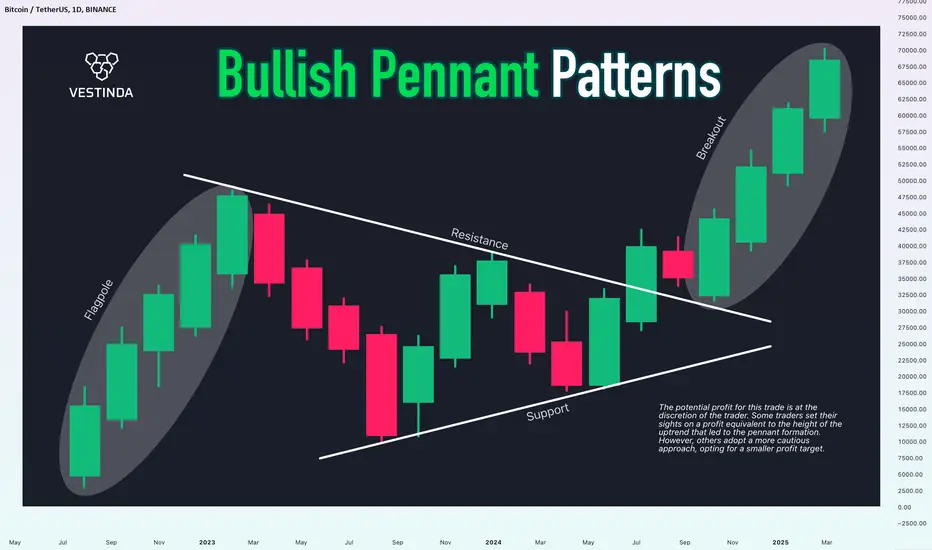
Bullish Pennant PatternIn this guide, we unveil the secrets of Bullish Pennant pattern, exploring its psychology, identification, and trading strategies.
If you appreciate our charts, give us a quick 💜💜
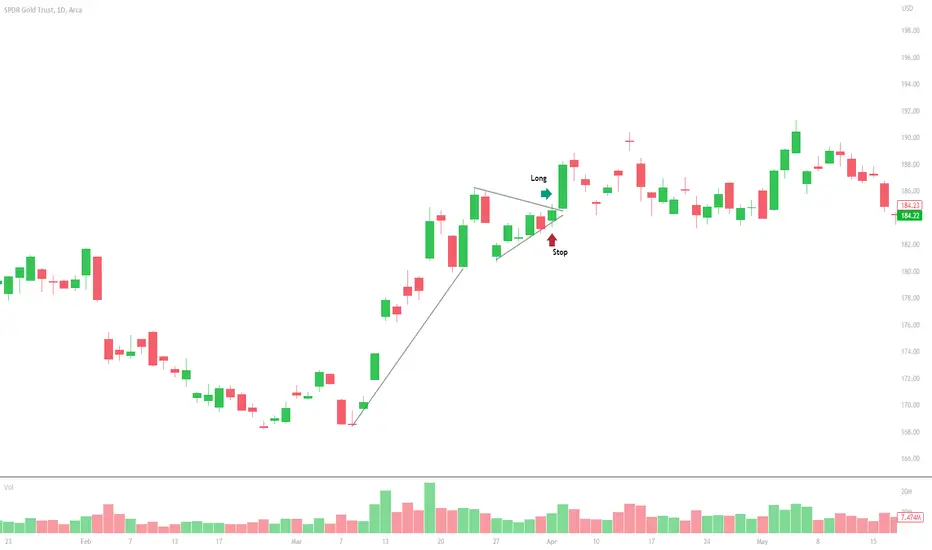
Understanding the Bullish Pennant Pattern:
The bullish pennant emerges post an uptrend, forming a small symmetrical triangle (the pennant) during consolidation. This pattern signifies a battle between bulls and bears, ultimately leading to a breakout, usually upward, signifying the continuation of the uptren
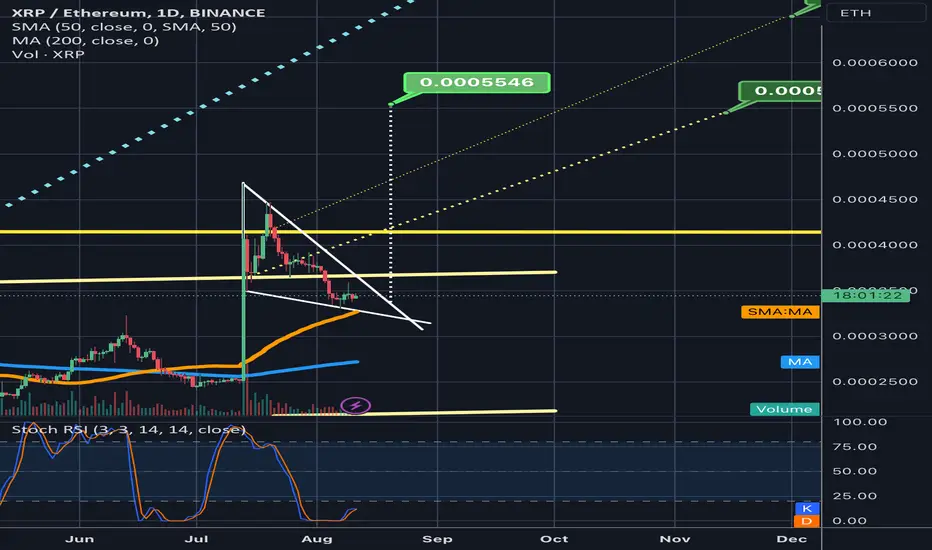
XRPETH falling wedge/bull pennantWe can see that price action is reaching the apex of the white wedge/pennant and that the orange 50ma has now entered the pennant. Looking at where the stoch rsi currently is, odds are good that price can maintain support on the 50ma and that it could help lift or bounce price up out of the pennant and send it heading towards the breakout target. I have only posted the pennant breakout target here, the target for the wedge on its own will be a lower than this one, however I see that the pennant
AUDUSD Bullish Pennant BreakoutThe pair is already in an uptrend on higher time frames. We are expecting further upside which is signalled by the breakout of the bullish pennant pattern. We can also see the formation of a new high and a breakout of a key level which further supports our directional basis. Entry on retest of the key level.
Mastercard Inc. leading the market on NYSE stocks todayMastercard Inc. is a leading technology company in the payments industry that provides payment processing solutions to businesses and consumers worldwide. Mastercard is one of the largest payment processors in the world by market cap and the number of payments processed.
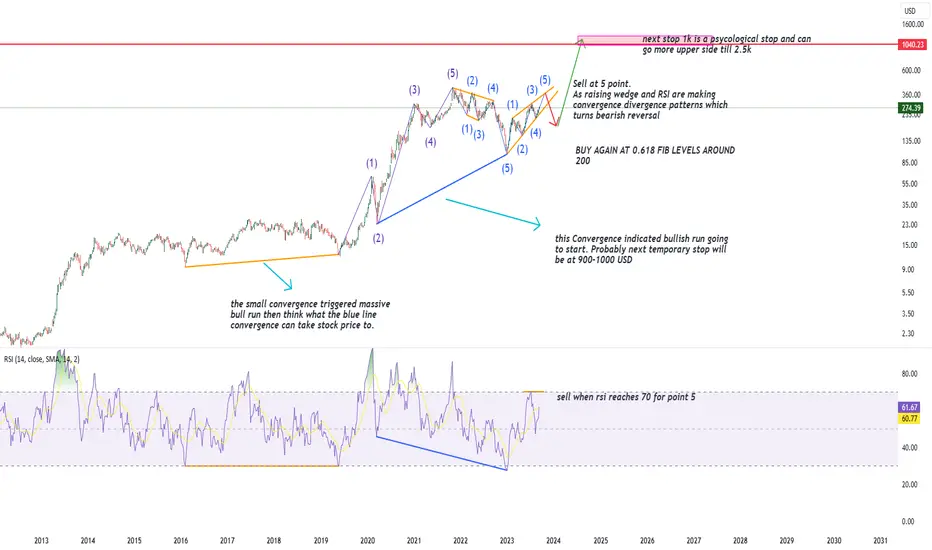
TESLA next bull run analysis you have to see.Telsa after long bearish trend pushing prices with higher high and higher low patterns indicating a near bull run scenario to be take place.
the convergence from point 2 to point 5 can act as bullish reversal and can push price to 1k USD or even more upside probably making tesla a multi bagger stock.
As fundamentals are strong and TA giving green signal you can invest in a SIP manner or one can start invest for long term once the raising wedge correction is finished .
best price for entries a
4hr bull pennant on xrpusdI normally don’t put too much faith in 4 hour timeframe chart patterns, however should this 4 hour chart bull pennant hold up the bullish breakout target is around $1.10 . As of now it does look like it’s about to break upward, however being a smaller time frame like the 4hr chart there is still a chance this could be a fakeout and the real chart pattern is much bigger and needs to be charted on a higher timeframe. For now at least this looks good. *not financial advice*
Bullish Pennant on USD/JPY @ H4This chart shows a bullish pennant on the daily chart of the USD/JPY currency pair. It can be used as a trend continuation pattern in case of the price closing above the upper border of the pennant part. The pennant and its pole are shown with the yellow lines. My potential stop-loss level is marked with the red line (141.208), it is placed at the low of the pennant area. My potential take-profit level is marked with the green line (143.411), it is placed at the pole's length above the SL. I wil
Bitcoin - Huge pump is ready! + Bullish pennant
Bitcoin is forming this bullish pennant on the daily chart. The price has been inside this pattern for a month, and it's time for a massive breakout!
The next stop is around 34k because of the 0.618 FIB extension from Wave (1) to Wave (2) and we can hit this target next week. After it, a pullback is likely, but continuation of the uptrend to 39k is in place as per my previous analysis. Then I expect a crash to 21k!
This analysis is not a trade setup; there is no stop-loss, entry point, profi
BA Bull pennant or fake outRight now looking at a daily bull pennant on BA top of 219 or bottom below 196. If we zoom out to to larger time frame we are still in a slightly bearish flow. A third retest of the high (original and one already) will confirm direction.
Worse case senario we stay within this range for a while depending on future sales of BA airplanes.
USDJPY What will happen in the near future?🌟The USDJPY is in a Bullish phase by ⤵️⤵️
🌟 Bullish signals are:
- Bullish Cup & Handle
- Bullish Pennant
- Dynamic Support zone
- Pivot R1 monthly
- Ascending Triangle
- moving EMA 20 50
✅TARGETS: 142,148
⭐ Note if the PRZ is broken downwards with the strength of Bearish candles from bottom Of the PRZ zone , this analysis of ours will be failed.
⏮️Previous Analysis⏮️
✅If this post was useful for you, like it ❤️ and if you think it is useful for your friends, be sure to send it to them.
_
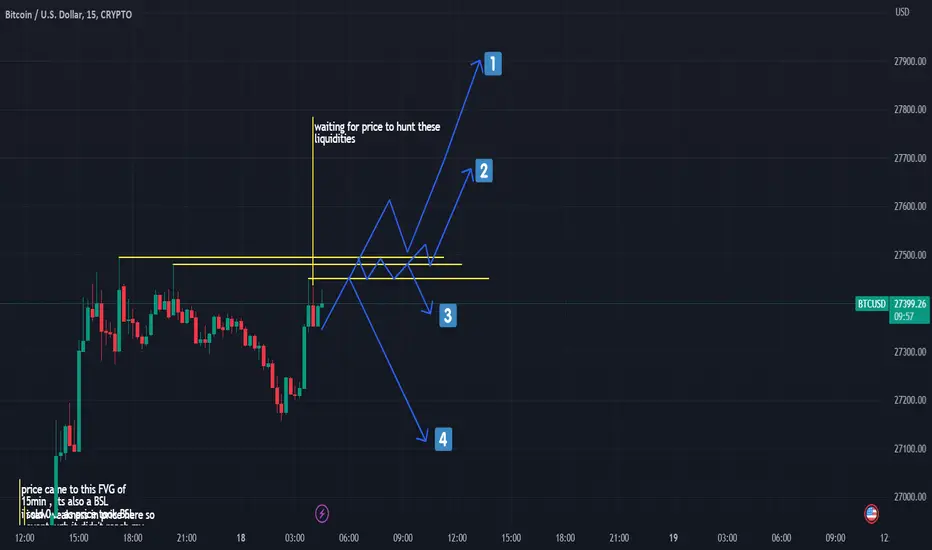
Which Scenario ?Just by looking at it it makes sense for price to hunt all those untouched liquidity , right ?
but what's gonna happen next ?
as i indicated here there are 4 scenarios for me , but i think 4 is the most possible one , why u ask ?
well , if u follow my ideas i am bearish on BTC and i have a whole bunch of reasons and all i see here and in the recent move was just a liquidity hunt .
i predict prices bellow 25K for BTC cause i yet recognize exhaustion in price move , and it is not a good sign i
XNGUSD Bull Pennant Pattern Short then LongXNG has had a big week with a big bullish momentum move into a symmetrical triangle
and then a breakout into a bull flag pattern to finish out the trading week. A Bollinger Band
squeeze as the symmetrical triangle was underway preceded the breakout. PRice crossed the
POC line of the volume profile where trading volume , liquidity and volatility all are the
highest Equities and equity funds like BOIL, KOLD, UNG, UNL, LNG had corresponding moves.
The Luxalgo ECHO indicator, a predicti
XShort
ID's Next target is 0.95$!Hi every one
ID has done a Impressive Movement recently but the odds of another bullish Movement is Pretty high because the pattern which ID is in, Is a Bullish Pennant Pattern! Since The break out has not happened, there is no confirmation of a Bullish Movement But If It happens, we Can Expect a Bullish Movement as much as the Measured Price movement (Pennant pole) to happen! The Next target is around 0.95$!
🟡Summery:
-ID has been Bullish Recently!
-The odds of another Bullish Movement is Hig
OCEAN BULLISH Pennant with FIB TargetsBINANCE:OCEANUSDT
Hi Traders, Investors and Speculators of the Charts 📈📉
Ev here. Been trading crypto since 2017 and later got into stocks. I have 3 board exams on financial markets and studied economics from a top tier university for a year.
A Bullish pennant is spotted on the OCEANUSDT chart. The targets or take profit points from this pattern can be determined by using a Fibonacci retracement from the pennant. NOTE that this may take some time to play out; be sure to manage your risk
OLong