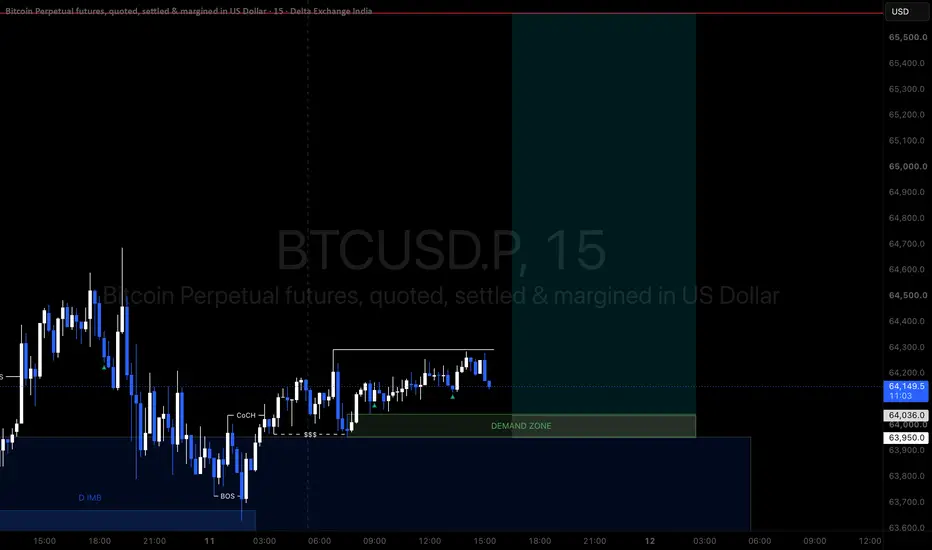
Long
Long
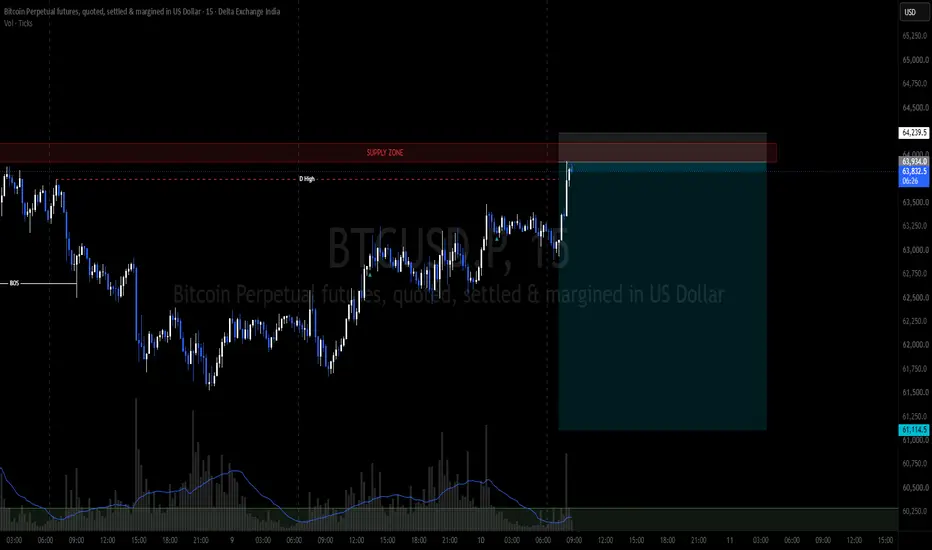
Long 
Long 
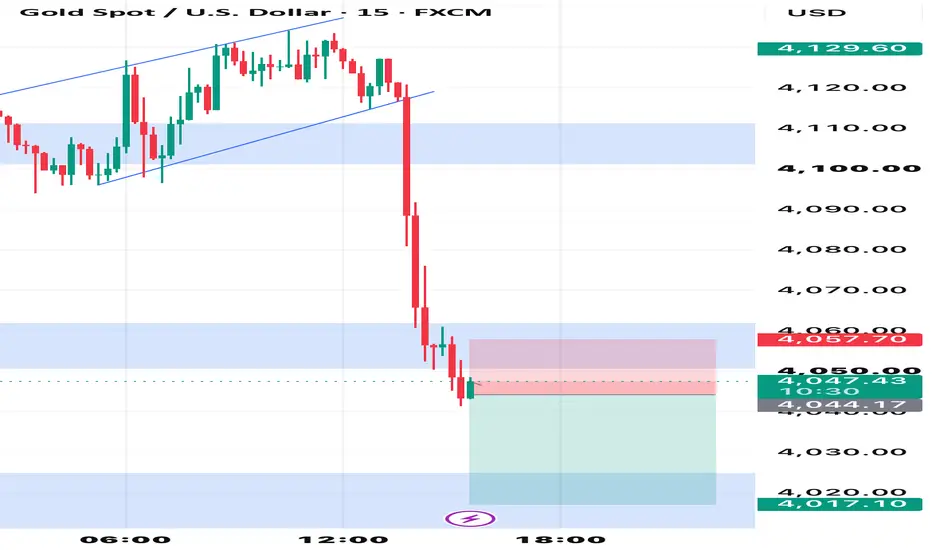
Long 
Short 
Long 
Long 
 Long
Long
MCX Falling Wedge Recovery Setup📊 MCX: Daily Technical Snapshot – Falling Wedge Recovery Setup
📊 STWP Technical Analysis
________________________________________
MARKET STRUCTURE SNAPSHOT | NSE: MCX | DAILY
Closing Price: 2,742.00 (+98.80 | +3.74%)
Core Trend: Downtrend (Swing Structure)
Market State: Recovery Attempt Within Falling Wedge
Price Structure: Price is trading inside a Falling Wedge, a bullish reversal pattern, after forming a Bullish Engulfing near the lower boundary. Buyers have defended support, and the stock is now attempting to challenge the upper boundary of the wedge.
________________________________________
OPERATIONAL PRICE GRID & KEY REFERENCE LEVELS
Model Reference Level: 2,766.00
Hard Invalidation Level: 2,571.80
Structural Risk: 194.20 (7.02%)
Resistance Levels: R1 2,807 | R2 2,872 | R3 2,978
Support Levels: S1 2,636 | S2 2,530 | S3 2,465
Range Structure: Low 2,571.80 | High 2,978.00
Higher Timeframe Observation Zones: 2,872 | 2,978 | 3,100 | 3,180
________________________________________
MOMENTUM, PARTICIPATION & CPR DATA
Volume Profile: 4.93 Million Shares
Volume Character: Strong Relative Participation
RSI: 42.96 (Recovering Momentum Zone)
ADX: 20.18 (Trend Development Phase)
ROC: -3.14%
MACD Status: Negative Momentum Showing Signs of Stabilization
CCI: -155.33 (Recovering from Oversold Zone)
Stochastic Reading: 35.72 (Recovering from Oversold Zone)
Current Bias: WAIT FOR BREAKOUT CONFIRMATION
CPR State: Bullish Zone | CPR Moving Down (Normal)
Today's CPR: Pivot 2,651.55 | Top 2,655.75 | Base 2,647.40
Tomorrow's CPR (Projected): Pivot 2,701.00 | Top 2,721.50 | Base 2,680.50
________________________________________
📚 EDUCATIONAL OBSERVATION
MCX has shown encouraging signs of recovery after forming a Bullish Engulfing candlestick near the lower boundary of a Falling Wedge, a chart pattern commonly associated with bullish reversals following a corrective phase. The recent price action suggests that selling pressure is gradually weakening while buyers have started defending lower price levels.
The recent decline briefly pushed prices below nearby support before buyers quickly regained control, creating characteristics of a liquidity sweep (false breakdown). Such behaviour often reflects seller exhaustion, where weak hands exit the market before stronger buying interest emerges. The subsequent bullish engulfing candle reinforces this recovery attempt and highlights improving short-term sentiment.
Several technical observations are currently supporting the developing structure:
Falling Wedge Recovery Setup
Bullish Engulfing Candlestick
Liquidity Sweep / False Breakdown
Strong Bullish Recovery Candle
Bullish VWAP Position
Strong Relative Volume Participation
Buyers Regaining Short-Term Control
Momentum indicators are beginning to stabilise after the recent correction. The RSI at 42.96 remains below the stronger momentum zone but has started recovering, indicating improving buying interest. MACD continues to remain below the zero line, suggesting that the broader corrective trend is still intact, although downside momentum appears to be slowing. The CCI reading of -155.33 reflects a deeply oversold condition from which the stock has begun recovering, while the Stochastic reading of 35.72 also points towards improving momentum after emerging from oversold territory.
The projected Central Pivot Range (CPR) for the next trading session has shifted moderately higher, with the projected Pivot at 2,701.00. While this reflects improving market acceptance of higher prices, the setup continues to favour patience until a clearer directional breakout develops.
The immediate technical focus remains on the upper boundary of the Falling Wedge, which also coincides with the resistance zone between 2,807 and 2,872. A decisive close above this region, supported by stronger-than-average trading volume, would confirm the wedge breakout and significantly improve the probability of a broader bullish reversal. Upon confirmation, the higher-timeframe observation zones near 2,978, 3,100, and 3,180 may become relevant for future market structure analysis.
From a business perspective, Multi Commodity Exchange of India (MCX) is India's leading commodity derivatives exchange, facilitating trading across precious metals, base metals, energy and agricultural commodities. Continued growth in commodity market participation, increasing institutional activity and expansion of derivative products provide a constructive long-term backdrop for the company.
Support and resistance levels should be viewed as observation zones rather than predictive targets. Chart patterns, candlestick analysis, price action, volume studies, momentum indicators and CPR are educational tools that help market participants understand evolving market structure within a disciplined risk-management framework.
________________________________________
⚠️ Disclaimer
This analysis is provided strictly for educational and informational purposes.
This is not financial, investment or trading advice and should not be considered a recommendation to buy or sell any security.
Stock market investments are subject to market risks, including the possible loss of capital.
Past performance, historical observations, chart patterns and technical indicators do not guarantee future results.
Please conduct your own research and consult a SEBI-registered investment adviser before making investment decisions.
STWP assumes no responsibility or liability for any financial loss arising directly or indirectly from the use of this information.
 Long
Long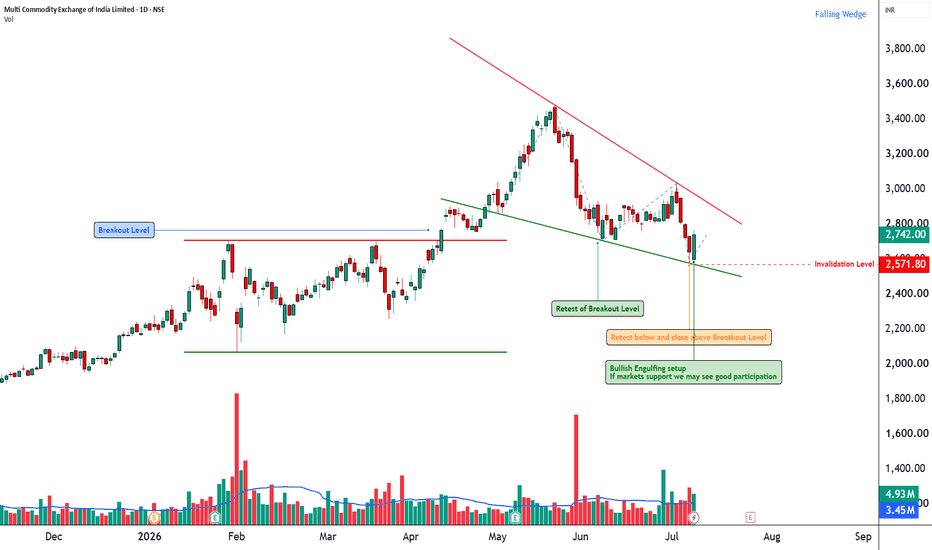
 Education

 Short
Short
 Long
Long
 Education
 Education

Trading Masterclass #1Institutional trading means trading like hedge funds, banks, prop firms, and professional desks. They do not trade based on emotions, random tips, or gambling. They use systems, probabilities, risk control, position sizing, discipline, and psychology.
Retail traders often lose because they focus only on “entry.” Institutions focus on:
Risk Management
Capital Protection
Position Sizing
Probability
Psychology
Consistency
Repeatable Edge
 Education

Education

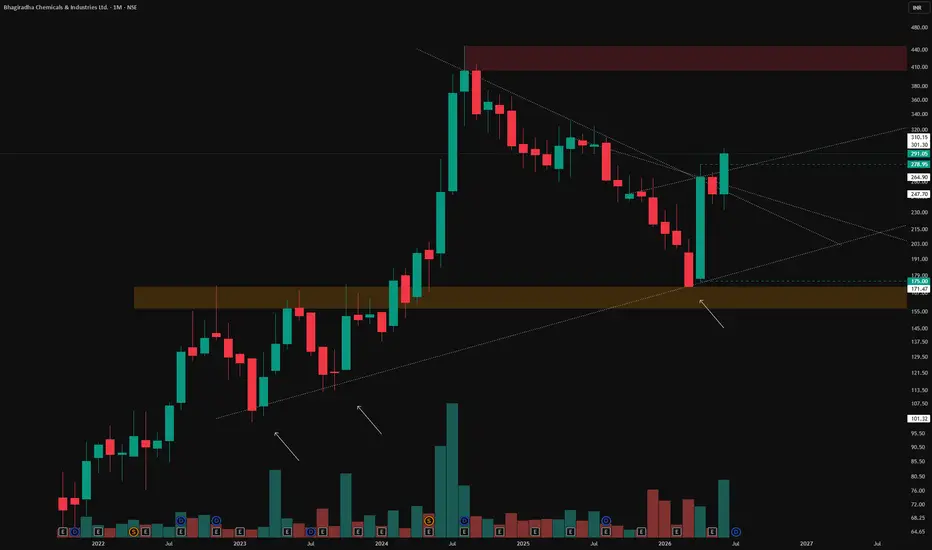
Monthly Structure terms : Trendline, Flip Zone & Mother Candle1. Monthly Timeframe
Each candle on this chart represents one full month of price action. The monthly timeframe filters out daily noise and shows the broader structural trend, making it the most reliable
2. The Trendline (White Line)
This trendline connects three genuine touches on the monthly chart, marked with arrows. Each touch shows price respecting the same rising support, confirming it as a valid, well-tested trendline rather than a randomly drawn line.
3. The Flip Zone (Orange Zone)
From 2022 to 2023, this zone acted as resistance, repeatedly capping price advances. In 2024, price broke out above it and sustained that breakout. Once broken and held, old resistance becomes new support, this is a textbook flip zone
4. The Supply Zone (Red Zone)
This marks the stock's all-time high, where aggressive selling pressure previously emerged. It remains an important zone to watch since price has not yet been tested or accepted above this level.
5. The Mother Candle & Inside Bars (Green Dotted Lines)
A mother candle is a large candle whose high and low range "contains" the next one or more candles, these contained candles are called inside bars. This pattern often signals consolidation or indecision before a potential expansion
Disclaimer: This post is for educational purposes only and is strictly non-forecasting and non-biased in nature. It does not constitute investment advice, a buy/sell recommendation, or a prediction of future price movement.
 Long
Long
Pole & Flag Pattern : Understanding the Story BehindPole & Flag Pattern :
Markets move in phases: impulse, consolidation, and continuation . The Pole & Flag pattern represents this natural rhythm of price action.
A pole is the strong directional move where buyers or sellers aggressively take control. This phase is usually supported by increasing volume, showing strong participation and momentum.
After a sharp move, the market often pauses. This creates the flag, a short consolidation phase where early participants book profits and new participants enter. A healthy flag is usually smaller than the pole, with controlled retracement and decreasing volatility.
The real opportunity comes when price breaks out of the flag structure.
✅ A quality Pole & Flag setup usually has:
• Strong impulsive pole
• Controlled retracement (not a deep reversal)
• Tight consolidation
• Volume expansion on breakout
• Price closing above the flag boundary
For a bullish setup:
Pole = buyers gaining control
Flag = temporary pause / absorption
Breakout = continuation of demand
Target projection is commonly measured using the pole height from the breakout point.
However, remember:
A pattern is not a guarantee. The context matters:
• Overall market trend
• Volume behavior
• Support and resistance zones
• Risk-to-reward before entry
The pattern is not about drawing two lines — it is about understanding the market psychology behind accumulation, hesitation, and renewed momentum.
📈 Price tells the story. Volume reveals participation.
Few other examples:
NSE:IOLCP
NSE:MOTILALOFS
NSE:AEROENTER
==============================================================================
Disclaimer:
This post is purely for educational and technical analysis purposes. I am not a SEBI registered analyst. This is not a recommendation to buy, sell, or hold any security. Markets involve risk; always do your own research and follow proper risk management.  Education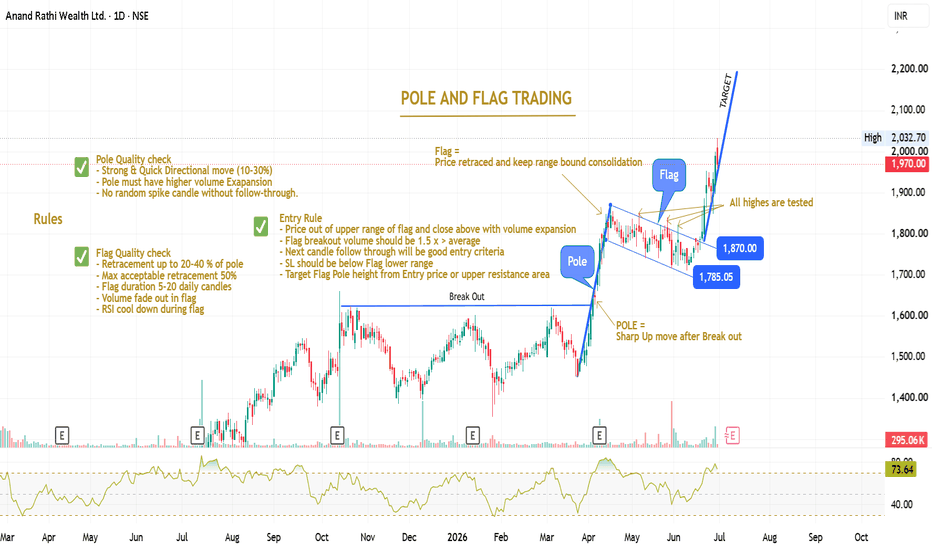

 Education