Short
Short
 Long
Long
NIFTY BANK Price Structure Analysis [For 15.06.2026: Monday]Probable Price Structure Analysis of NSE:BANKNIFTY for the 15th of June, 2026. The day is Monday.
(1) Bullish Scenario:
If the price stays above the level of 56500, then stay bullish. The probable bullish targets above the level of 56500 are - 56750, 57000, 57250, and 57500. The price will experience good resistance at the level of 57500. Next, if the price decisively breaks out above the level of 57500, then the probable bullish targets would be - 57750 and 58000.
(2) Bearish Scenario:
There is no observable bearish scenario. The level of 55750 is strong support. In case the price breaks down below the level of 55750, then the probable bearish targets would be - 55500, 55250, and 55000.
(3) No Trading Zone (NTZ): (56500 - 55750).
(4) Range of Consolidation (ROC): (57000 - 56000).
Here, the median of the ROC is 56500. If price stays above the median, then think only about executing bullish trades. On the contrary, if the price sustains below the level of 56500, then the price will be trading in the no-trading zone (NTZ). In that case, don't trade.
(5) Availability of an Unfilled GAP: (55750 - 55250).
We have to always discount the factor of an unfilled gap, as anything can happen in the market. There is a low probability of gap filling. Yet, we should keep it in mind while trading.
(6) Event:
There are no high-impact events or holidays in the week. However, we have to keep an eye on the geopolitical developments, Crude Oil Price, and USDINR.
(7) Establish intraday bias with respect to the opening price. If the price sustains above the opening price, then don't think of shorting. Look for bullish trades only. On the contrary, if the price sustains below the opening price, then don't think of going long. Look for bearish trades in that case.
Top-Down Analysis:
(1) Monthly TF:
The monthly candle is a strong bullish hammer candle trading above the level of 55000. Immediate strong resistance is 57500. The price is trading above the 20 EMA. The view is bullish.
(2) Weekly TF:
A strong perfect bullish marubozu is observable. It is a sign of strength and trend reversal (bearish to bullish). Considering the chart pattern of the period (March - June, 2026), the chart pattern is "Adam and Eve double bottom." It is a sign of trend reversal. Immediate resistance is the level of 57500. The price is trading above 9, 20, and 50 EMAs. There is no observable bearish setup. The view is bullish.
(3) Daily TF:
Candle formation trend in the period (01 June - 12 June, 2026) is higher-highs and lower-lows. The bullish trend is strong. Level 55500 seems to be a strong support level. Immediate resistance is 57500. The price is trading above upward-sloping 9, 20, and 50 EMAs. The price is also trading above the 200 EMA, but the 200 EMA is still flat. Since there is no sign of weakness, the view is bullish.
(4) 30-minute TF:
The price structure has formed a higher-highs and lower-lows formation. The strong support zone is (55000 - 56000). Immediate resistance is at 57500. There is no sign of weakness. The price is trading above upward-sloping 9, 20, 50, and 200 EMAs. The view is bullish.
NOTE:
(i) All the analyses would fail in the case of a major gap up, gap down, or price structure anomaly. Thus, practice PRAGMATISM in the live session.
(ii) Trade only if there is a set-up. Remember, not trading is an extension of the trading activity.
(iii) Mark your points. Trade your points. Price is GOD. Anything can happen in the markets. Thus, trade what you see, not what you believe.
(iv) Always PRACTICE RISK MANAGEMENT. Always PROTECT YOUR CAPITAL. Be RESPONSIBLE.
(v) Be Strategic. Be Courageous. Be Patient. Be Wise.
(vi) Every day is a new day. Thus, do not carry the baggage of past successes or failures. Leave the gardens of winning and losing. Establish yourself in equanimity. Always think from a new perspective.
(vii) Let the joy of trading drive your effectiveness, not greed or fear. Believe in Possibilities.
Happy Trading!  Long
Long
 Short
Short
ESCORTS Creating Textbook Double Bottom at Key Support |ESCORTS is currently at a pivotal inflection point.
The combination of a second bottom test and a textbook Hammer candle at major support significantly improves the bullish probability. This setup suggests that selling pressure is waning and smart money is stepping in to defend the ₹2700–2780 demand zone.
Historically, such double bottoms accompanied by reversal candles like hammers often lead to strong counter-trend rallies, especially when they occur after an extended down-move.The risk-reward profile is highly favorable on the long side provided proper confirmation is observed.
Traders entering on hammer confirmation or bottom reversal can target a minimum 10–15% upside to ₹3100–3300 with well-defined risk below the recent lows.
This level also offers a good accumulation opportunity for medium-to-long-term investors if fundamentals (rural economy, tractor sales outlook) align.
However, patience is key — do not jump in without follow-through. False breakdowns near such supports are common, hence strict stop-loss discipline is non-negotiable. Overall structure still carries some bearish remnants, but the current candle and pattern tilt the near-term bias clearly bullish.
Entry:
Aggressive Entry: Above 2810 on strong follow-through volume. This confirms the reversal.
Conservative Entry: Wait for a decisive close above 2810 (recent swing high).
This breakout would complete the pattern and offer higher conviction.
Stop Loss (SL):
Initial SL: Below the low of the Hammer / second bottom, i.e., 2690. This protects against a false breakdown.
Target 1:
₹3010 (immediate resistance and 50% retracement of the recent leg down) — R:R ≈ 1:2
Target 2:
₹3212 (previous breakdown zone and major supply area) — R:R ≈ 1:4+
Target 3 (Extended):
₹3379 (next major resistance, possible retest of earlier highs)
Confirm the pattern with rising volume on upside candles in the coming sessions.
Monitor broader market sentiment — Auto/tractor sector performance and Nifty trend will influence follow-through.
Avoid large positions until the neckline breakout. Partial profit booking at Target 1 is advisable.
Timeframe: 2–8 weeks for swing trade.
If price breaks and closes decisively below ₹2680 with high volume, the double bottom fails. In that case, the downtrend resumes with targets at ₹2550 → ₹2400. Shorts can then be initiated with SL above ₹2800.
This is technical analysis only based on the chart and your observation. Combine with latest news, earnings, and sector data. Trade responsibly with proper risk management. Past patterns do not guarantee future results.
 Long
Long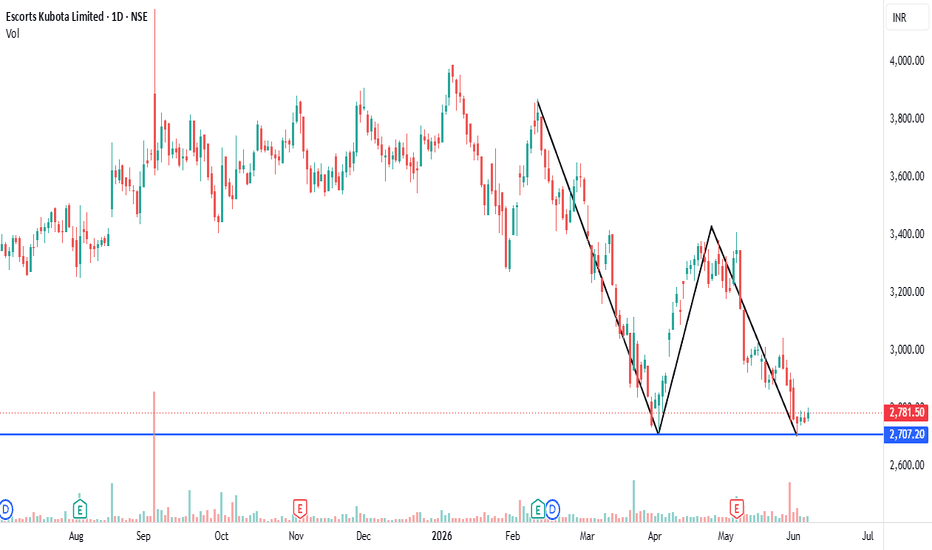
BTCUSDT 1W: Are We Heading to the $49,000 Major Liquidity Zone?Technical Analysis Breakdown
1. Macro Trend Shift - Following a multi-month uptrend peaking at local highs, the market structure has shifted downward. Lower highs and lower lows are forming on the macro view, confirming strong bearish momentum.
2. Immediate Liquidity Sweeps - The price is currently pressuring a vital local support level at $59,767. Multiple wicks indicate ongoing Liquidity Sweeps around this level as buy stops are repeatedly hunted.
3. The Ultimate Support Target ($49,045) - If the $59,767 sweep region fails to spark a sustained bullish reversal, a deeper correction is likely. The next major technical structural level lies at $49,045. This line marks an Important Support & Liquidity Zone representing an older macro breakout point that hasn't been retested.
Trade Scenarios & Outlook
< Bearish Scenario (Higher Probability) - A weekly candle close below $59,700 will trigger a cascading flush down to gravity centers. Expect a drop toward the primary demand zone at $49,000 to collect trapped buy-side liquidity before any long-term recovery.
< Bullish Scenario (Invalidation) - A decisive engulfing bounce off the current liquidity sweep zone could temporarily delay the correction. Bulls must reclaim higher levels to invalidate this macro-downward path.
Disclaimer: Educational analysis only. Not financial or investment advice.
 Short
Short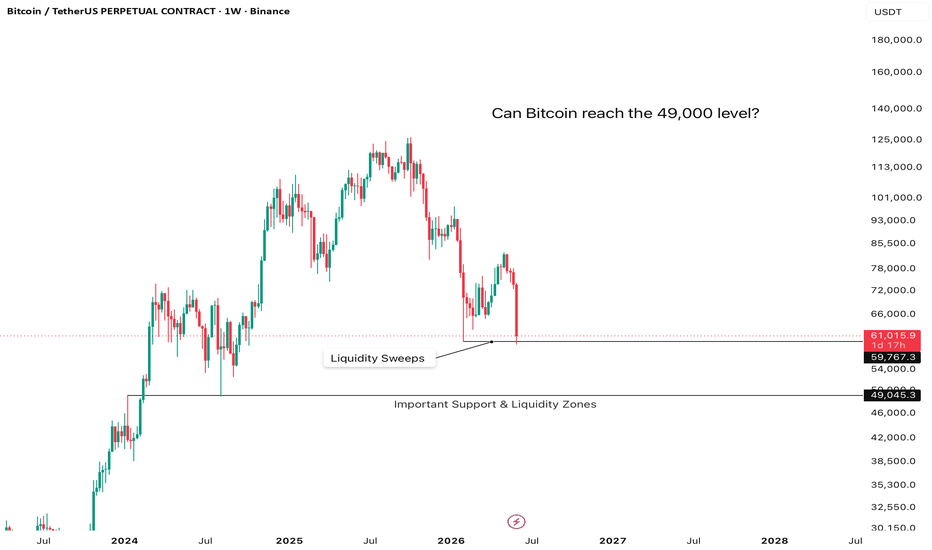
Short 
BTCUSDT: Massive 2x Measured Move Completed—Time to Buy?BTCUSDT has completed a massive 2x measured move downward from a premium supply zone and is currently testing a key historical Reversal Area between $65,000 and $65,650.
Market Overview & Structure
1. Supply Zone Distribution
The Premium Block: Price initiated a heavy sell-off from a well-defined distribution range between $77,000 and $78,000.
Institutional Imbalance: This zone represents an aggressive institutional supply imbalance that rapidly shifted market control to sellers.
2. The 2x Measured Move
The 1x Extension: The initial leg down established a definitive momentum benchmark.
The 2x Projection: Sellers completely exhausted the mathematical downside target at 2x Supply, plunging the market perfectly into the lower extreme.
Trading Setup: Long Position Potential
Execution Strategy
Entry Zone: Look for entries within the highlighted Reversal Area ($65,000 - $65,650). Wait for lower-timeframe validation (e.g., a bullish engulfing candle or a change of character on the 15m/1h charts).
Stop Loss (SL): Place strictly below $64,500 to protect against a liquidity sweep of the structural lows.
Take Profit 1 (TP1): $68,500 (Immediate structural resistance).
Take Profit 2 (TP2): $73,000 (Major mid-range supply block).
Long 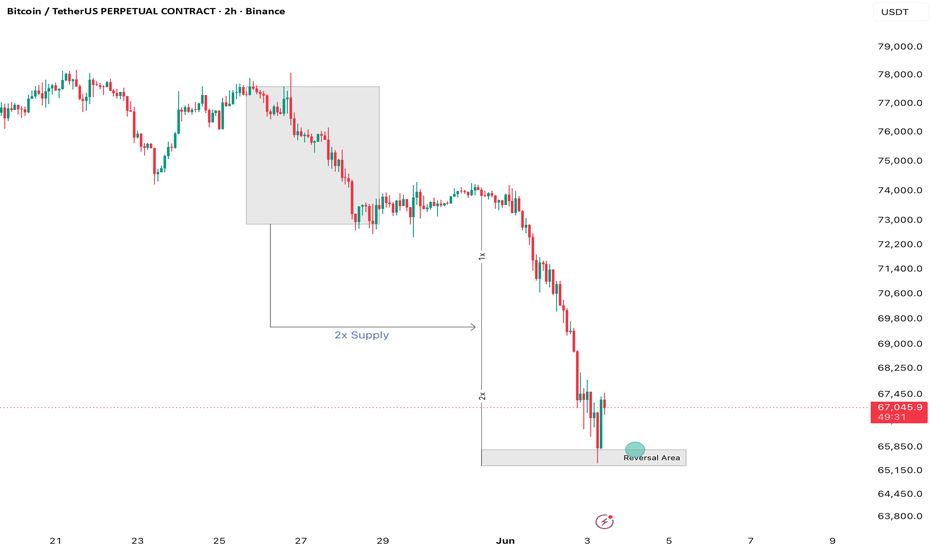
Short 
Short 
 Short
Short
Education

Part 1: Doji Trap - Why Traders Misread Market IndecisionHello Traders, this article has two parts: theory for understanding the concept, and practical for real market application.
What is a Doji?
---------------------
A Doji candlestick forms when the open and close prices are nearly equal. It shows that buyers and sellers fought, but neither side gained clear control. Think of it like a tug of war ending in a draw.
Psychology Behind It
----------------------------
A doji tells you:
1. Buyers pushed the price
2. Sellers pushed back
3. Market paused
4. Uncertainty exists
This often happens:
1. Before reversals
2. During trend exhaustion
3. Before breakouts
4. During consolidation
Yet, doji alone means nothing without context.
Types of Doji: (3 line explaination)
--------------------
1. Standard Doji
It has a small body with upper and lower wicks.
Meaning: pure indecision.
Setup: Wait for the confirmation candle.
2. Long-Legged Doji
It has Long upper and lower shadows.
Meaning: extreme battle between buyers and sellers.
Setup: Often appears before big moves.
3. Dragonfly Doji
It Looks like a “T.”
Open, close, and high are nearly the same.
The lower shadow is long.
Meaning: Sellers pushed down, but buyers rejected lower prices.
Setup: Usually bullish if found at support
.
4. Gravestone Doji
It looks like an upside-down “T.”
Long upper wick.
Meaning: Buyers pushed higher, but sellers rejected it.
Usually bearish at resistance.
5. Four Price Doji
It shows almost no movement.
It's Rare.
It shows an extreme lack of activity.
It usually has low liquidity.
How to Read Doji Correctly?
-------------------------------------
1. Where did it form?
At support = reversal
At resistance = rejection
At the middle of the range = often noise
2. What trend came before it?
After a strong uptrend? = Possible exhaustion
After a strong downtrend, = Possible buyer absorption
In the Sideways market, = Usually meaningless
3. Volume:
High volume doji = stronger signal
Low volume doji = weak signal
4. Confirmation candle:
Bullish confirmation - Next candle closes above the doji high
Bearish confirmation - Next candle closes below the doji low
Best Doji Trading Setups
---------------------------------
1. Reversal Setup
This setup appears after the market has already moved strongly in one direction and begins to lose momentum.
A doji forms near an important support or resistance zone, showing that the dominant side is starting to weaken.
It reflects hesitation as buyers and sellers reach a temporary balance after an extended trend.
The setup becomes valid only when the next candle confirms the reversal by breaking strongly in the opposite direction.
This is considered a high-probability setup because it often marks exhaustion before a trend change.
2. Breakout Pause Setup
This setup develops when the price is consolidating within a narrow range before making its next move.
A doji appears near a key breakout area, signaling temporary indecision and reduced momentum.
This pause often represents the market gathering energy before a strong expansion.
If the next candle breaks decisively above resistance or below support, it confirms the breakout direction.
Traders use this setup to identify explosive moves that begin after short periods of compression.
3. Fakeout Trap Setup
This setup occurs when the price briefly breaks above resistance or below support, creating the illusion of a real breakout.
A doji then forms, revealing hesitation and lack of conviction in the breakout attempt.
This often signals that the move was designed to attract breakout traders into weak positions.
Once trapped traders enter, the price sharply reverses back inside the range.
This setup is highly effective for spotting false breakouts and trading the reversal back toward liquidity.
4. Smart Money Trap Setup
This setup happens when institutional players intentionally push prices beyond obvious technical levels.
The purpose is to trigger retail stop-losses and create liquidity for larger market participants.
A doji often forms at this point, showing indecision as smart money absorbs positions from emotional traders.
The sharp rejection that follows confirms the liquidity sweep and reveals the true market direction.
This setup is especially powerful for traders who understand market structure, stop hunts, and liquidity-based price action.
Common Beginner Mistakes
-----------------------------------------
❌ Trading every doji as if it is a direct buy or sell signal without first analyzing the overall market context and structure.
❌ Ignoring the surrounding market structure, such as trend direction, key support and resistance zones, and liquidity areas where the doji is forming.
❌ Entering trades immediately after spotting a doji without waiting for a confirmation candle to validate the market’s next direction.
❌ Overlooking volume analysis, which often reveals whether the doji represents genuine indecision or simply weak market participation.
❌ Relying only on very low timeframes, where doji candles frequently appear as random market noise rather than meaningful price action signals.
A doji is a clue, not a complete trading signal, and its real value comes only when it is combined with context, confirmation, and proper market analysis.
]Practical Trading Rules [
--------------------------------
Always identify the overall market trend before acting on a doji signal.
Mark nearby support, resistance, and liquidity zones where a doji forms.
Wait for confirmation from the next candle before entering a trade.
Use stop-loss placement beyond the doji wick for better risk control.
Never trade a doji in isolation without a supporting market context.
A Doji is not a buy or sell signal by itself. It is a message from the market that momentum is pausing and a decision is approaching. Traders who combine doji analysis with structure, volume, confirmation, and liquidity concepts can transform a simple candlestick into a powerful decision-making tool.
Please wait for the next part, where we will cover the practical side in detail.  Education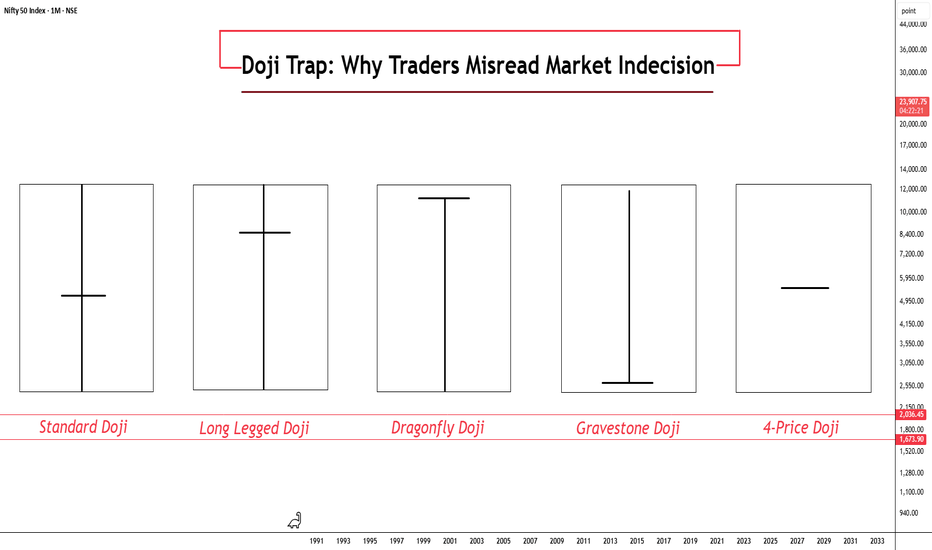
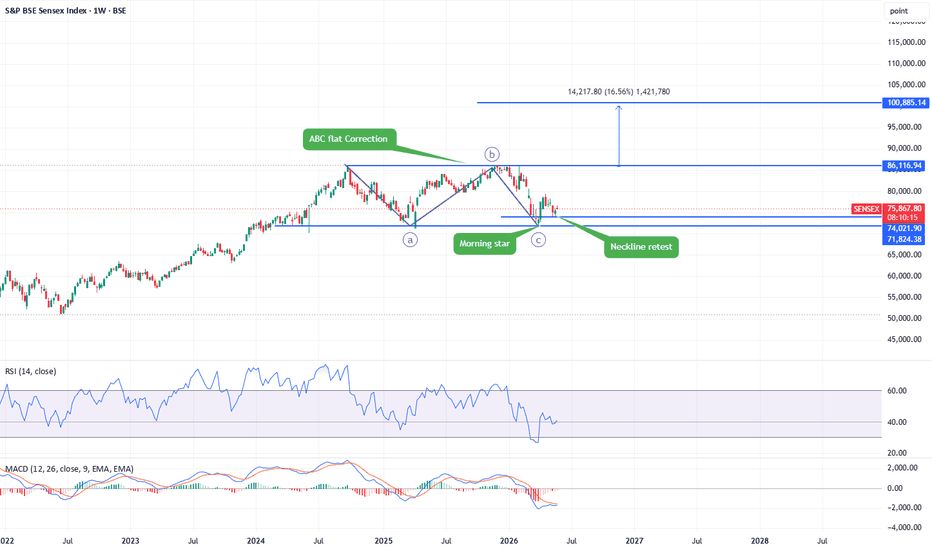
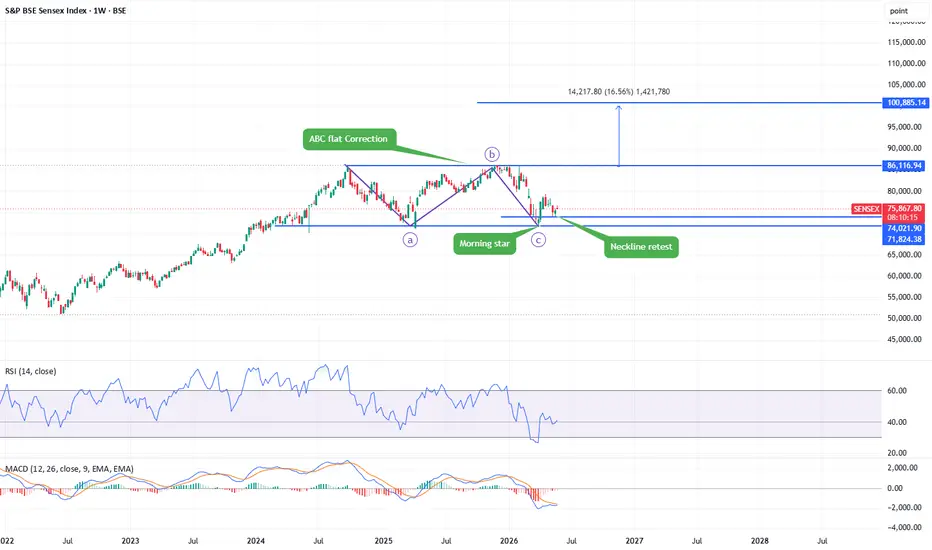
SENSEX Weekly Chart AnalysisSENSEX Weekly Chart Analysis
Chart Structure Overview
Current Price: 75,867.80
Timeframe: Weekly (W) chart on BSE
Date: May 29, 2026
Elliott Wave / Pattern Analysis
ABC Flat Correction
The analyst has identified a classic ABC Flat Correction pattern:
The C wave appears to have bottomed near the 71,824 support level
A Morning Star candlestick pattern formed at the C-wave low — a strong bullish reversal signal
Price is now doing a Neckline Retest after bouncing — this is the critical make-or-break zone (~74,000–75,800)
Key Price Levels
Level Significance100,885 Major target / projected breakout level (+16.44% from resistance) 86,116 Strong resistance / neckline of the flat correction
75,867 Current price 74,021 Immediate support
71,824 Strong base support / C-wave bottom
Trading & Investment Opportunities
🟢 Bullish Case (Primary Scenario)
If the neckline retest holds around 74,000–76,000:
Entry Zone: 74,000–76,500 (current area)
Stop Loss: Below 71,500 (below C-wave low)
Target 1: 86,116 (resistance/neckline)
Target 2: 1,00,885 (long-term projected target)
🔴 Bearish / Caution Case
If price fails the neckline retest and closes below 74,000:
Could signal the ABC correction isn't complete
Next support: 68,000–70,000 range
Wait for price to stabilize before re-entering
 Long
Long