The Geometry of a Contraction Pattern01 The Anatomy of a Flip Zone
A Flip Zone is one of the most structurally significant phenomena in technical price action analysis. It describes a price zone,most meaningful when observed on the monthly time frame, that first acted as a formidable resistance ceiling over multiple touches, and subsequently, following a decisive Breakout Candle, requalified itself as a demand zone beneath price.
The mechanism is grounded in market memory. Institutional participants who previously defended that resistance level now shift their posture: the same supply that capped price on the way up becomes the structural support that cushions any retest on the way down. This conversion is not instantaneous - it is confirmed by how price behaves on its return visit to the zone.
Core Principle
A Flip Zone is not a line. It is a contextual reclassification of a prior supply cluster — validated only when price revisits the zone and structure holds.
02 The Breakout Candle — Structural Reclassification
The catalyst for the flip is the Breakout Candle: a high-momentum close that absorbs the overhead supply and clears the prior resistance zone with authority. This candle represents a decisive shift in the demand-supply equilibrium, What makes this candle consequential on the monthly time frame is the weight of the timeframe itself.
Structural Note
The quality of the flip is directly proportional to the quality of the breakout. A convincing, high-volume breakout candle creates a more structurally robust demand zone upon retest.
03 The Descending Triangle
Classical technical analysis characterizes the Descending Triangle as a bearish continuation pattern — a series of lower highs pressing against a horizontal support floor, with the implication of a downside breakdown. This characterization is correct in isolation.
The critical word is isolation.
When a descending triangle forms above a validated monthly Flip Zone, following a one-sided bullish rally, the structural context inverts the conventional expectation. What appears as distribution or topping is, in fact, a contraction pattern — price digesting its own momentum, compressing within a range where demand is structurally anchored beneath it.
Published for educational purposes only.
All concepts — Flip Zone, Equal Highs, Equal Lows, Descending Triangle, Breakout Candle — are referenced in the context of historical price structure analysis.
This is not financial advice. Past price behavior does not determine future outcomes.
Candlestick Analysis
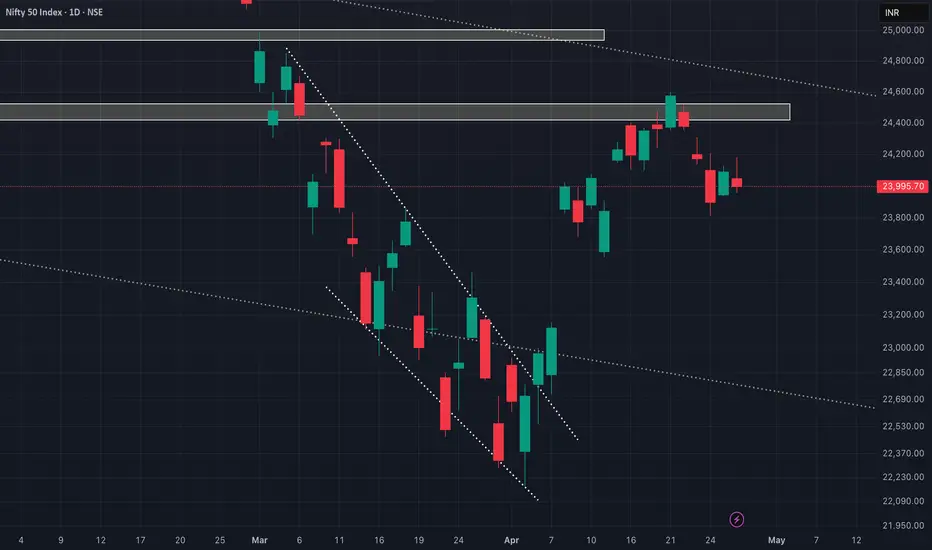
Has the winning already factored in!?As we can see NIFTY failed to make a strong bullish candle despite BJP’ landslide victory in West Bengal. This indecision shows that the victory rally has been already factored in and hence we must focus on structure now. We may see NIFTY opening strong but we must focus if NIFTY manages to hold itself above. The structure in the bigger TF looks weak, hence we may expect NIFTY to get weaker below previous candle’s closing. So plan your trades accordingly and keep watching everyone.
Institution Option Trading Part-2PCR (Put-Call Ratio) – Institutional Trading Strategy
What is PCR?
PCR = Put OI ÷ Call OI
It shows market sentiment of big players in indices like NIFTY 50.
Institutional Psychology
2. How Big Players Use PCR
Retail buys options randomly
Institutions control PCR zones to trap traders
👉 You follow PCR = You follow smart money
📈 PCR Levels (Game Changer)
3. Key Zones
PCR < 0.7 → Bearish sentiment (too many Calls) → ⚠️ Reversal possible
PCR 0.7 – 1 → Neutral zone
PCR > 1.2 → Bullish sentiment (too many Puts) → ⚠️ Reversal possible
👉 Extreme PCR = Trap zone (Institutional move coming)
🔥 Pro Institutional Setup
4. Entry Logic
PCR very high (1.3+) + Resistance → SELL (market fall likely)
PCR very low (0.6-) + Support → BUY (market bounce likely)
Technical Analysis VS. Institutional Option TradingAdvantages of Options Trading
Leverage: Options allow traders to control large positions with a smaller amount of capital, amplifying potential returns.
Flexibility: Traders can profit in bullish, bearish, or sideways markets depending on the strategy used.
Hedging: Options are effective tools for reducing risk in existing portfolios.
Income Generation: Selling options, like covered calls, allows investors to earn consistent
NIFTY will get weaker below 23900 levels!As we can see NIFTY got back in the direction anticipated in our previous analysis. We can now expect NIFTY to get even more weaker if broke below 23900 level as it would make a structure of head and shoulders which is a strong bearish pattern. So, plan your trades accordingly and keep watching.
IGB 10Y Weekly UpdateIGB 10Y traded in the tight range of 6.86%-6.98% for the last week, amid unsettling geopolitical tensions and rising crude oil prices. Unless there is a big positive or negative news, market is expected to trade in the similar range for the current week as well. If it breaches this range, 7.06% can act as a support level, and 6.78-6.80% as a resistance level.
Let me know your thoughts. DYOR
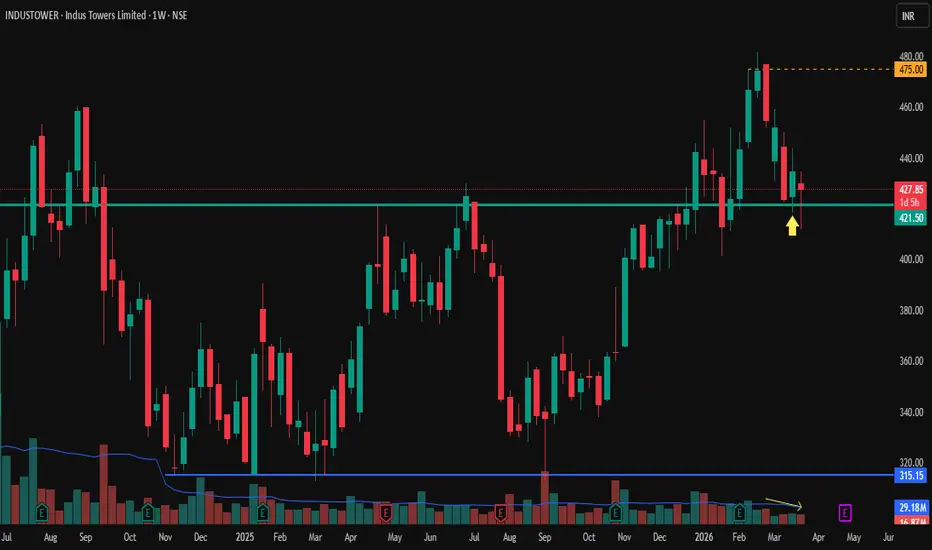
Swing Trade Idea – INDUSTOWER (1W)INDUSTOWER weekly setup, Swing trade.
Context :
After a strong upmove towards 480, the stock has seen a healthy pullback and is now consolidating near the 420 demand zone. This zone has acted as a strong support multiple times in the past, indicating accumulation. The structure still remains bullish with higher highs & higher lows intact. Current price action suggests a pause rather than reversal.
Setup :
Buy Zone: 420–425 (on dip) or breakout above 440
Targets: 460 / 475
Stop Loss: 410 (closing basis)
Key Insight :
Pullback looks corrective, not impulsive
Volume drying near support → possible supply exhaustion
Break above 440 can trigger momentum continuation
Plan:
Wait for either support confirmation (rejection candle) or range breakout with volume before entering.
Disclaimer :
This is for educational purposes only. Manage risk properly.
NMDCNMDC is coming out of consolidation after long 4 months. So now as long as it is above 82 then it seems it may continue to rise higher and higher. The high since 2010 is nr 102. SO if it rises above 102 then there is v high probability that it will enter in to long term bullish zone and have potential to give multi fold return from there on. Keep it in watch-list and grab the opportunity whenever risk-reward is in your favor.
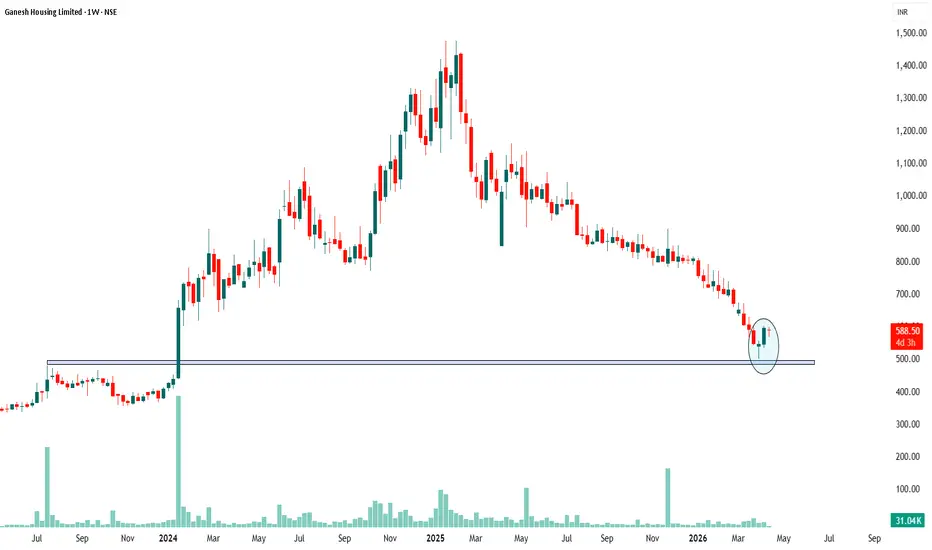
Ganesh Housing – Support & Bullish Reversal ExplainedGanesh Housing had a massive rally from ₹500 all the way to nearly ₹1,400 in 2024 — almost a 3x move. But after that peak, the stock spent all of 2025 giving back those gains, grinding lower week after week until it landed right back where it all started — the ₹500 zone.
That level isn't random. It's where huge buying had happened back in early 2024, which is what launched the big rally in the first place. When price revisits such a zone, those same buyers tend to show up again to defend it — and that's exactly what happened here. Price briefly spiked below ₹500, got rejected hard, and snapped back to close at ₹589. That long lower wick tells you sellers tried to push it down and simply couldn't hold it there.
One small correction on the pattern — what's circled is close to a Morning Star but not quite textbook. A proper Morning Star needs three candles with a small indecision candle in the middle. What's visible here is better described as a bullish rejection or hammer at support. Same bullish message, just be precise with the label.
The big picture though is clear — a historically strong support level held, and buyers responded with conviction. From here, watch whether the price can sustain above ₹500 on weekly closing basis. If it builds higher lows from here, a move back toward ₹700 becomes realistic. A weekly close below ₹500 however would be a red flag and the setup would be off the table.
Promising chart, but confirmation over the next couple of weeks is what really matters.
This is purely for educational purposes and not financial advice. Always consult a SEBI-registered advisor before making any investment decisions.*
Honasa Consumer - Breakout after 1 year consolidationHonasa Consumer owns brands viz. Mama Earth; B Blut, Dr. Sheth; etc - a complete business line for cosmetics. Why this tock is heading for a big rise:
1. Multiple brands and not dependent on one brand
2. Growth of its products are rising
3. Last Quarter has best results
4. Technically, after falling 60%, it has given a breakout after 1 year with good volumes
5. Golden cross-over - 20EMA crossing over 50 & 200EMA
6. Promoters have increased stake in the company on QvQ
Given the above, the stocks is looking solid and is heading to move upwards.
Keep following @cleaneasycharts as we provide Right Stocks at Right Time at Right Price.
Cheers!!
TESLA: Does the Bullish Hammer Signal a Structural Reversal?Technical Context
TSLA has printed a bullish hammer at $337.24 , converging with descending parallel channel support and terminating an ABC zigzag decline (Wave W). RSI momentum at 34.70 indicates downside deceleration. As defined in Steve Nison's Japanese Candlestick Charting Techniques , this morphology fulfills the exact prerequisites for a valid, high-probability reversal signal.
Bullish Scenario
The thesis dictates the initiation of an upward connector Wave (X). The hammer's structure signals aggressive institutional accumulation at channel support, rendering it an actionable pivot without requiring subsequent structural confirmation.
Trigger: Actionable at the current closing price of $347.16 .
Target: A primary resistance zone spanning from $418.04 (0.5 Fibonacci retracement) to $437.10 (0.618 Fibonacci retracement, establishing confluence with the prior Wave B peak).
Invalidation (Stop Loss): A daily close below the absolute low of the hammer at $337.24 .
Disclaimer: This analysis is for educational purposes only and does not constitute investment advice. Please make your own decisions before making any trading decisions.
Birlasoft Limited (BSOFT) – Weekly Technical Outlook Birlasoft Limited (BSOFT) – Weekly Technical Outlook
The stock is currently trading near a strong demand zone, aligning closely with the 78.6% Fibonacci retracement of the previous major uptrend. This level historically acts as a critical support, increasing the probability of a technical bounce.
Key Technical Factors:
📉 Support Zone: ₹330 – ₹350 (strong base formation)
🔁 Positive Divergence: Visible on RSI, indicating weakening downside momentum
🕯️ Weekly Structure: Formation of a potential bullish engulfing pattern, suggesting early signs of reversal
📊 Volume Behaviour: Stabilizing near support, hinting at accumulation
Trade Setup:
Buy Zone: ₹350 – ₹370
Target (Short to Medium Term): ₹450
Stop Loss: Below ₹320 (closing basis)
View:
The confluence of Fibonacci support + RSI divergence + bullish candle formation strengthens the case for a technical pullback rally. A sustained move above ₹400 can further accelerate upside momentum toward ₹450 levels.
GMDC (Gujarat Mineral Dev Corp) — Positional Breakout SetupNSE:GMDCLTD
CMP: ₹582
Structure: Range → Accumulation → Potential Breakout
Trade Setup
Buy Zone: ₹580 – ₹600
Breakout Confirmation: Above ₹600 (closing basis)
Target Zones:
₹630 (short-term)
₹650 (swing)
₹680+ (positional)
🔻 Stop Loss: ₹540 (below structure support)
Risk Factors :
Rejection near ₹600 may lead to range continuation
Breakdown below ₹540 → setup invalid
Axis Bank – Monthly Chart Analysis short opportunity📊 Axis Bank – Monthly Chart Analysis
Potential Short Opportunity
Double Top Formation:
Price has formed a clear double top pattern near the ₹1300–₹1350 zone, indicating strong resistance.
Bearish Divergence (RSI):
Momentum indicator (RSI) is showing lower highs while price formed higher highs — a classic sign of weakening bullish momentum.
Evening Star Pattern (Monthly):
A confirmed evening star candlestick pattern on the monthly timeframe strengthens the probability of a medium-term reversal.
📉 Trading Strategy
Sell Zone: ₹1280 – ₹1320 (on pullback/rise)
Target 1: ₹1050
Target 2: ₹950
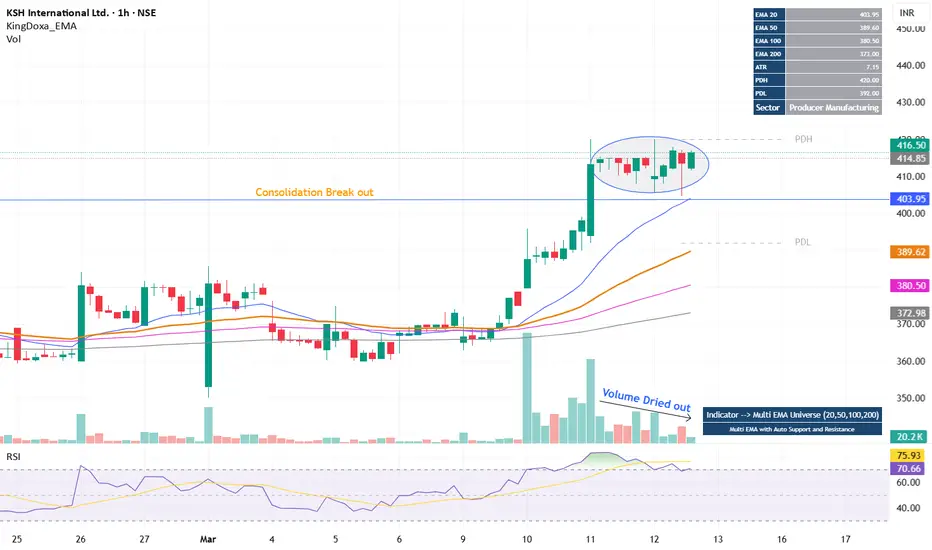
KSHINTL - A IPO breakout formedNSE:KSHINTL
Price came out of daily consolidation range.
Breakout with massive volume sustained and gave clear close above
Price again consolidated but volume dried up.
Long up move may be possible
Strict SL is advised here
Daily Chart
Warning: Trading without knowledge depth, experience and proper risk management may be harmful. I am not a registered analyst, here I am only sharing my view to trading communities, this is not any recommendation.
Do consult your financial advisor prior any trade.
Positional or Longterm Opportunity in AIILGo Long @ 488.5 for Targets of 543.7, 598.9 and 654.1 with SL 433.3
Reasons to go Long :
1. On Weekly timeframe If we draw Fibonacci retracement from the recent swing low (A) to the swing high (B) then the stock took support from the 0.5 Fibonacci level.
2. The stock formed a Bullish Engulfing Pattern (marked with a orange color).
3. Also there is a strong Trendline (marked with green color) which supports the stock.