Candlestick Analysis
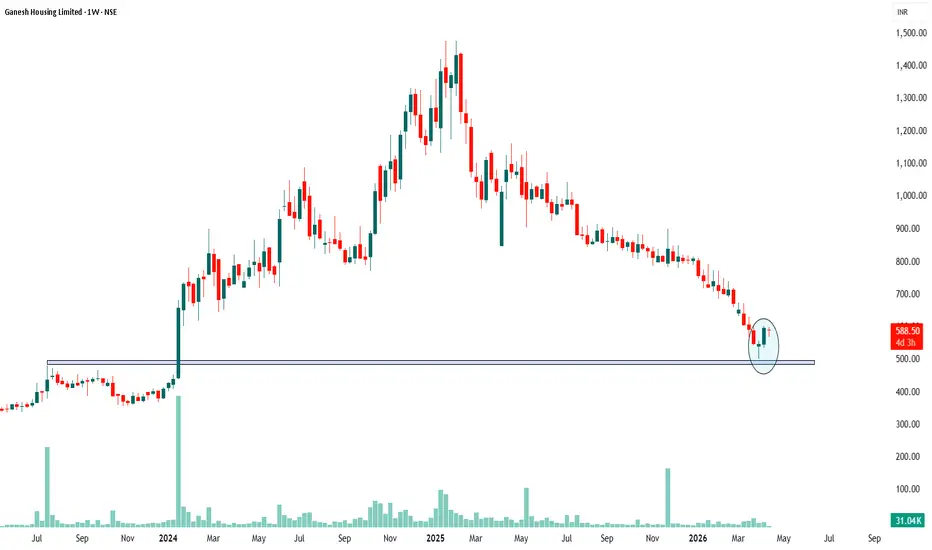
Ganesh Housing – Support & Bullish Reversal ExplainedGanesh Housing had a massive rally from ₹500 all the way to nearly ₹1,400 in 2024 — almost a 3x move. But after that peak, the stock spent all of 2025 giving back those gains, grinding lower week after week until it landed right back where it all started — the ₹500 zone.
That level isn't random. It's where huge buying had happened back in early 2024, which is what launched the big rally in the first place. When price revisits such a zone, those same buyers tend to show up again to defend it — a
Honasa Consumer - Breakout after 1 year consolidationHonasa Consumer owns brands viz. Mama Earth; B Blut, Dr. Sheth; etc - a complete business line for cosmetics. Why this tock is heading for a big rise:
1. Multiple brands and not dependent on one brand
2. Growth of its products are rising
3. Last Quarter has best results
4. Technically, after falling 60%, it has given a breakout after 1 year with good volumes
5. Golden cross-over - 20EMA crossing over 50 & 200EMA
6. Promoters have increased stake in the company on QvQ
Given the above, the sto
TESLA: Does the Bullish Hammer Signal a Structural Reversal?Technical Context
TSLA has printed a bullish hammer at $337.24 , converging with descending parallel channel support and terminating an ABC zigzag decline (Wave W). RSI momentum at 34.70 indicates downside deceleration. As defined in Steve Nison's Japanese Candlestick Charting Techniques , this morphology fulfills the exact prerequisites for a valid, high-probability reversal signal.
Bullish Scenario
The thesis dictates the initiation of an upward connector Wave (X). The hammer's structu
Birlasoft Limited (BSOFT) – Weekly Technical Outlook Birlasoft Limited (BSOFT) – Weekly Technical Outlook
The stock is currently trading near a strong demand zone, aligning closely with the 78.6% Fibonacci retracement of the previous major uptrend. This level historically acts as a critical support, increasing the probability of a technical bounce.
Key Technical Factors:
📉 Support Zone: ₹330 – ₹350 (strong base formation)
🔁 Positive Divergence: Visible on RSI, indicating weakening downside momentum
🕯️ Weekly Structure: Formation of a potential
GMDC (Gujarat Mineral Dev Corp) — Positional Breakout SetupNSE:GMDCLTD
CMP: ₹582
Structure: Range → Accumulation → Potential Breakout
Trade Setup
Buy Zone: ₹580 – ₹600
Breakout Confirmation: Above ₹600 (closing basis)
Target Zones:
₹630 (short-term)
₹650 (swing)
₹680+ (positional)
🔻 Stop Loss: ₹540 (below structure support)
Risk Factors :
Rejection near ₹600 may lead to range continuation
Breakdown below ₹540 → setup invalid
Axis Bank – Monthly Chart Analysis short opportunity📊 Axis Bank – Monthly Chart Analysis
Potential Short Opportunity
Double Top Formation:
Price has formed a clear double top pattern near the ₹1300–₹1350 zone, indicating strong resistance.
Bearish Divergence (RSI):
Momentum indicator (RSI) is showing lower highs while price formed higher highs — a classic sign of weakening bullish momentum.
Evening Star Pattern (Monthly):
A confirmed evening star candlestick pattern on the monthly timeframe strengthens the probability of a medium-term reversal.
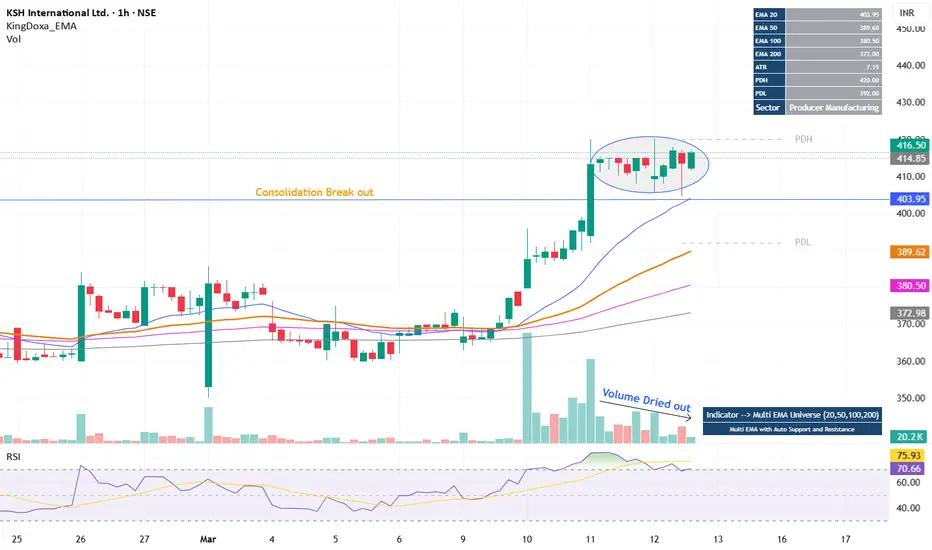
KSHINTL - A IPO breakout formedNSE:KSHINTL
Price came out of daily consolidation range.
Breakout with massive volume sustained and gave clear close above
Price again consolidated but volume dried up.
Long up move may be possible
Strict SL is advised here
Daily Chart
Warning: Trading without knowledge depth, experience and proper risk management may be harmful. I am not a registered analyst, here I am only sharing my view to trading communities, this is not any recommendation.
Do consult your financial advisor prior
Positional or Longterm Opportunity in AIILGo Long @ 488.5 for Targets of 543.7, 598.9 and 654.1 with SL 433.3
Reasons to go Long :
1. On Weekly timeframe If we draw Fibonacci retracement from the recent swing low (A) to the swing high (B) then the stock took support from the 0.5 Fibonacci level.
2. The stock formed a Bullish Engulfing Pattern (marked with a orange color).
3. Also there is a strong Trendline (marked with green color) which supports the stock.
Gold at Key Support: Bounce or Breakdown?Gold is currently trading near a critical demand zone between $5040–$5055, which has acted as a strong support area during recent price action. This zone is important because buyers have repeatedly stepped in here to defend prices and prevent deeper declines.
If buyers continue to defend this support, gold could maintain its bullish structure and attempt a move higher. The next key upside target would be the nearby resistance zone around $5170–$5200, where previous selling pressure has appeared
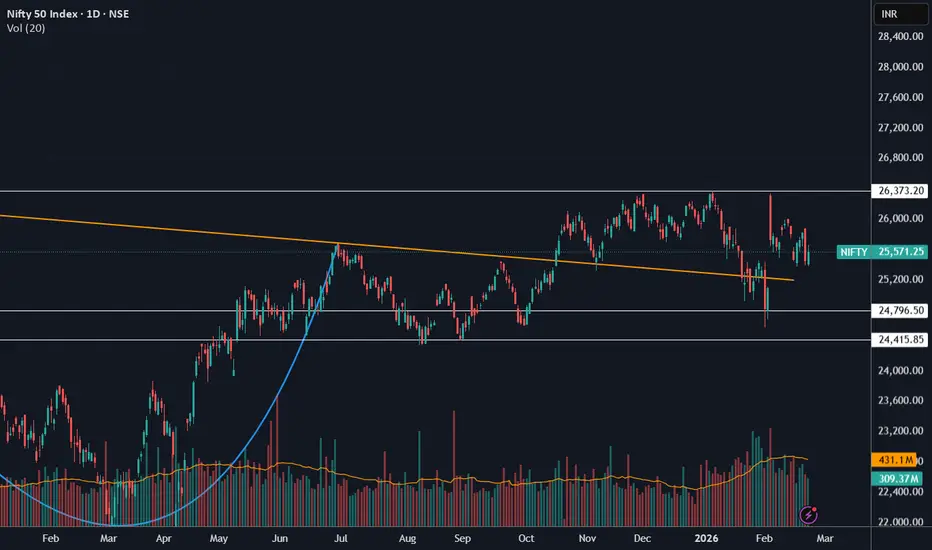
NIFTY Weekly UpdateNIFTY is expected to trade in the range of 24800-26380 levels for the upcoming week. 26380 has been acting as a strong resistance since last few months, and I expect this will continue for the week. A close above this level(26400), will fuel the rally. On the downside, a breach of 24800 levels, likley to take NIFTY to its next support level of 24400.
Last Hope Of Asian paintNSE:ASIANPAINT
Last hope of Asian paint is near to break or make.
weekly time frame shows negative price action totally
daily time frame have also but in that time frame show spinning tops with high volume 2 times but price still not break his first near resistance around 2460.
If weekly down move continue then target is 1850 and also that price have support line.
Upside also limited area near to 2600.
please do your own research before taking any trade.
i am not financial advisor
risk is r
ONGCONGC
Price above all EMA on weekly and daily chart shows its strength.
Recently it closes above its weekly/monthly range and price sustain above the level.
May have little hurdle near 290-300 but then it moves above 300
QoQ shows improving
Rest sectorial stocks like BPCL, IOC, MGL etc are showing showing strong moves.
NB: I am not a Registered analyst, do take advice from your financial advisor prior trade.
IGB 10Y Weekly UpdateIndia Goverment Bonds 10Y for the coming week are expected to trade in the range of 6.65%-6.78%. 6.65% has been acting as a crucial support since last few weeks and it expected to remain the same. If it breaches, this level, it likely to find support at 6.60%, which acted as resistance in the earlier range bound motion. On the upside, if it breaches 6.75% level,it may find resistance at 6.88% levels.
EUR/USD – Tactical Short
1H Supply Repricing Within Established Bearish Order Flow
Execution Timeframe: 5M | Risk Model: Intraday Tactical Allocation
I. Market Context & Structural Bias
EUR/USD remains in a clearly defined 1H bearish auction structure, characterized by sequential lower highs and lower lows. The latest expansion leg has printed a fresh 1H lower low, confirming downside initiative and continuation order flow.
The current upward move is a corrective repricing phase into