Nifty 50 Weekly Analysis [21 Sep - 25 Sep, 2026]Probable Price Structure and Scenario Analysis for the Nifty 50. It is a weekly analysis (21st to 25th of September, 2026).
🟢 Bullish Scenario
Presently, there is no bullish scenario. The main trend is bearish. All the upmoves should be doubted. But there are signs of a trend reversal. There is a possibility of a "Dead Cat Bounce." If the price sustains above 23400, then weak bullish moves can be observed. The probable weak bullish targets above 23400 are - 23450 and 23500. There will be strong resistance at the 23500 level. Next, if the price breaks out above 23500, then a strong bullish move can be observed. The probable strong bullish targets above 23500 are - 23550, 23600, 23650, and 23700.
🔴 Bearish Scenario
Presently, the price is in a bearish to indecision zone. However, level 23250 might offer strong support. If the price breaks down below 23250, then stay bearish. The first target might be 23200. Level 23200 is a weak support level. Next, strong selling might be observed if the price breaks down below 23200. The probable bearish targets below 23200 are - 23150, 23100, 23050, and 23000. The zone (23050 - 23000) is a strong support zone (SSZ)/
🟡 No Trading Zone (NTZ): (23400 - 23250).
⏺ Range of Consolidation (ROC): (23500 - 23000).
Here, 23250 is the median of the ROC. The median works like a trading session sentiment evaluator. The price trading above the median would offer bullish sentiment, while the price trading below the median would trigger bearish sentiment within the ROC.
● Event
There's no high-impact event this week. There's no holiday this week. However, geopolitical issues are omnipresent and beyond our control.
● Intraday, Weekly, and Monthly Bias
Establish bias with respect to the opening price (of the particular session - Intraday, Weekly, and Monthly). If the price sustains above the opening price, then don't think of shorting. Look for bullish trades only. On the contrary, if the price sustains below the opening price, then don't think of going long. Look for bearish trades in that case.
● Disclaimer + End Note
- All the analyses would fail in the case of a major gap up, gap down, or price structure anomaly. Thus, practice PRAGMATISM in the live session.
- Trade only if there is a set-up. Remember, not trading is an extension of the trading activity.
- Mark your points. Trade your points. Price is GOD. Anything can happen in the markets. Thus, trade what you see, not what you believe.
- Always PRACTICE RISK MANAGEMENT. Always PROTECT YOUR CAPITAL. Be RESPONSIBLE.
- Be Strategic. Be Courageous. Be Patient. Be Wise.
- Every day is a new day. Thus, do not carry the baggage of past successes or failures. Leave the gardens of winning and losing. Establish yourself in equanimity. Always think from a new perspective.
- Let the joy of trading drive your effectiveness, not greed or fear. Believe in Possibilities.
Happy Trading! SENSEX Weekly Analysis [21 Sep - 25 Sep, 2026]Probable Price Structure and Scenario Analysis for the SENSEX BSE:SENSEX Index. It is a weekly analysis (21st to 25th of September, 2026).
🟢 Bullish Scenario
Presently, there is no bullish scenario. The main trend is bearish. All the upmoves should be viewed with suspicion. But there are signs of a trend reversal. There is a possibility of a "Dead Cat Bounce." If the price sustains above 74750, then a weak bullish target would be 75000. Next, if the price sustains above 75000, then a mild bullish move might be observed. The probable mild bullish move above 75000 would be - 75250 and 75500. There will be strong resistance at 75500. Lastly, if the price sustains above 75500, then a strong bullish move might emerge. The probable strong bullish targets above 75500 would be - 75750, 76000, 76250, and 76500.
🔴 Bearish Scenario
Presently, the price is in a bearish to indecision zone. However, level 74250 might offer strong support. If the price breaks down below 74250, then stay bearish. The first target might be 74000. Level 74000 is a weak support level. Next, strong selling might be observed if the price breaks down below 74000. The probable bearish targets below 74000 would be - 73750 and 73500. There will be strong support at 73500. Lastly, if the price breaks down below 73500, then the probable bearish targets would be - 73250, 73000, and 72750.
🟡 No Trading Zone (NTZ): (74750 - 74250).
⏺ Minor Range of Consolidation (Mi-ROC): (75000 - 74000).
Here, 74500 is the median of the ROC. The median works like a trading session sentiment evaluator. The price trading above the median would offer bullish sentiment, while the price trading below the median would trigger bearish sentiment within the ROC.
⏺ Major Range of Consolidation (Ma-ROC): (75500 - 73500).
Here, 74500 is the median of the ROC. The median works like a trading session sentiment evaluator. The price trading above the median would offer bullish sentiment, while the price trading below the median would trigger bearish sentiment within the ROC.
● Event
There's no high-impact event this week. There's no holiday this week. However, geopolitical issues are omnipresent and beyond our control.
● Intraday, Weekly, and Monthly Bias
Establish bias with respect to the opening price (of the particular session - Intraday, Weekly, and Monthly). If the price sustains above the opening price, then don't think of shorting. Look for bullish trades only. On the contrary, if the price sustains below the opening price, then don't think of going long. Look for bearish trades in that case.
● Disclaimer + End Note
- All the analyses would fail in the case of a major gap up, gap down, or price structure anomaly. Thus, practice PRAGMATISM in the live session.
- Trade only if there is a set-up. Remember, not trading is an extension of the trading activity.
- Mark your points. Trade your points. Price is GOD. Anything can happen in the markets. Thus, trade what you see, not what you believe.
- Always PRACTICE RISK MANAGEMENT. Always PROTECT YOUR CAPITAL. Be RESPONSIBLE.
- Be Strategic. Be Courageous. Be Patient. Be Wise.
- Every day is a new day. Thus, do not carry the baggage of past successes or failures. Leave the gardens of winning and losing. Establish yourself in equanimity. Always think from a new perspective.
- Let the joy of trading drive your effectiveness, not greed or fear. Believe in Possibilities.
Happy Trading! Syrma SGS Technology Ltd - Breakout Setup, Move is ON...#SYRMA trading above Resistance of 1642
Next Resistance is at 2579
Support is at 1272
Here are previous charts:
This weekly chart for Syrma SGS Technology Limited displays a strong bullish breakout from a consolidation pattern, supported by significant volume and long-term trendline context.
Chart Overview
Timeframe & Asset: Syrma SGS Technology Limited (1-Week Chart, NSE).
Current Price: 1,728.90 INR (+8.78% change shown on the chart header).
Key Technical Observations
Horizontal & Channel Breakout: The stock consolidated within an ascending mini-channel (white lines) and horizontal consolidation zone before breaking out above 679.00 INR, marked by the yellow Breakout arrow.
Volume Expansion: The blue arrow highlights a substantial surge in trading volume during the initial breakout phase, confirming strong institutional buying conviction.
Support Levels:
679.00 INR (Yellow Line): The horizontal level corresponding to the initial breakout point and dynamic base support.
1,159.00 INR (Red Line): A major horizontal level (marked with a red arrow) that previously acted as resistance before flipping to become the primary structural support level on subsequent pullbacks.
Resistance Levels:
Resistance 1 (1,272.00 INR): A structural resistance level (green line) that the price previously interacted with during the consolidation phase.
Resistance 2 (1,642.00 INR): A structural resistance level (green line) that the current price candle has tested and breached to trade at 1,728.90 INR.
Resistance 3 (2,579.00 INR): The long-term upside projection level marked near the top green line.
Long-Term Trend Lines: The solid blue lines form a multi-year ascending channel that defines the macro uptrend, with the price currently advancing along the upper expansion zone above this channel.
Conclusion & Current Price Action
The current price action reflects strong bullish momentum following the volume-backed breakout above 679.00 INR and a successful retest of the 1,159.00 INR support zone. The stock has recently cleared its immediate hurdle at Resistance 2 (1,642.00 INR).
A sustained weekly close above this Resistance 2 zone indicates room for extended upside toward the long-term upside projection level of 2,579.00 INR (Resistance 3). On any potential pullbacks, the 1,159.00 INR level will serve as the primary line of defense for buyers to keep the structural uptrend intact.
A parallel channel (also known as an ascending, descending, or horizontal channel) is a technical analysis pattern bounded by two parallel trendlines that encompass a security’s price action over time.
Structure & Mechanics
Main Components:
Trendline / Base Line: Connects a series of prominent reaction lows (in an uptrend) or reaction highs (in a downtrend).
Channel Line: Drawn parallel to the trendline, connecting the peaks (top boundary) or troughs (bottom boundary).
Price Movement: Price oscillates between the upper boundary (which acts as dynamic resistance) and the lower boundary (which acts as dynamic support).
Types of Channels
Ascending Channel (Bullish): Characterized by higher highs and higher lows. Indicates a steady uptrend where buying pressure dominates.
Descending Channel (Bearish): Characterized by lower highs and lower lows. Represents a controlled downtrend or corrective pullback.
Horizontal Channel (Consolidation): Moving sideways between static support and resistance lines, signaling market indecision or range-bound trading.
How Traders Use Parallel Channels
Trading Within the Range: Buying near the channel's lower boundary (support) and selling or shorting near the upper boundary (resistance).
Breakout Trading: A strong, high-volume candle breaking outside either boundary signals potential trend acceleration or continuation in the direction of the breakout (as seen in the charts provided previously).
Midline (50% Line): Often, a dashed line is drawn down the middle of the channel. Price reacting to this midline can confirm the channel's validity and act as interim support or resistance.
Disclaimer: This is for demonstration and educational purpose only. This is not buying or selling recommendations. I am not SEBI registered financial advisor. Please consult your financial advisor before taking any trade.  Long
Long
Nifty MidCap Select Weekly Analysis [21 Sep - 25 Sep, 2026]Probable Price Structure and Scenario Analysis for the Nifty MidCap Select NSE:NIFTY_MID_SELECT Index. It is a weekly analysis (21st to 25th of September, 2026).
🟢 Bullish Scenario
If the price breaks out above 14550, then a weak bullish target would be 14600. There will be strong resistance at 14600. Next, if the price sustains above 14600, then strong bullish moves might be observed. The probable bullish targets above 14600 would be - 14650, 14700, 14750, and 14800.
🔴 Bearish Scenario
Level 14450 is support. If the price breaks down below 14450, then a weak bearish target would be 14400. There will be strong support at 14400. Next, if the price breaks down below 14400, then the probable strong bearish targets would be - 14350, 14300, 14250, and 14200.
🟡 No Trading Zone (NTZ): (14550 - 14450).
⏺ Range of Consolidation (ROC): (14600 - 14400).
Here, 14500 is the median of the ROC. The median works like a trading session sentiment evaluator. The price trading above the median would offer bullish sentiment, while the price trading below the median would trigger bearish sentiment within the ROC.
● Event
There's no high-impact event this week. There's no holiday this week. However, geopolitical issues are omnipresent and beyond our control.
● Intraday, Weekly, and Monthly Bias
Establish bias with respect to the opening price (of the particular session - Intraday, Weekly, and Monthly). If the price sustains above the opening price, then don't think of shorting. Look for bullish trades only. On the contrary, if the price sustains below the opening price, then don't think of going long. Look for bearish trades in that case.
● Disclaimer + End Note
- All the analyses would fail in the case of a major gap up, gap down, or price structure anomaly. Thus, practice PRAGMATISM in the live session.
- Trade only if there is a set-up. Remember, not trading is an extension of the trading activity.
- Mark your points. Trade your points. Price is GOD. Anything can happen in the markets. Thus, trade what you see, not what you believe.
- Always PRACTICE RISK MANAGEMENT. Always PROTECT YOUR CAPITAL. Be RESPONSIBLE.
- Be Strategic. Be Courageous. Be Patient. Be Wise.
- Every day is a new day. Thus, do not carry the baggage of past successes or failures. Leave the gardens of winning and losing. Establish yourself in equanimity. Always think from a new perspective.
- Let the joy of trading drive your effectiveness, not greed or fear. Believe in Possibilities.
Happy Trading! NIFTY : Narrow Range | Trading Plan | 21-Sep-2026NIFTY 50 INTRADAY TRADING PLAN — 21 SEP 2026
Prev. Close: 23,341.75 | Timeframe: 15 Min
━━━━━━━━━━━━━━━━━━
KEY LEVELS
🔴 Last Intraday Resistance: 23,574–23,633
🟠 Opening Resistance: 23,436
🟡 Opening Support: 23,319
🟢 Last Intraday Support: 23,173
🔵 Consolidation Zone: 23,042–23,081
Decision Zone: 23,319–23,436
━━━━━━━━━━━━━━━━━━
📈 GAP UP — 100+ POINTS
If NIFTY opens around/above 23,442 :
➡️ Don't chase the opening candle.
➡️ Sustained acceptance above 23,436 can open the path toward 23,574–23,633 .
➡️ If price rejects 23,436 and falls back below it, avoid aggressive longs and wait for fresh confirmation.
Key idea: Gap Up ≠ automatic buy. Wait for acceptance.
━━━━━━━━━━━━━━━━━━
➡️ FLAT OPENING
If NIFTY opens around 23,319–23,436 :
🟢 Above 23,436 + 15-min confirmation → upside focus 23,574–23,633.
🔴 Below 23,319 + confirmation → downside focus 23,173.
⚠️ Inside 23,319–23,436 → avoid overtrading; wait for a clear breakout/breakdown.
━━━━━━━━━━━━━━━━━━
📉 GAP DOWN — 100+ POINTS
A 100-point gap-down reference is around 23,242 .
➡️ Don't chase the first red candle.
➡️ Sustained breakdown below 23,173 can bring 23,042–23,081 into focus.
➡️ If price quickly reclaims 23,173 and then 23,319, watch for a recovery setup instead of blindly holding shorts.
Key idea: Gap Down ≠ automatic sell.
━━━━━━━━━━━━━━━━━━
⏱️ FIRST 15–30 MINUTES
Let the opening volatility settle.
Wait → Confirm → Execute → Manage Risk
A level should ideally be supported by candle closing, retest and price-action confirmation rather than a simple touch.
━━━━━━━━━━━━━━━━━━
⚠️ OPTIONS RISK MANAGEMENT
• Define SL before entry.
• Keep position size small and controlled.
• Don't chase expanded option premiums.
• Respect the NIFTY spot level, not just option premium movement.
• Avoid revenge trading after a loss.
• Set a maximum daily loss limit.
• Remember: option buyers face time decay and volatility risk.
━━━━━━━━━━━━━━━━━━
SUMMARY
Above 23,436 → Watch for 23,574–23,633.
23,319–23,436 → Decision/No-Trade Zone; wait for confirmation.
Below 23,319 → Watch 23,173 → 23,042–23,081.
The gap tells us where the market opens; price action tells us what to do next.
━━━━━━━━━━━━━━━━━━
DISCLAIMER
This trading plan is for educational and informational purposes only.
I am not a SEBI Registered Analyst.
This is not investment advice or a recommendation to buy or sell any security or derivative. F&O and options trading involve substantial risk and can result in significant losses. Please conduct your own research and consult a SEBI-registered professional before making financial decisions.  Long
Long
 Long
Long
 Long
Long
Iol Chemicals & Pharmaceuticals Ltd - Breakout Setup, Move is ON#IOLCP trading above Resistance of 203
Next Resistance is at 265
Support is at 165
Here is previous chart:
This weekly chart for IOL Chemicals & Pharmaceuticals Limited displays a strong bullish breakout from a consolidation pattern, supported by significant volume and long-term trendline context.
Chart Overview
Timeframe & Asset: IOL Chemicals & Pharmaceuticals Ltd. (1-Week Chart, NSE).
Current Price: 203.15 INR (+4.55% change shown on the chart header).
Key Technical Observations
Horizontal & Channel Breakout: The stock consolidated within a downward-sloping mini-channel (white lines) and horizontal consolidation zone before breaking out above 104.00 INR, marked by the yellow Breakout arrow.
Volume Expansion: The blue arrow highlights a substantial surge in trading volume during the initial breakout phase, confirming strong institutional buying conviction.
Support Levels:
104.00 INR (Yellow Line): The horizontal level corresponding to the initial breakout point and dynamic base support.
165.00 INR (Red Line): A major horizontal level (marked with a red arrow) that previously acted as resistance before flipping to become the primary structural support level on subsequent pullbacks.
Resistance Levels:
Resistance 1 (203.00 INR): A structural resistance level (green line) that the current price candle has tested and breached to trade at 203.15 INR.
Resistance 2 (265.00 INR): The long-term upside projection level marked near the top green line.
Long-Term Trend Lines: The solid blue lines form a multi-year ascending channel that defines the macro uptrend, with the price currently advancing along the upper expansion zone above this channel.
Conclusion & Current Price Action
The current price action reflects strong bullish momentum following the volume-backed breakout above 104.00 INR and a successful retest of the 165.00 INR support zone. The stock has recently cleared its immediate hurdle at Resistance 1 (203.00 INR).
A sustained weekly close above this Resistance 1 zone indicates room for extended upside toward the long-term upside projection level of 265.00 INR (Resistance 2). On any potential pullbacks, the 165.00 INR level will serve as the primary line of defense for buyers to keep the structural uptrend intact.
A parallel channel (also known as an ascending, descending, or horizontal channel) is a technical analysis pattern bounded by two parallel trendlines that encompass a security’s price action over time.
Structure & Mechanics
Main Components:
Trendline / Base Line: Connects a series of prominent reaction lows (in an uptrend) or reaction highs (in a downtrend).
Channel Line: Drawn parallel to the trendline, connecting the peaks (top boundary) or troughs (bottom boundary).
Price Movement: Price oscillates between the upper boundary (which acts as dynamic resistance) and the lower boundary (which acts as dynamic support).
Types of Channels
Ascending Channel (Bullish): Characterized by higher highs and higher lows. Indicates a steady uptrend where buying pressure dominates.
Descending Channel (Bearish): Characterized by lower highs and lower lows. Represents a controlled downtrend or corrective pullback.
Horizontal Channel (Consolidation): Moving sideways between static support and resistance lines, signaling market indecision or range-bound trading.
How Traders Use Parallel Channels
Trading Within the Range: Buying near the channel's lower boundary (support) and selling or shorting near the upper boundary (resistance).
Breakout Trading: A strong, high-volume candle breaking outside either boundary signals potential trend acceleration or continuation in the direction of the breakout (as seen in the charts provided previously).
Midline (50% Line): Often, a dashed line is drawn down the middle of the channel. Price reacting to this midline can confirm the channel's validity and act as interim support or resistance.
Disclaimer: This is for demonstration and educational purpose only. This is not buying or selling recommendations. I am not SEBI registered financial advisor. Please consult your financial advisor before taking any trade.  Long
Long
Silver Weekly Analysis [21 Sep - 25 Sep, 2026]Probable Scenario Analysis of Silver TVC:SILVER for the week (21 Sep - 25 Sep, 2026).
⏺ Present Scenario:
Silver (XAGUSD) TVC:SILVER is undergoing a contraction phase. The range (67.5 - 62.5) has been the contraction region. A breakout or breakdown from the range would ensure a strong trend. Broadly, the view is indecisive to bearish unless a true bullish trend is established . A strong bullish move is only possible above 70. A strong bearish move is only possible below 60.
🟢 Bullish Scenario
If the price sustains above 67.5, then a weak bullish target would be 70. There will be strong resistance at 70. Next, if the price breaks out above 70, then strong bullish moves might be observed. The probable strong bullish targets above 70 would be - 72.5, 75, 77.5, and 80.
🔴 Bearish Scenario
Presently, an indecisive to bearish setup is active. Stay bearish below 65. A strong support zone (SSZ) is established in the region (65 - 62.5). A decisive breakdown below 62.5 would trigger a bearish trend. The first bearish target below 62.5 would be 60. There will be strong support at 60. Next, if the price breaks down below 60, then strong bearish moves might be observed. The probable strong bearish targets below 60 would be - 57.5 and 55.
🟡 No Trading Zone: (67.5 - 62.5).
⏺ Range of Consolidation (ROC): (70 - 60).
Here, 65 is the median of the ROC. The median works like a trading session sentiment evaluator. The price trading above the median would offer bullish sentiment, while the price trading below the median would trigger bearish sentiment within the ROC.
● Events (🔵 Low Impact, 🟠 Medium Impact, 🔴 High Impact):
- 21 Sep (Mon): FOMC Member Goolsbee Speaks (04:00 PM IST, 🔵 Low Impact).
- 22 Sep (Tue): ADP Weekly Employment Change (05:45 PM IST, 🔵 Low Impact). FOMC Member Williams Speaks (07:35 PM IST, 🔵 Low Impact).
- 23 Sep (Wed): Flash Manufacturing PMI (07:15 PM IST, 🔵 Low Impact). Crude Oil Inventories (08:00 PM IST, 🔵 Low Impact).
- 24 Sep (Thu): FOMC Member Williams Speaks (01:40 PM IST, 🔵 Low Impact). Unemployment Claims (06:00 PM IST, 🟠 Medium Impact). FOMC Member Paulson Speaks (07:40 PM, 🔵 Low Impact). Natural Gas Storage (08:00 PM, 🔵 Low Impact).
- 25 Sep (Fri): Durable Goods Orders m/m (06:00 PM, 🔵 Low Impact). Revised UoM Consumer Sentiment (07:30 PM IST, 🟠 Medium Impact). FOMC Member Hammack Speaks (11:30 PM, 🔵 Low Impact).
● Intraday, Weekly, and Monthly Bias
Establish bias with respect to the opening price (of the particular session - Intraday, Weekly, and Monthly). If the price sustains above the opening price, then don't think of shorting. Look for bullish trades only. On the contrary, if the price sustains below the opening price, then don't think of going long. Look for bearish trades in that case.
● Disclaimer + End Note
- All the analyses would fail in the case of a major gap up, gap down, or price structure anomaly. Thus, practice PRAGMATISM in the live session.
- Trade only if there is a set-up. Remember, not trading is an extension of the trading activity.
- Mark your points. Trade your points. Price is GOD. Anything can happen in the markets. Thus, trade what you see, not what you believe.
- Always PRACTICE RISK MANAGEMENT. Always PROTECT YOUR CAPITAL. Be RESPONSIBLE.
- Be Strategic. Be Courageous. Be Patient. Be Wise.
- Every day is a new day. Thus, do not carry the baggage of past successes or failures. Leave the gardens of winning and losing. Establish yourself in equanimity. Always think from a new perspective.
- Let the joy of trading drive your effectiveness, not greed or fear. Believe in Possibilities.
Happy Trading! Meesho Limited (MEESHO) Probable Swing Opportunity (Go Long)Probable Scenario Analysis for Meesho Limited NSE:MEESHO for Swing Opportunity (Go Long).
🟢 Bullish Scenario
The price has emerged out of the "Adam-&-Eve Double Bottom Pattern." If the price stays above 210, then stay long. The price is near its previous high. There is a weak resistance zone (WRZ) in the region (230 - 225). If the price decisively trades above 230, then the probable bullish targets would be - 240 and 250. There will be strong resistance at 250 as there is the all-time high (ATH) near the same level. Next, if the price breaks out above 250, then the probable bullish targets would be - 260, 270, 280, 290, and 300.
🔴 Bearish Scenario
The zone (210 - 190) is a strong support (or demand) zone (SSZ). If the price breaks down and sustains below 190, then exit your position.
🟡 No Trading Zone (NTZ): Undefined. Not applicable for cash swing positions.
⏺ Range of Consolidation (ROC): (250 - 200).
Here, 225 is the median of the ROC. The median works like a trading session sentiment evaluator. The price trading above the median would offer bullish sentiment, while the price trading below the median would trigger bearish sentiment within the ROC.
● Intraday, Weekly, and Monthly Bias
Establish bias with respect to the opening price (of the particular session - Intraday, Weekly, and Monthly). If the price sustains above the opening price, then don't think of shorting. Look for bullish trades only. On the contrary, if the price sustains below the opening price, then don't think of going long. Look for bearish trades in that case.
● Disclaimer + End Note
- All the analyses would fail in the case of a major gap up, gap down, or price structure anomaly. Thus, practice PRAGMATISM in the live session.
- Trade only if there is a set-up. Remember, not trading is an extension of the trading activity.
- Mark your points. Trade your points. Price is GOD. Anything can happen in the markets. Thus, trade what you see, not what you believe.
- Always PRACTICE RISK MANAGEMENT. Always PROTECT YOUR CAPITAL. Be RESPONSIBLE.
- The post is purely based on technical and chart analysis. The author has not studied the fundamentals. Thus, any fundamental or macroeconomic event can disrupt chart analysis.
- The author has no intention to promote buy or sell recommendations.
- The post is only for educational purposes.
- The intent of the post surrounds trading levels only and not investment ideas.
- Novice traders should stick to the cash segment for swing trading instead of F&O. This post has no intention to promote F&O trading.
- Please be mindful during trading and investment decisions. Be Responsible.
- Be Strategic. Be Courageous. Be Patient. Be Wise.
- Every day is a new day. Thus, do not carry the baggage of past successes or failures. Leave the gardens of winning and losing. Establish yourself in equanimity. Always think from a new perspective.
- Let the joy of trading drive your effectiveness, not greed or fear. Believe in Possibilities.
Happy Trading!  Long
Long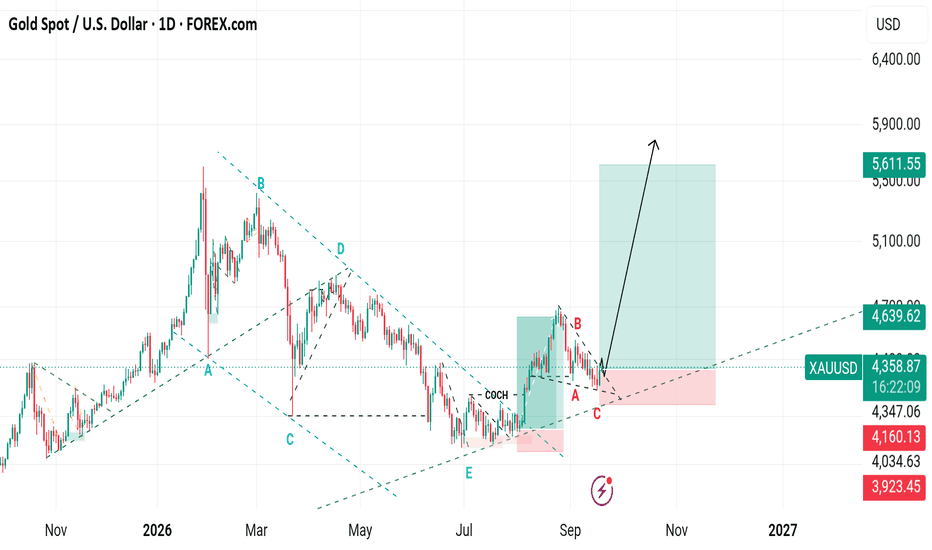
NIFTY WEEKLY OUTLOOK 21–25 September 2026### NIFTY WEEKLY OUTLOOK
**21–25 September 2026**
NIFTY broke below the important support level of **23,230** last week and declined to a low of **23,118**, before recovering nearly **230 points** from the low.
The index has closed in the green for the **last three trading sessions**, indicating some buying interest at lower levels. However, the recent candlestick formations continue to indicate **indecision**, with no clear directional confirmation yet.
NIFTY has now declined for **seven consecutive weeks**. After such a prolonged decline, a **pullback rally cannot be ruled out**, particularly if there is some stabilisation or a pause in geopolitical developments. However, the sustainability of any recovery will need to be confirmed by price action.
From a pivot perspective, NIFTY is still trading **below the monthly pivot level** and closed the week close to the **next week's pivot level of 23,351**. This makes the **23,351–23,600** zone important to watch for any attempt at a meaningful recovery.
For the coming week, **23,600 on the upside and 23,070 on the downside** remain the key levels. A decisive breakout or breakdown from this range could provide better clarity regarding the next directional move.
### BUY LEVELS
**Buy above 23,593**
**Targets:**
23,720 → 23,850 → 23,920
### SELL LEVELS
**Sell below 23,115**
**Targets:**
23,075 → 23,010 → 22,890
### KEY LEVELS TO WATCH
* **23,600:** A decisive move above this level could strengthen the possibility of a pullback.
* **23,351:** Next week's pivot level and an important intermediate level to watch.
* **23,070:** A break below this level could indicate renewed downside pressure.
* **23,070–23,600:** A sustained move within this range may result in continued consolidation and indecisive price action.
After seven consecutive weekly declines, the possibility of a **technical pullback** remains. However, traders should watch price action carefully, particularly around the pivot and breakout/breakdown levels, before taking directional positions.
### RISK DISCLAIMER
The above analysis is based on technical indicators, price action and market structure and is provided **solely for educational and informational purposes**. It should not be construed as investment advice, a recommendation, or a solicitation to buy or sell NIFTY, futures, options or any other financial instrument.
**I am not registered with SEBI as an Investment Adviser or Research Analyst.** This analysis represents my personal market observations and should not be considered personalised investment advice.
Trading in derivatives involves substantial risk and can result in significant losses, including losses exceeding the initial capital. Past price behaviour does not guarantee future results. Readers and traders should conduct their own research, assess their risk tolerance, use appropriate position sizing and stop-losses, and consult a **SEBI-registered investment adviser or research analyst** before making investment decisions.
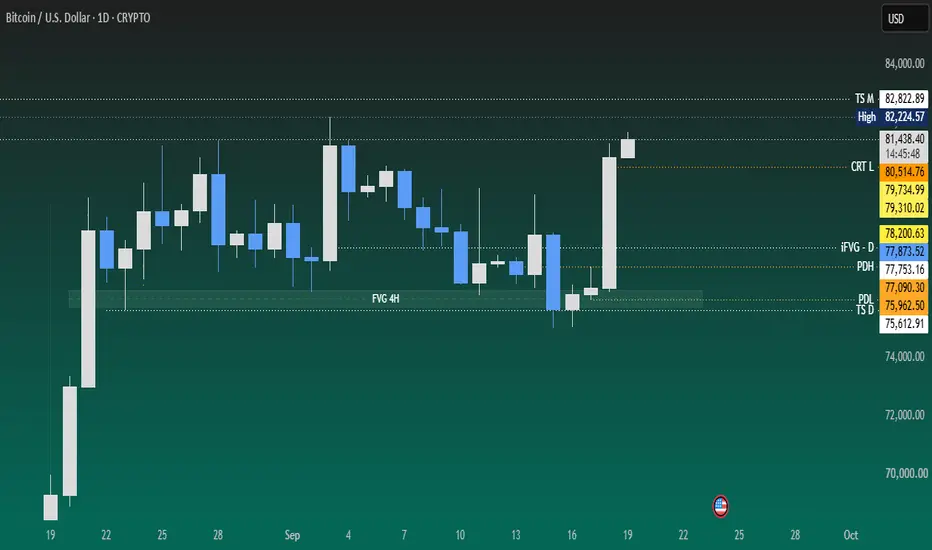
Weekly Analysi - BTCHi Friends, here is detailed weekly analysis.
Monthly
The previous month closed positive and relatively strong, with price sustaining above the monthly iFVG. The current monthly candle is also displaying strength following a downside rejection, indicating continued bullish participation. Price appears to be progressing toward the 82,822 level, which remains an important reference point.
Weekly
On the weekly timeframe, price is showing renewed strength following the previous week’s downside move. The current price structure suggests a potential move toward the recent weekly swing high, provided bullish momentum continues to sustain.
Daily
The daily structure presents a more nuanced picture. Price showed strength on Monday; however, Tuesday witnessed a sharp sell-off that swept liquidity below the recent low around the 4H FVG. Following the liquidity sweep, price entered a consolidation phase through Wednesday and Thursday.
On Friday, price expanded sharply higher, coinciding with a major news event, resulting in significant volatility and displacement.
Price is currently approaching/at a supply zone, where two scenarios become relevant: range-bound consolidation or a liquidity-driven move. A sustained breakout above the recent highs with convincing price acceptance would provide stronger confirmation of bullish continuation. Alternatively, price may first hunt nearby liquidity before establishing the next directional move.
Please do follow me if you liked the idea💡...
Disclaimer ⚠️: This analysis is for educational purposes only and does not constitute investment advice. Please do your own research (DYOR) and check with your financial advisor before making any trading decisions. 📚💰  Short
Short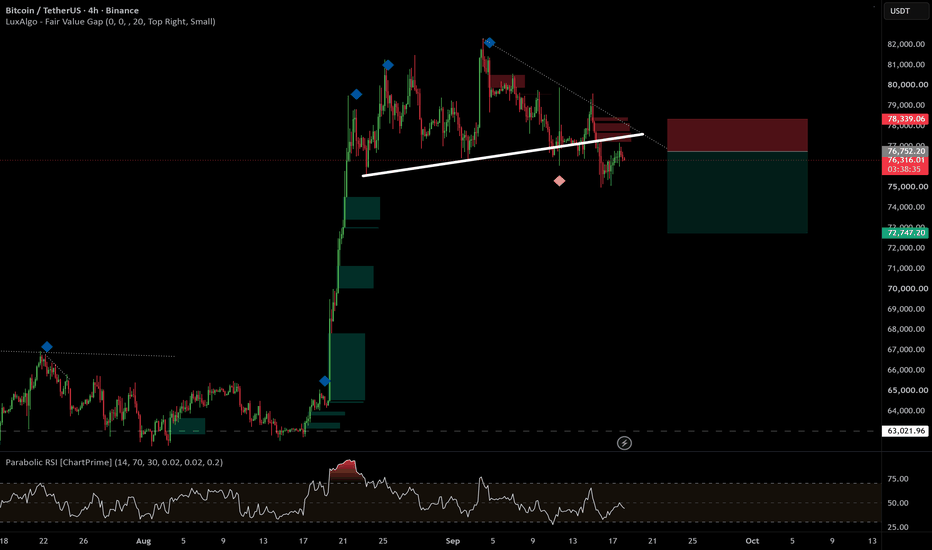
Gold (XAUUSD) Weekly Analysis [21 Sep - 25 Sep, 2026]Probable Scenario Analysis of Gold (XAUUSD) OANDA:XAUUSD for the week (21 Sep - 25 Sep, 2026).
⏺ Present Scenario:
Gold (XAUUSD) is undergoing a contraction phase. The range (4400 - 4350) has been the super contraction region. A breakout or breakdown from the range would indicate a weak trend. The broader consolidation zone is (4450 - 4300). Based on the multiple timeframe analysis, the view is indecision.
🟢 Bullish Scenario
If the price sustains above 4400, then weak bullish targets would be - 4425 and 4450. There is a strong resistance zone (SRZ) in the region (4450 - 4425). Also, the monthly (September) opening price of 4448.1 will be a major resistance. Next, if the price breaks out above 4450, then mild bullish moves might be observed. The probable mild bullish targets above 4450 would be - 4475 and 4500. Level 4500 would be a super strong resistance. Lastly, if the price decisively breaks out above 4500, then strong bullish targets would be - 4525 and 4550.
🔴 Bearish Scenario
Presently, an indecisive setup is active. Stay bearish below 4350. The probable bearish targets below 4350 would be - 4325 and 4300. A strong support zone (SSZ) is established in the region (4325 - 4300). A decisive breakdown below 4300 would trigger a bearish trend. The bearish targets below 4300 would be - 4275 and 4250. There will be strong support at 4250. Next, if the price breaks down below 4250, then strong bearish moves might be observed. The probable strong bearish targets below 4250 would be - 4225, 4200, and 4175.
🟡 No Trading Zone: (4400 - 4350).
⏺ Minor Range of Consolidation (Mi-ROC): (4450 - 4300).
Here, 4375 is the median of the ROC. The median works like a trading session sentiment evaluator. The price trading above the median would offer bullish sentiment, while the price trading below the median would trigger bearish sentiment within the ROC.
⏺ Major Range of Consolidation (Ma-ROC): (4500 - 4250).
Here, 4375 is the median of the ROC. The median works like a trading session sentiment evaluator. The price trading above the median would offer bullish sentiment, while the price trading below the median would trigger bearish sentiment within the ROC.
⏺ Multiple Timeframe Analysis or Top-Down Analysis
- Quarterly or 3-Month TF:
A green gravestone doji is formed. The session is bullish, but there is selling pressure. The candle is formed after a major red marubozu candle. Considering the last three candles, there is selling pressure. Technically, there is no trend. The present session’s candle has three major resistances – 4400, 4450, and 4500. On the contrary, levels 4300 and 4250 are major support levels. Trend-based trading will be difficult. The view is indecision.
- Monthly TF:
Previous month’s candle is a green bullish candle with major selling pressure (the upper wick is too long. The present session’s candle is a red hanging man so far. Level 4500 is a major resistance level. Playing confident bullish will be risky. Also, there is sharp bullish support at the level of 4250. Thus, the session is indecisive. Levels 4400, 4450, and 4500 would be strong resistance until there is a sharp bullish breakout. This means that for a sustainable bullish breakout, the price must trade above the monthly open (also, above 4500). Until then, be cautious about taking confident bullish trades. On the contrary, there is also support from multiple levels, viz. 4300 and 4350. Taking confident bearish trades will also be risky. A decisive breakdown below 4300 might push down the price. Technically, there is no trend. The view is indecision.
- Weekly TF:
After three weeks of a bearish trend, last week, the price showed a pause. Last week’s candle is a green bullish hammer. We cannot yet confirm a bullish trend as there is no higher-highs and lower-lows structure yet. However, the kind of lower wick shows the strength of the bulls. Maybe it is a sign of a pause as well as a trend reversal (bearish to bullish trend reversal, but not yet confirmed). A sustainable breakout above 4450 will boost bullish sentiment. A sustainable breakdown below 4300 will attract strong bears. The range (4450 – 4300) is the range of consolidation (ROC). Presently, there is no trend. The view is bearish to indecision.
- Daily TF:
Considering the price action from August to September, there is an observable formation of a head and shoulders (H&S) pattern. It is a sign of consolidation (accumulation or distribution not confirmed). There are two identified ranges of consolidation. The major range of consolidation (Ma-ROC) is (4500 – 4250). Here, the median of Ma-ROC is 4375. The minor range of consolidation (Mi-ROC) is (4450 – 4300). Here, the median of Mi-ROC is 4375. Thus, the median of both the ROCs is the same. It means the price is in a super compression phase. The consolidation has exhausted the availability of a trend (either bullish or bearish). The view is indecision.
- 1-Hour or 60-minute TF:
Again, the head-and-shoulders (H&S) pattern is clearly visible. There is no trend. Gold is in a consolidation zone. The range (4400 – 4350) is a high compression zone. Here, trend-based trading should be avoided as it is a no-trading zone (NTZ). The range (4450 – 4300) is also a painful consolidation zone. A sustainable breakout or breakdown from these zones might offer trend clarity. The view is indecision.
● Events (🔵 Low Impact, 🟠 Medium Impact, 🔴 High Impact):
- 21 Sep (Mon): FOMC Member Goolsbee Speaks (04:00 PM IST, 🔵 Low Impact).
- 22 Sep (Tue): ADP Weekly Employment Change (05:45 PM IST, 🔵 Low Impact). FOMC Member Williams Speaks (07:35 PM IST, 🔵 Low Impact).
- 23 Sep (Wed): Flash Manufacturing PMI (07:15 PM IST, 🔵 Low Impact). Crude Oil Inventories (08:00 PM IST, 🔵 Low Impact).
- 24 Sep (Thu): FOMC Member Williams Speaks (01:40 PM IST, 🔵 Low Impact). Unemployment Claims (06:00 PM IST, 🟠 Medium Impact). FOMC Member Paulson Speaks (07:40 PM, 🔵 Low Impact). Natural Gas Storage (08:00 PM, 🔵 Low Impact).
- 25 Sep (Fri): Durable Goods Orders m/m (06:00 PM, 🔵 Low Impact). Revised UoM Consumer Sentiment (07:30 PM IST, 🟠 Medium Impact). FOMC Member Hammack Speaks (11:30 PM, 🔵 Low Impact).
● Intraday, Weekly, and Monthly Bias
Establish bias with respect to the opening price (of the particular session - Intraday, Weekly, and Monthly). If the price sustains above the opening price, then don't think of shorting. Look for bullish trades only. On the contrary, if the price sustains below the opening price, then don't think of going long. Look for bearish trades in that case.
● Disclaimer + End Note
- All the analyses would fail in the case of a major gap up, gap down, or price structure anomaly. Thus, practice PRAGMATISM in the live session.
- Trade only if there is a set-up. Remember, not trading is an extension of the trading activity.
- Mark your points. Trade your points. Price is GOD. Anything can happen in the markets. Thus, trade what you see, not what you believe.
- Always PRACTICE RISK MANAGEMENT. Always PROTECT YOUR CAPITAL. Be RESPONSIBLE.
- Be Strategic. Be Courageous. Be Patient. Be Wise.
- Every day is a new day. Thus, do not carry the baggage of past successes or failures. Leave the gardens of winning and losing. Establish yourself in equanimity. Always think from a new perspective.
- Let the joy of trading drive your effectiveness, not greed or fear. Believe in Possibilities.
Happy Trading! Education

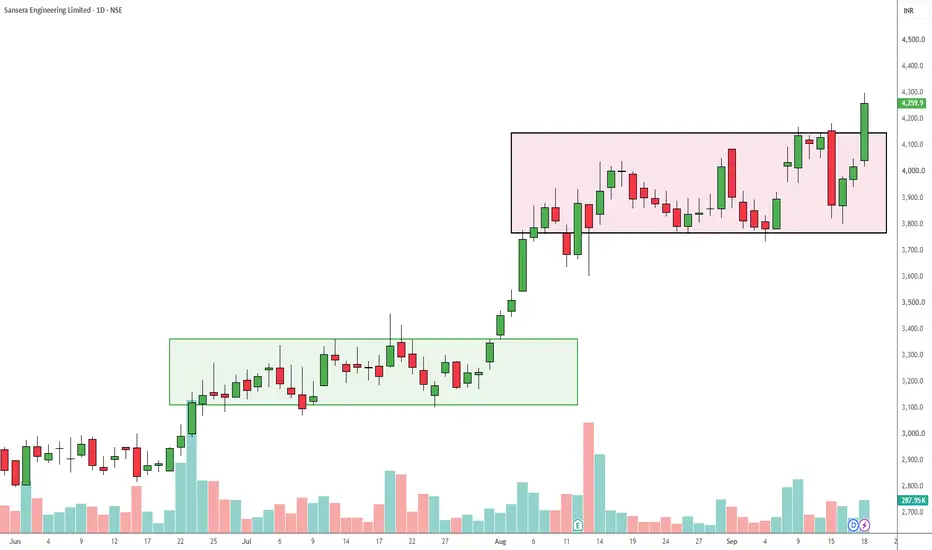
SANSERA : Powerful Breakout Signalling Trend Continuation.Based on the daily timeframe for Sansera Engineering Limited, the stock has just confirmed a strong breakout from a prolonged consolidation phase.
As seen in the provided chart, the stock previously exhibited a similar price action behavior:
It consolidated within a designated range (green box) before triggering a massive rally.
Recently, the price has been digesting those gains by trading sideways within a new, higher consolidation zone (pink box) with support near the 3,750 level and strong resistance around 4,150.
The most recent daily candle shows a highly bullish expansion, slicing through the upper boundary of the pink box and closing strongly around 4,259.9.
This volume-backed momentum suggests the accumulation phase is complete and the primary uptrend is resuming.
Here is the trade setup based on this technical breakout:
Entry Point: Current Market Price (~4,260) is valid for momentum traders, though a conservative approach would be to ladder entries or wait for a minor retest of the breakout level at 4,150.
Target: Using the measured move of the consolidation box (roughly 400 points from 3,750 to 4,150), projecting this upward from the breakout point gives a primary technical target of 4,550.
Stop Loss: A strict stop loss should be placed below the breakout candle's origin or the recent swing low inside the box, around 3,900.
For a wider, structural stop loss to give the trade more breathing room, place it below the consolidation box support at 3,700. JSW INFRASTRUCTURE LTD – WEEKLY CHART - Breakout doneLONG-TERM BULLISH SETUP
JSW Infrastructure has formed a Double Bottom pattern, followed by a breakout and successful retest of the neckline. Price is now holding above the breakout zone, setting up a potential long-term move higher.
🎯 TRADE LEVELS:
🟢 Entry: Above ₹350
🛑 Stop Loss: ₹318
🎯 Target 1: ₹370
🎯 Target 2: ₹400
🎯 Target 3: ₹425
🔥 Double Bottom breakout + retest completed — long-term setup is ready.
📌 For long-term view, consider holding with disciplined risk management and trail the stop-loss as the trend develops.
💬 Like • Comment • Follow for more setups!
DISCLAIMER :
This content is created by Logic Trade Room for educational and informational purposes only.
It is not financial advice, investment advice, trading advice, or a recommendation to buy or sell any security, index, futures contract, or options contract.
Trading and investing in the stock market involve substantial risk, including the risk of losing your entire invested capital. Past performance does not guarantee future results.
The entry, stop-loss, and target levels mentioned are illustrative chart-based levels and may change with market conditions. No trade setup or market prediction is guaranteed to be accurate.
Always conduct your own research, verify live market prices, and consult a qualified financial advisor before making investment decisions.
Trade with logic. Risk with discipline.
Logic Trade Room  Long
Long
ACE : Strong Bullish Breakout Above Resistance.Directional Bias: Long
Technical Analysis & Reasoning:
The daily chart for Action Construction Equipment Limited presents a compelling long setup based on a clear technical breakout.
Horizontal Resistance Breakout: Price action has decisively broken above the key overhead resistance line at 1,191.1 INR. This level previously acted as a ceiling for the price, and breaking it indicates a strong shift in market momentum.
Bullish Price Action: The stock is maintaining a steady uptrend characterized by consistent higher highs and higher lows since June. The current daily candle is strongly bullish, trading around 1,229.2 INR (+1.96%), showing strong conviction from buyers following the breakout.
Volume Support: The recent upward price action and breakout are accompanied by visible volume clusters at the bottom of the chart, validating the move and suggesting broad market participation.
Trade Idea & Levels:
Entry: Scaling in near the current price of 1,229 INR, or waiting for a potential minor pullback to retest the 1,191.1 INR level (previous resistance turning into new support).
Stop-Loss: A daily close below the recent consolidation zone (around the 1,140–1,150 INR level) to protect capital against a false breakout scenario.
Target: As the stock is clearing major resistance, traders can utilize trailing stops to ride the upward momentum or target psychological round numbers (like 1,300 INR) depending on individual risk-reward preferences. MACPOWER : Weekly Consolidation Breakout Signalling ContinuationOn the weekly timeframe, Macpower CNC Machines Limited is exhibiting strong bullish price action.
The stock previously broke out above a major long-term resistance level at 1,736.6 (marked by the green horizontal line).
Instead of reversing, the price consolidated beautifully above this newly formed support, creating a tight rectangular continuation pattern (highlighted by the pink box) between the 1,800 and 2,050 zones.
This week's price action shows a definitive breakout from this consolidation phase, characterized by a strong bullish marubozu-style candle closing near its highs at 2,104.5 with a 14.19% gain.
The combination of a prior structural breakout, healthy consolidation, and a subsequent momentum breakout suggests that the stock is ready for its next upward leg in price discovery. The volume profile also supports the upward momentum.
Trade Setup:
Entry Point: Current Market Price around 2,104, or on a slight pullback/retest of the consolidation box top near 2,050.
Target:
TP1: 2,350 (Based on the measured move of the 250-point consolidation box projected upwards).
TP2: 2,500 (Psychological round number in uncharted territory).
Stop Loss: 1,790 (A weekly close below the pink consolidation box and the psychological 1,800 mark invalidates the immediate bullish continuation setup).  Long
Long