JKCEMENT at Demand Zone – Is Wave 5 About to Start?⚡ JK CEMENT – Wave 4 Correction Completing | Wave 5 Blast Loading?
🧠 Overall Market Structure
JK Cement is showing a textbook Elliott Wave progression, and price has now entered the crucial Wave 4 → Wave C completion zone (₹5276–₹5396).
This zone aligns with 38.2% to 61.8% retracement of Wave 3, making it a high-probability reversal area 📌.
The chart shows:
Strong Impulse Wave 3 with clean channel movement
Clear ChoCH (Change of Character) at the top → signaling the start of Wave 4
A co
Community ideas
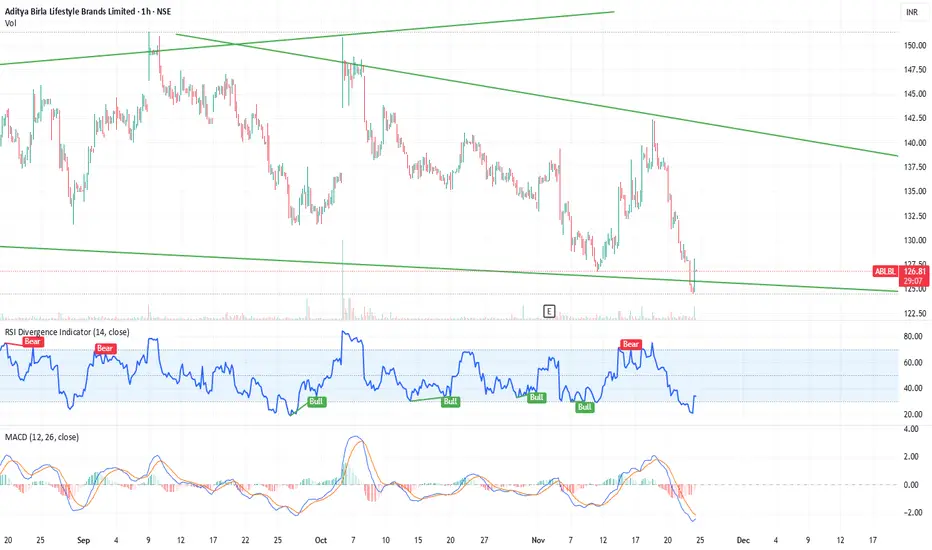
Falling Wedge Pattern (Bullish Setup) | Re-Opportunityit did give an opportunity last week, then fell, and is again at an opportunity zone now.
RSI Analysis
Your RSI shows:
RSI near 37–38
This is close to oversold, which is usually where reversals happen
Earlier, RSI bounced from similar levels
➡️ Supports a bounce possibility.
MACD Analysis
MACD is:
Below zero
Weak
But histogram shows reducing red bars (selling pressure slowing down)
➡️ MACD is not bullish yet, but weakening selling often comes before reversal.
It is again touching that same s
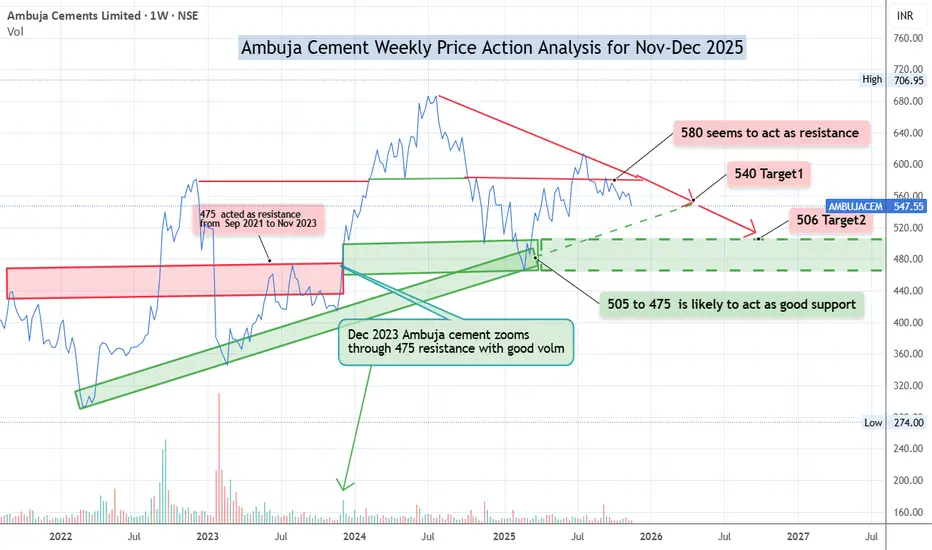
Ambuja Cement Weekly Price Action Analysis for Nov-Dec 2025On Weekly chart Ambuja Cement has closed at 547 on 20-Nov-25
Recent price action indicates the stock is struggling to go past 575-580 area.
It is likely to continue going down till its support major region of 505-475.
One can sell/short sell whenever the stock comes near 570 region. Keeping SL of 590.
Target 1 can be kept at 540
Target 2 at 506
UNOMINDA: Post-Breakout Retest - Setting Up For Wave 2
Price shows a text-book breakout and retest of a multi-month consolidation high, signaling a potential acceleration phase in the Auto Components space.
🔍 Technical Snapshot (3-Day Chart)
Metric: Breakout Zone
Value: ₹1,180–₹1,250
Interpretation: Critical horizontal resistance flipped to support (yellow box); retest is currently in play.
Metric: TP1 (Major Target)
Value: ₹1,500
Interpretation: Initial measured move and psychological resistance.
Metric: TP2 (Moon Zone)
Value: ₹1,70
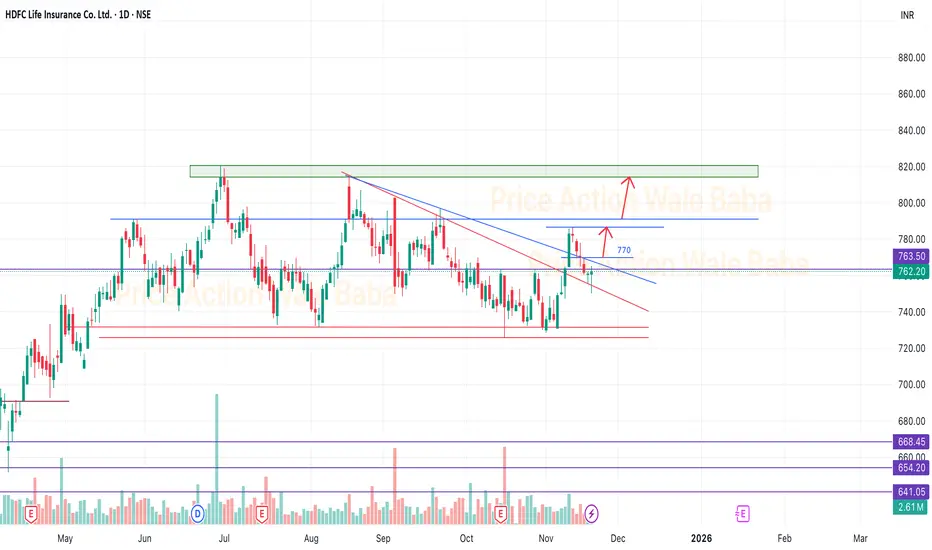
HDFCLifeHDFCLife has a very long consolidation and going up and down in the range.
Previous wave has a downfall and not it is started with uptrend. So some uptrend it has small correction and ready to move up side.
So, above 770 we can see upside movement till the 800-820.
So, as per technical it's good to accumulate for the long time and wait for the target.
Above 850 we can see a big rally and better return for the next few years.
Consolidation face ends? Anuras has been in some decent consolidation for last 6 months and has seen strong volumes in last 2-3 session. Post results season buying is intriguing since not much happened post call. Watch out for some action. Please note RSI is 76 so take position according to your appetite.
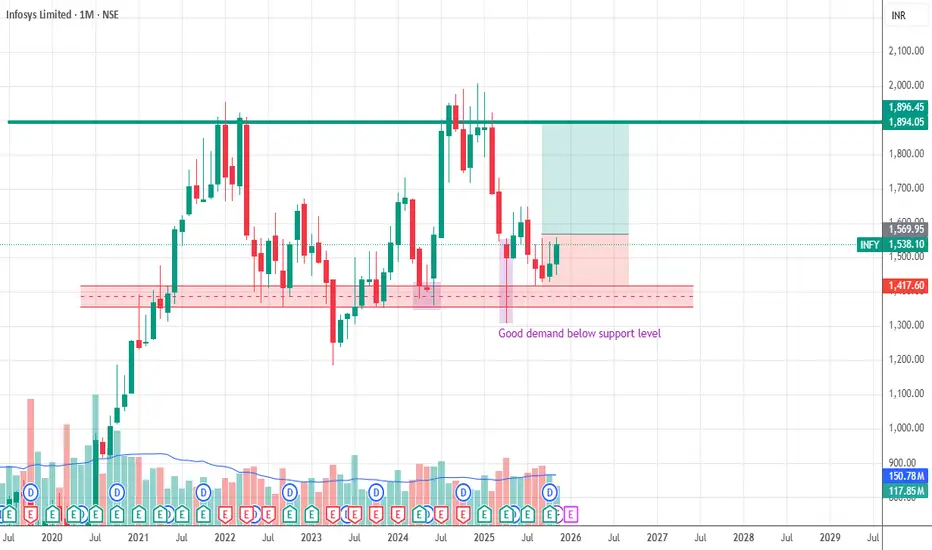
INFOSYS MY TECHNICAL VIEWS 19-11-25After retest of support, multiple times, price ready to go up.
Nifty It and Infosys charts are almost identical..
Nifty is already in trend. VIX Normal. dollar index below 100. Good delivery. Everything look perfect. Anything missing?
Your views and suggestion are invited.
Bitcoin Turn Bearish In Monthly Time frameWhat’s going on
Bitcoin slipped significantly this week, dropping into the US$90,000–96,000 range, marking roughly a 10% decline for the week.
The decline has pushed BTC to trade around 20-25% below its all-time high of US$126,200.
On-chain data shows that long-term holders (those who typically hold and not sell) have sold ~815,000 BTC in the past 30 days—the highest such volume since Jan 2024. That suggests weakening conviction among “Holders”.
What’s working against Bitcoin
Recently, Bitc
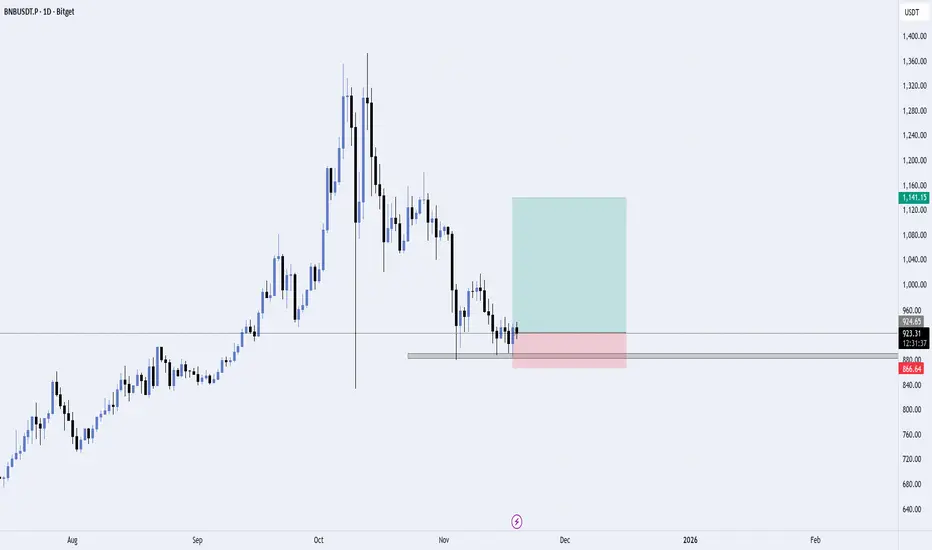
BNB/USDT – Bullish Reversal Idea | Demand Zone Reaction📌 Overview
BNB is currently trading at a major higher-timeframe demand zone, showing early signs of accumulation after a sharp sell-off. Price has tapped the demand area multiple times and is holding without breaking structure to the downside.
This setup is based on a potential short-term reversal or a relief bounce.
📍 Analysis
🔹 Demand Zone
Price is reacting from a clean demand zone created by previous strong bullish displacement.
Multiple wicks show buyers defending this level.
🔹 Market S
Latent View a Hidden Gem BUY with 2 Years Horizon
BUY LATENT VIEW
BUY ABOVE RS500 AND HOLD FOR 2 YEARS FOR A TARGET OF 1323.
Stock needs to break the upside resistance of Rs 573 with an entry on monthly close above 500.
It will rocket above 754 with is the the all time high.
Plotted the trendline for your understnading.
Below is the companies details. Great Share for Investors with a long time view.
The Company is a global digital analytics firm that inspires and transforms businesses to excel in the digital world by harnessing the power
BUY TODAY SELL TOMORROW for 5%DON’T HAVE TIME TO MANAGE YOUR TRADES?
- Take BTST trades at 3:25 pm every day
- Try to exit by taking 4-7% profit of each trade
- SL can also be maintained as closing below the low of the breakout candle
Now, why do I prefer BTST over swing trades? The primary reason is that I have observed that 90% of the stocks give most of the movement in just 1-2 days and the rest of the time they either consolidate or fall
Trendline Breakout in SAKSOFT
BUY TODAY SELL TOMORROW for 5%
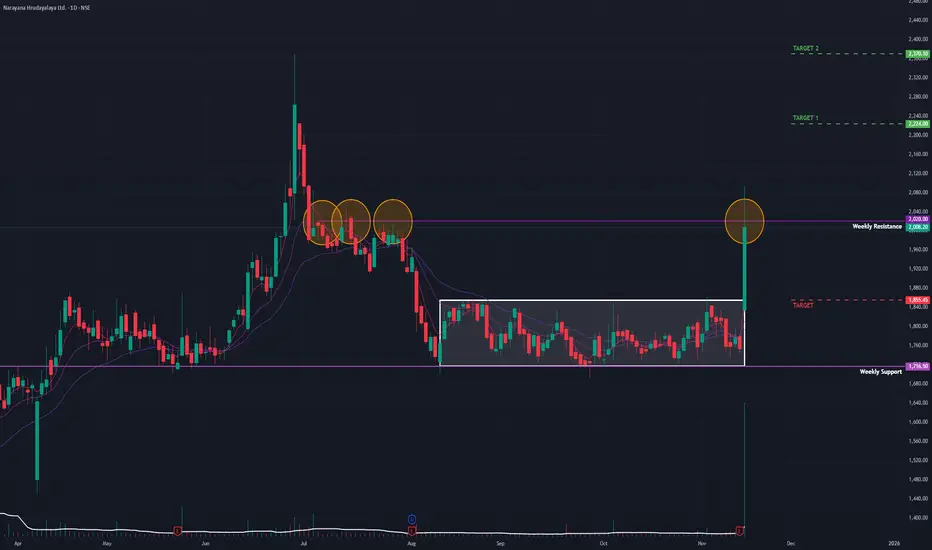
Narayana Hrudayalaya (D): Earnings-Driven BreakoutThe stock has decisively broken out of a 3-month consolidation phase. This technical breakout is powered by a strong fundamental catalyst (Q2 earnings), validating the surge and the high volume.
🚀 1. The Fundamental Catalyst (The "Why")
The breakout is a direct reaction to the company's Q2 FY26 Earnings announced today:
- Net Profit: Jumped 30% YoY to ₹258 crore.
- Revenue: Grew 20% YoY to ₹1,644 crore.
- Market Reaction: This stellar performance triggered the massive gap-up and
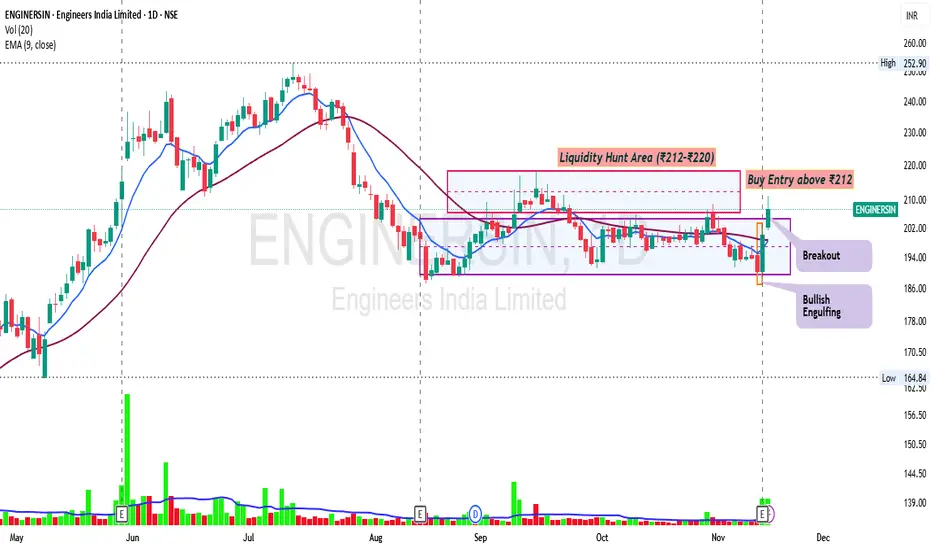
Technical View: Engineers India Ltd (EIL)Pattern Formation
The stock is moving inside a sideways accumulation range between ₹188–₹200.
Multiple swing highs formed in the ₹212–₹220 region created a liquidity pool.
Price repeatedly wicked above these highs, indicating Buy-Side Liquidity Hunt.
Breakout Behaviour
A strong bullish candle broke above the short-term descending line.
Sustaining above ₹212 will confirm a true breakout from the liquidity zone.
Candlestick Pattern
A strong bullish reversal candle formed at th
Money moves the market - Bank NiftyTraders say price moves the market. Bulls or bears move the market etc... But the fact is, money moves the market. You cannot ignore Bank Nifty when analyzing Nifty. When bank sector is supporting, Nifty gives a trending move.
Public sector bank stocks are on the move, while private sector bank stocks are not.
We can see that Bank Nifty was facing resistance around the 57500 zone for a long time, and now it is sustaining above it.
The rounding bottom pattern looks promising in Bank Nifty. Let u
L&T Multiyear BreakoutLarsen & Toubro Limited - Multi-Timeframe Breakout Analysis
Current Price:4,004.40
CRITICAL SETUP ALERT
L&T is at a pivotal moment with breakouts confirmed on weekly and monthly timeframes. The stock is now in a crucial period that will determine the validity of this range breakout.
KEY TECHNICAL OBSERVATIONS
Weekly Chart Analysis:
- Nearly 1.9 Years of Consolidation (2023-2025) between 3,200-3,800
- Clean breakout above 3,800 resistance with strong momentum
- All major EMAs (20/50/100/200) a
Samvardhana Motherson just made a triangle breakout.will it sustJust broke out of triangle pattern with good volume spike. Volumes are 3 times the average.
It brokeout of treandline on 12 September and gave a move of 10% before entring into consolidation of triangle pattern.
It just broke out of the pattern giving bullish signal.
Indicators
RSI is >60 which is a bullish signal
ADX is still weak at 13.38 although rising when compared to day before when it was 10.9
Entry at 110 looks safe
Might retrace till 100
SL at 95
Target at 119--130
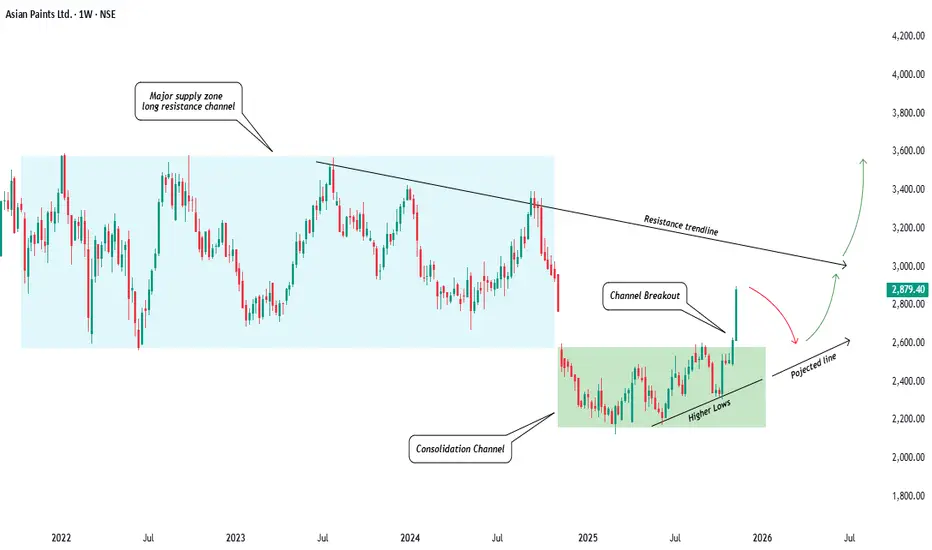
Asian Paints Turns Colorful Again!Hello Mates! Here’s a chart that really caught my attention this week Asian Paints showing strength after a long phase of quiet sideways movement. The structure is clean, the breakout is sharp, and the message from price action is clear momentum is shifting again.
After spending almost two years inside a broad consolidation zone between 3600 and 2600 (blue box), the stock finally formed a smaller accumulation base between 2200 and 2600 (green box). Within this base, price consistently made high
BANK NIFTY - Technical Analysis Bank Nifty is showing an interesting setup on the weekly chart.
After breaking out above its previous all-time high, the index has started contracting in a tight range, indicating healthy consolidation.
On the daily timeframe, it continues to take support near the 9 EMA, and during minor dips, it has also reversed from the 20 EMA, reflecting strong buying interest.
If Bank Nifty breaks out of this range with momentum, the upside potential remains open, sky’s the limit.
In case of a pullbac
DALMIA BHARATHello & welcome to this analysis
Technical Outlook:
In the monthly time frame its completing the formation of a Cup & Handle breakout suggesting upside levels for medium term 2800 - 3500, for long term 3800 - 5000
Accumulation can be done in the range of 1900 (on downside) 2300 (on the upside).
The view would be invalid if it goes below 1700
Fundamental Outlook
Cost and operational efficiency focus
Recognized as one of the lowest-cost cement producers in India, thanks to measures such as in
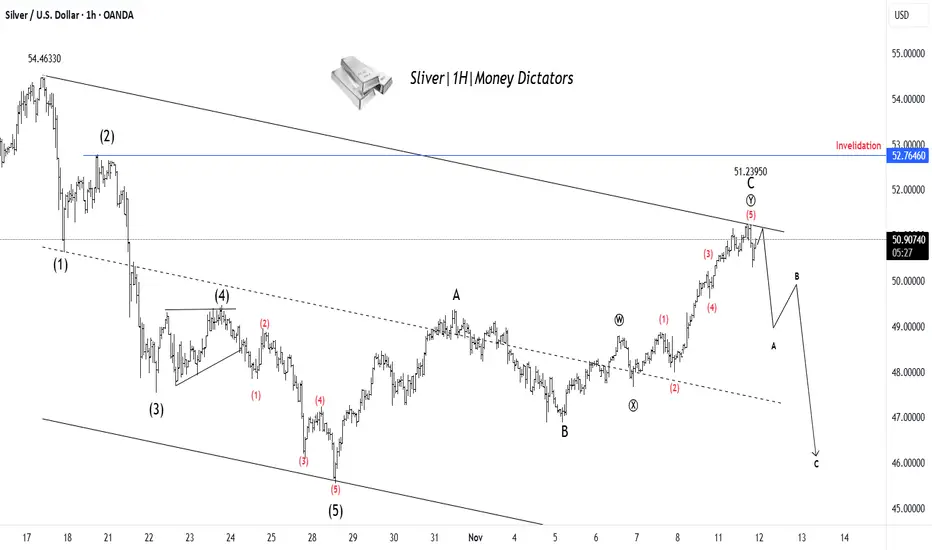
XAG/USD Set for Decline After Finishing Wave YSilver has completed a clear 5-wave upward move, ending near the 51.23 zone, which likely marks the completion of Wave C of the corrective structure. Price action shows rejection from the upper trendline, signaling that buying momentum is fading. This suggests the start of a new A–B–C corrective decline, where Silver could first drop toward 48–47 levels before any temporary bounce. The overall structure remains bearish in the short term unless the price breaks above the 52.76 invalidation zone.
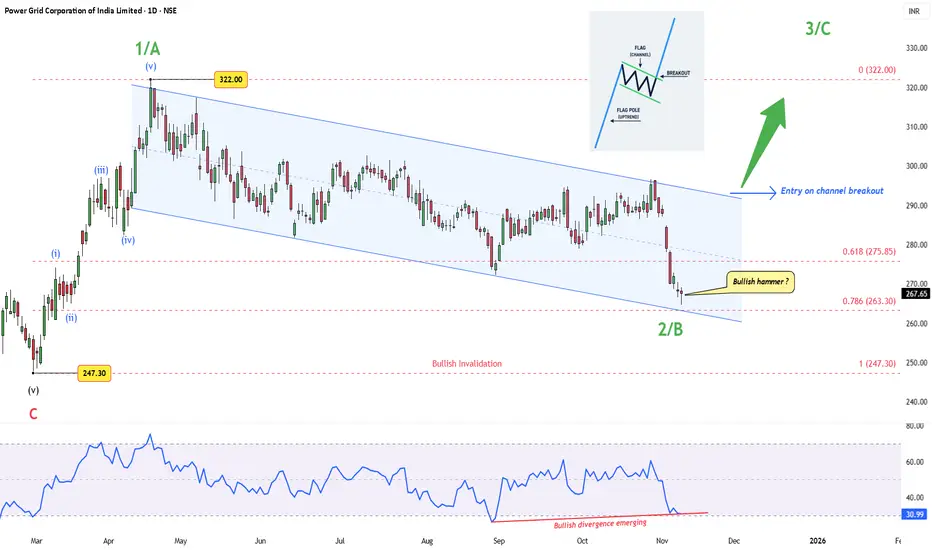
Power Grid – A Flag Within a WaveAfter completing a clean five-wave rally from ₹247.30 to ₹322, Power Grid has spent months in a controlled drift lower — a textbook corrective channel, likely forming Wave 2/B of the next major leg.
Price now sits near the 0.786 retracement (₹263 zone), showing early signs of exhaustion. A “ Bullish hammer? ” candle has appeared — not textbook-perfect, but hinting that buyers are starting to show up near prior demand.
The RSI divergence adds another layer — price made new lows, RSI didn’t. Tha
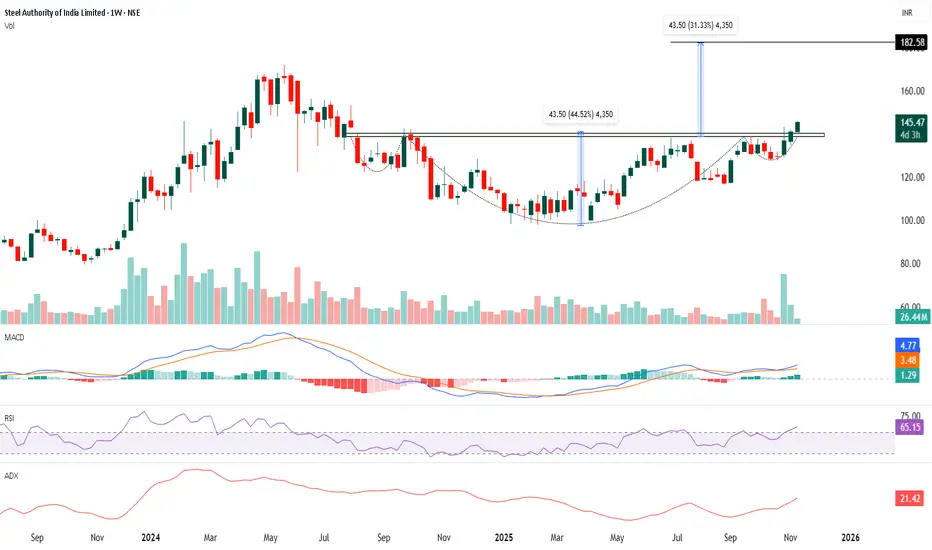
SAIL : LongTrend: The stock is forming a cup and handle pattern, which is a bullish continuation setup. It has broken out above the neckline around 140 levels, showing strength. The trend has turned positive after a long consolidation phase.
Volume: There is a clear increase in volume during the breakout, which confirms buying interest. Higher volume on breakout weeks indicates that buyers are active and the move is supported by participation.
Momentum (MACD): The MACD line has crossed above the signal l